Sugondo Hadiyoso* | Hasballah Zakarian | Paulus Anam Ong | Tati Latifah E.R. Mengko
© 2021 IIETA. This article is published by IIETA and is licensed under the CC BY 4.0 license (http://creativecommons.org/licenses/by/4.0/).
OPEN ACCESS
Post-stroke dementia (PSD) is a type of vascular dementia (VaD) that might be occurred in post-stroke patients. Memory, language and behavior tests can be used for the analysis of cognitive impairment caused by PSD. Often a supporting clinical examination such as an electroencephalogram (EEG) is used to support the diagnosis or analyze the characteristic changes that occur in the brain. Conventional analysis or visual inspection of EEG signals can be very difficult, since the nature of the signal tends to be non-stationer. Therefore, this study proposes a quantitative analysis for the characterization of EEG signals in stroke survivors with dementia. It is thought that it has different characteristics with the normal subject so that this study can be used as a reference in supporting dementia detection in post-stroke survivors. The quantitative analysis used in this study is coherence analysis. Coherence analysis was performed on EEG signals recorded from six poststroke patients with dementia and then compared with ten normal healthy subjects. Analysis of coherence between brain areas includes inter and intra-hemispheric coherence. Validation was carried out by using the independent t-test where the confidence level was 95%, indicating that the p-value <0.05 had a significant difference. The test results show that in general the coherence of the electrode pairs in patients with dementia is lower than in the normal healthy group. It is notably, i) In interhemispheric, the C3-C4, T3-T4, and T5-T6 pairs generate significant differences, ii) the highest decrease in intrahemispheric coherence was found in C3-T5 with p = 0.0005. The coherence study presented in this paper is expected to be used for early detection of PSD in the future.
post-stroke, dementia, EEG, coherence
Stroke is one of the non-contagious diseases that causes the highest death in the world [1]. In 2015 it was reported that more than 15 million of the population has died from stroke and others have permanent physical disabilities [2]. Another effect of stroke that is often ignored is cognitive impairment that may develop into dementia [3]. This condition will worsen the physiology of the patient so that he may lose his enthusiasm for life. Intensive care is required to delay this deterioration process. Accurate diagnosis is one of the important things to determine and design the right therapy [4].
Clinical examination through memory testing is the main standard in determining a person's cognitive status. The most popular and widely used memory tests include the Mini-Mental State Examination (MMSE) or Montreal Cognitive Assessment (MoCA) test [5]. Then a supporting examination is also needed in relation to the analysis of structural changes or mechanisms in the brain. One of the tools for dementia analysis that are cheap and efficient in setting up is the electroencephalogram (EEG) [6, 7]. Furthermore, EEG offers safe (low-risk), real-time and has a higher temporal resolution than other techniques such as MRI, CT, or PET imaging [8]. Since the stroke causes the death of a number of cells in the brain, the EEG is thought to be able to represent the brain condition of post-stroke patients with dementia. The electrical activity of the brain tissue will be disrupted in this condition. Thus, it is hoped that EEG can be a supporting tool in diagnosing post-stroke dementia.
EEG has been used for several decades to diagnose and management brain disorders [9]. A closely related disease is epilepsy where there is a direct disruption of electrical activity and an EEG can clearly illustrate how this disorder occurs [10]. Then in the last two decades, EEG has potential to observe brain cortical abnormalities associated with cognitive impairment [11, 12]. Furthermore, since computer-based digital signal processing has been widely developed, EEG signal analysis has become more fruitful. Recently this is well known as the Quantitative EEG (QEEG) [13, 14]. Quantitative EEG can provide information numerically related to the characteristics of the EEG waves if there is an abnormality in the brain. Several studies have focused on using QEEG to study brain dynamics in subjects with dementia.
Numerous studies have focused on the use of QEEG in the detection or analysis of the severity of dementia for example in Alzheimer's disease (AD) [14]. QEEG with various methodologies has been observed for detection or analysis of severity in AD. The proposed methodology includes analysis in the time, frequency, and time-frequency domains. Observations in the frequency domain as reported in, show a power increase in delta or theta band followed by a power decrease in alpha and beta band in Alzheimer's or probable Alzheimer's subjects [5, 15-17]. Study by Anuradha et al. [18], performed a time-frequency domain analysis in the AD group. His study showed similar results, that the EEG signal in the AD group tended to be dominant in the delta and theta bands at almost any time of observation (epoch). Meanwhile, in time domain analysis such as entropy based complexity, previous studies found that the complexity of the brain signal decreased in subjects with cognitive impairments and AD [19-21].
Most of the studies focused on the analysis of the EEG signal based on each scalp electrode, and proved a significant difference between normal healthy and demented people. If it is further observed, areas of the brain thought to have connections and synchronization to fully function in response to stimuli. This means that there are interactions between brain regions. Previous studies have found changes in connection and synchronization due to brain disorders in particular related to the decline in cognitive function. Several methods can be used in quantitative measurement of this property, coherence and synchronization are popular methods. Coherence measurement for the characterization of AD patients were reported in the study [15, 22-25]. Meanwhile, a phase synchronization study for characterization of AD patients was carried out in the study [26, 27]. The results of this study reported that there was a decrease in EEG coherence or synchronization in patients with cognitive impairment related to AD compared to normal/elderly healthy subjects.
Results of previous studies, showed that EEG has the chance to be a tool in studying the physiological changes in cognitive disorders. Various measurement methods show that there are characteristic changes between normal healthy subjects and subjects with pathology. They appear to be successful, but few studies have observed post-stroke dementia. Since the risk factor of post-stroke dementia is very high, the supporting criteria for detection of the disease are crucial. Recently, in 2014-2018, Al-Qazzaz et al. [28-30]. observed EEG signals in patients with vascular dementia and stroke-related patients with mild cognitive impairment (MCI). The measurement method is focused on the analysis of power spectral and signal complexity. They reported that the signal characteristics in stroke-related patients with mild cognitive impairment (MCI) and vascular dementia patients included increased low-frequency (delta) power and lower signal complexity than normal healthy subjects. However, measuring power must be very selective in separating the pure EEG signal from noise so that there is no calculation bias caused by artifacts noise. Moreover, elderly people may show slow EEG activity, which is then a limitation when normal elderly subjects and patients are compared. Therefore, to overcome this limitation, this study proposes a coherence measurement to characterize and discriminate normal elderly people and patients with post-stroke dementia. Coherence can be used to examine the relationship between two signals recorded from different brain regions. This can be used to analyze whether there is a change in connectivity between various brain regions due to dementia in post-stroke patients.
To the best of our knowledge, no studies have evaluated coherence measurement in post-stroke dementia patients. This is a great deal as other criteria in determining dementia in post-stroke patients. To attain this purpose, the study involved 16 volunteers consisting of ten normal healthy elderly people and six post-stroke patients with dementia from the memory clinic of Hasan Sadikin Hospital, Bandung, Indonesia. The determination of normal and dementia is based on an objective test using MMSE/MoCA. The resting EEG signal is then recorded using a 19-Channel Cadwell EasyIII amplification system. Coherence analysis includes inter and intra-hemispheric electrode pairs in order to obtain a detailed representation of each brain area. It is hoped that the coherence method can help clinicians in supporting the criteria for diagnosing dementia specifically in post-stroke patients.
3.1 EEG recording
This study involved post-stroke patients and normal subjects recruited by neurologist, Dr. Hasan Sadikin General Hospital Bandung, Indonesia. All participants agreed to be included in this study by confirming informed consent. This study has also obtained ethical approval No. LB.02.01/X.6.5/272/2019 from Hasan Sadikin Hospital's ethical committee. EEG recording was done at the diagnostic center of Dr. Hasan Sadikin General Hospital. In this study, sixteen sets of EEG signal recordings consisting of ten normal control subjects and five post-stroke patients (6 - 36 months follow up) with dementia were observed. Validation of stroke patients based on medical records and CT scan imaging. Confirmation of dementia and non-dementia through the MoCA test. Normal subject must conform the criteria include: healthy, never experienced brain injury, not indicated both of neurological and physiological disorders. The MoCA score shows > 25 for normal and < 19 for demented subjects. The demographics of the normal and patient groups are presented in Table 1.
Table 1. The demographics of the normal and patient groups
|
|
Normal control |
Patient with dementia |
|
Number of Samples |
10 |
6 |
|
Gender (M/F) |
6/4 |
3/3 |
|
Age |
57.9±3.6 |
58.2±4.79 |
|
Education (years) |
14.2±2.53 |
13.5±4.46 |
|
Stroke onset (Month) |
- |
16.67±10.89 |
|
MoCA-Ina |
26.6±0.6 |
11.67±5.08 |
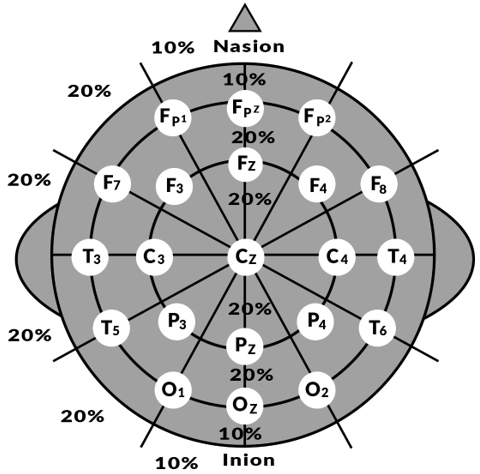
Figure 1. Scalp electrode placement in this study [12]
EEG signals are recorded using the Cadwell EasyIII amplification system with electrode placement according to 10-20 systems (Figure 1). Recordings were performed on nineteen unipolar EEG channels representing brain regions including pre-frontal, frontal, central, temporal and occipital. They are Fp1, Fp2, F7, F3, Fz, F4, F8, T3, C3, Cz, C4, T4, T5, P3, Pz, P4, T6, O1, and O2. A notch filter with a frequency of 50 Hz is applied to reject a large amount of power source noise. The raw EEG signal data is then stored at a sampling frequency of 250 Hz. Data is labeled in the European Data Format (EDF).
3.2 Coherence measurement
Coherence is a measure of the dynamic activity and spatial information of the brain in clinical EEG applications. Coherence provides an estimate of functional interactions or cortical connectivity between the nervous systems in all regions of the brain. It shows the spectral correlation between two different EEG electrodes. Coherence is a measure of synchronization between two signals based primarily on phase consistency. High coherence value occurs when the phase difference between channels tends to be constant. Therefore, it is considered an ideal measure related to brain disorders. Coherence analysis has also recently been used to study dementia associated with vascular disease specifically diabetes. Research conducted by Bian et al., reported that cognitive decline in diabetic patients affects EEG signals including decreased alpha and theta coherence in several brain areas compared to normal subjects [31]. The study that has been carried out provides the opportunity for coherence observation in post-stroke dementia cases which is proposed in this study. Coherence can be expressed by dividing the squared magnitude of the cross-spectral density of two channels by the product of the power spectral density of two channels. Where the power spectral density is the power distribution based on the frequency component of the signal. The power spectral density was calculated on the autocorrelation of the signal using a fast Fourier transform. The coherence (Cxy) of the x and y signals is calculated using power spectral density (Pxx and Pyy) and cross-spectral density (Pxy), Eq. (1) shows the calculation of coherence [32].
$C_{x y}(f)=\frac{\left|P_{x y}(f)\right|^{2}}{P_{x x}(f) * P_{v v}(f)}$ (1)
where, f is frequency. Eq. (1) will generate a coherence value with a range of 0 to 1, which has high coherence if the value is close to 1. In this study, coherence was measured based on two electrodes at different locations. Observations were carried out on interhemispheric (left and right hemisphere) and intrahemispheric (same region) connections. The mid channel including Fz, Cz and Pz is not calculated. Table 2 shows the electrode pairs for both scenarios. In this study, coherence is calculated in the conventional EEG band with a wide range of 1 - 30 Hz, as a representation of the delta, theta, alpha and beta bands.
3.3 Statistical analysis
In measuring the significant differences between groups which were observed, we used an independent t-test. We set the confidence level at 95% where the coherence between groups is considered significant difference if the p-value <0.05. All t-test calculations were performed on Ms. Excel. By testing the significance of differences, it is expected to know how coherence can be a discrimination feature.
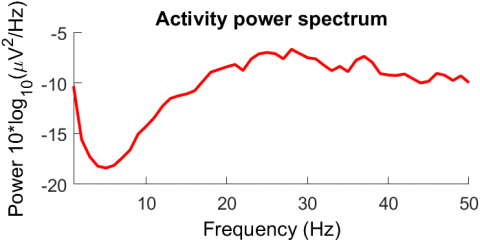
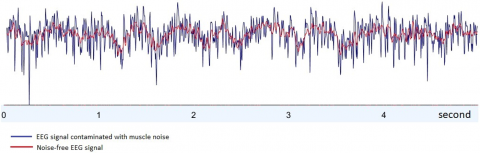
All EEG signals are filtered with a high-pass filter (1Hz cut off frequency) and a low-pass filter (30Hz cut off frequency) to reject large amounts of noise artifact both low frequency noise from eye blinking and high frequency noise due to muscle tension around the head. Figure 2 shows the power spectral of the EEG signal contaminated with muscle noise which was observed using the EEGLAB toolbox. It was seen that muscle noise typically has a dominant activity at high frequencies (above 20 Hz) which is not a typical EEG frequency. Figure 3 shows an example of an EEG signal from a T3 channel contaminated with noise (blue line). Figure 3 also shows the filtered EEG signal (red line). It is seen that the raw signal is mixed with high frequency noise as the power spectrum activity is shown in Figure 2 and the filtered signal already contains activity at lower frequencies.
The coherence of the 28 electrode pairs as shown in Table 2 was then measured. The average measurement results show that in general the coherence of the post-stroke dementia group is lower than the normal group. This condition occurs in almost all of the both of inter and intrahemispheric electrode pairs. Detailed results for each scenario are described in the following sub-sections.
Table 2. Inter and intra-hemisphere coherence electrode pairs
|
Interhemispheric |
Left-intrahemispheric |
Right-intrahemispheric |
||
|
Fp1-Fp2 |
Fp1-F3 |
F7-T3 |
Fp2-F4 |
F8-T4 |
|
F3-F4 |
Fp1-F7 |
F7-P3 |
Fp2-F8 |
F8-P4 |
|
F7-F8 |
Fp1-C3 |
F7-T5 |
Fp2-C4 |
F8-T6 |
|
C3-C4 |
Fp1-T3 |
F7-O1 |
Fp2-T4 |
F8-O2 |
|
T3-T4 |
Fp1-P3 |
C3-T3 |
Fp2-P4 |
C4-T4 |
|
P3-P4 |
Fp1-T5 |
C3-P3 |
Fp2-T6 |
C4-P4 |
|
T5-T6 |
Fp1-O1 |
C3-T5 |
Fp2-O2 |
C4-T6 |
|
O1-O2 |
F3-F7 |
C3-O1 |
F4-F8 |
C4-O2 |
|
|
F3-C3 |
T3-P3 |
F4-C4 |
T4-P4 |
|
|
F3-T3 |
T3-T5 |
F4-T4 |
T4-T6 |
|
|
F3-P3 |
T3-O1 |
F4-P4 |
T4-O2 |
|
|
F3-T5 |
P3-T5 |
F4-T6 |
P4-T6 |
|
|
F3-O1 |
P3-O1 |
F4-O2 |
P4-O2 |
|
|
F7-C3 |
T5-O1 |
F8-C4 |
T6-O2 |
Figure 2. Power spectral of the EEG signal contaminated with muscle noise
Figure 3. The raw and filtered EEG signal
4.1 Interhemispheric coherence
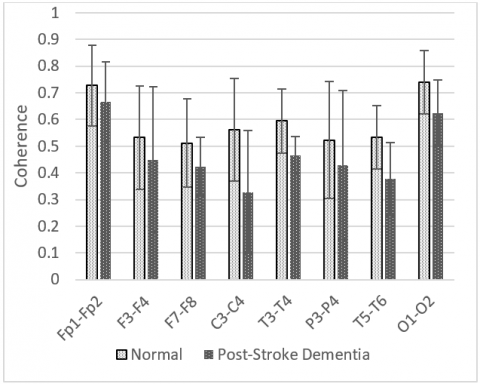
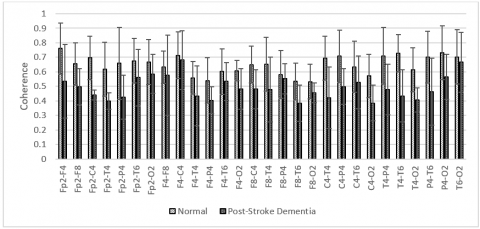
Interhemispheric coherence calculates the EEG coherence of the right and left hemisphere for the inline electrodes. The results of the mean interhemispheric coherence for each electrode pair are presented in Figure 4. Figure 4 shows that the mean coherence in patients with dementia is lower than the normal control for all electrode pairs, although in some electrode pairs generates a high overlap of standard deviation. Significant differences (p <0.05) were found in the central and temporal areas, C3-C4, T3-T4, and T5-T6 pairs as shown in Table 3. Coherence reduction can be presumed due to decreased electrical connectivity that connects brain areas.
Figure 4. Interhemispheric coherence values of each electrode pair
Table 3. Interhemispheric coherence values which generate p <0.05
|
Electrode pairs |
p-value |
|
C3-C4 |
0.034 |
|
T3-T4 |
0.037 |
|
T5-T6 |
0.029 |
4.2 Intrahemispheric coherence
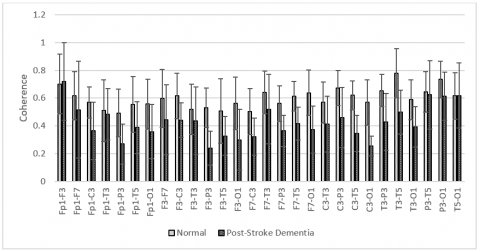
In presenting a comprehensive analysis, we also investigated intrahemispheric electrode pairs by measuring the coherence of electrode pairs in the same brain area. They include right and left intrahemispheric. The observed electrode pairs are shown in the Table 2. The results of the mean right intrahemispheric coherence for each electrode pair are presented in Figure 5. The results showed that there was a decrease in right intrahemispheric coherence in patients with dementia, occurred in all electrode pairs. After the significance test, we found that the electrode pairs on the Fp2-F4, Fp2-C4, Fp2-T4, F4-O2, F8-T4, C4-T4, T4-P4, T4-T6, and T4-O2 generates a p-value <0.05 as shown in Table 4. The highest decrease in coherence was found in F4-O2 with p = 0.004.
Meanwhile, the mean left intrahemispheric shows a similar characteristic where patients with dementia decrease in the coherence value of almost all electrode pairs except Fp1-F3 dan T5-O1. Figure 6 depicts the mean left intrahemispheric coherence for each electrode pair. Significant differences with p <0.05 were found for the F3-P3, F3-O1, F7-P3, F7-T5, F7-O1, C3-T5, C3-O1, T3-T5, and T3-O1 pairs as shown in Table 5. The highest decrease in left intrahemispheric coherence was found in C3-T5 with p = 0.0005.
Table 4. Right intrahemispheric coherence values which generate p <0.05
|
Electrode pairs |
p-value |
|
Fp2-F4 |
0.049 |
|
Fp2-C4 |
0.013 |
|
Fp2-T4 |
0.016 |
|
F4-O2 |
0.004 |
|
F8-T4 |
0.039 |
|
C4-T4 |
0.011 |
|
T4-P4 |
0.018 |
|
T4-T6 |
0.016 |
|
T4-O2 |
0.035 |
Table 5. Left intrahemispheric coherence values which generate p <0.05
|
Electrode pairs |
P-value |
|
F3-P3 |
0.044 |
|
F3-O1 |
0.032 |
|
F7-P3 |
0.047 |
|
F7-T5 |
0.008 |
|
F7-O1 |
0.006 |
|
C3-T5 |
0.000 |
|
C3-O1 |
0.001 |
|
T3-T5 |
0.026 |
|
T3-O1 |
0.039 |
Figure 5. Right intrahemispheric coherence values of each electrode pair
Figure 6. Left intrahemispheric coherence values of each electrode pair
Since EEG contains a large amount of noise, signal filtering is a typical one that must be performed. Muscle artifact with a frequency of more than 30Hz often interfere with EEG signals. Therefore, the raw EEG signal is filtered with frequency response of 1-30Hz. Figure 3 shows a sample denoising the EEG signal for channel "T3". It can be seen that the components of the muscle noise with dominant activity at high frequency are successfully suppressed. Thus the bias of the coherence measurement can be suppressed typically in the measurement of the temporal area where the power of the muscle noise can disrupt the EEG signal.
After the denoise was performed using a conventional filter, the coherence for the electrode pairs is calculated using Equation 1. Comprehensive investigations were carried out including Interhemispheric and Intrahemispheric coherence. Figures 4, 5 and 6 show the mean and standard deviation of coherence between post-stroke dementia and normal control subjects. Indications of the significant difference are also presented. In the anterior-posterior intrahemispheric mean coherence, it appears that there is a decrease in the coherence value in both of the groups observed. This is consistent with studies by Jeong et al. [15]. where the local coherence value is higher than the distal coherence value.
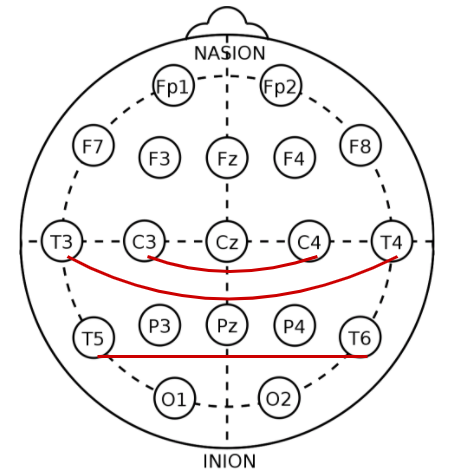
Figure 7. The electrode pairs in right-left interhemispheric coherence with p <0.05
Interhemispheric observations showed that the mean coherence value in dementia patients was decreased compared to normal control subjects Cohdem < Cohcontrol) for all electrode pairs. Significantly found in C3-C4, T3-T4, and T5-T6 pairs (p<0.05) as shown in Figure 7. It represents the central and temporal lobe regions. Our findings confirm the study by Al-Qazzaz et al. [28, 29], which investigated the signal complexity in stroke patients related cognitive impairment, showing that there was a significant reduction in signal in the central and temporal regions. We presumed that stroke-related dementia patients have damaged a number of neurons and synapses in these regions. In contrast to Alzheimer's, a coherence right-left interhemispheric significant reduction is common in the frontal lobe region [15].
In observing intrahemispheric coherence, we also found a reduction in coherence in patients compared to normal control subjects. There were significant differences found in the electrode pairs of local and distal intrahemispheric coherence, includes frontal, central and temporal. These results represent the consistency with the measurement of interhemispheric coherence where the central and temporal regions have a coherence reduction resulted from a failure of functional connectivity. Thus it can be thought that a decrease in coherence values between brain regions correlates strongly with cognitive impairment as reported in the study [33-35].
The coherence investigation in this study showed a pattern of decreased coherence values in post-stroke dementia patients compared with normal elderly subjects. The most likely reason that could be accepted for the lower coherence is the death of a large number of neurons and degeneration of synapses leading to decreased function of cortical connectivity [15, 36]. This can be interpreted as a disconnection syndrome of functional interactions between regions in the brain [25]. In this study we also found that cognitive impairment in post-stroke dementia patients might be associated with decreased coherence in the temporal lobe, which plays an important role in hearing, language and memory [37-39]. The low reduction or insignificant difference in other regions may be because the post-stroke dementia patients involved in this study still had normal vision and were not aphasia, represented in the frontal and occipital regions, respectively.
Although this study provides an important finding, there are limitations that can be of concern. First, the number of subjects involved in the study was small, particularly post-stroke patients. The second limitation is that the analysis was not performed in post-stroke patients with no dementia. This may be very important as a baseline because it is a relevant comparison rather than normal elderly subjects. At least the preliminary findings of this study suggest that coherence analysis of EEG signals can be a method of investigating and distinguishing dementia in post-stroke patients. It is also hoped that it can be used to investigate the severity of post-stroke dementia so that it can be used for early detection. Future studies need to be extended to larger populations in order to comply statistical criteria that can be considered as supporting clinical diagnostics.
In this study, we have characterized and investigated the EEG coherence of 6 post-stroke patients with dementia and 10 normal healthy subjects. The inter and intrahemispheric coherence of the set number of electrode pairs from a combination of 16 channels was measured. Both of the mean inter and intrahemispheric coherence mostly show a decrease of coherence values in post-stroke dementia patients. By statistical analysis, it is found that the reduction in signal coherence is significant in the central and temporal region pairs. The findings in this preliminary study provide a modality for the method of characterizing brain signals in post-stroke patients with dementia. However, this study is still limited to a small number of subjects. At least it can provide knowledge that the EEG has potential in studying dementia in post-stroke patients. In future studies, we plan to implement a coherence method in the early detection system for post-stroke dementia by involving post-stroke patients related to mild cognitive impairment.
Authors would like to thank the Directorate General of Higher Education, Ministry of Education of the Republic of Indonesia in research funding through the Research Grant "Penelitian Disertasi Doktor" contract No. 2/E1/KP.PTNBH/2021. The authors would also like to thank neurologists and medical practitioners of Dr. Hasan Sadikin General Hospital, Bandung for supporting EEG recording. Acknowledgments are also given to Telkom University in providing a laboratory for simulation and Lembaga Pengelola Dana Pendidikan (LPDP) in providing the scholarships.
[1] Moghtaderi, A., Alavi-Naini, R. (2012). Infective causes of stroke in tropical regions. Iranian Journal of Medical Sciences, 37(3): 150-158. https://doi.org/10.3390/met11020309
[2] Katan, M., Luft, A. (2018). Global health neurology. Semin Neurol, 38: 208-211. https://doi.org/10.1055/s-0038-1649503
[3] Mellon, L., Brewer, L., Hall, P., Horgan, F., Williams, D., Hickey, A. (2015). Cognitive impairment six months after ischaemic stroke: A profile from the ASPIRE-S study. BMC Neurology, 15(1): 1-9. https://doi.org/10.1186/s12883-015-0288-2
[4] Hwang, A.B., Boes, S., Nyffeler, T., Schuepfer, G. (2019). Validity of screening instruments for the detection of dementia and mild cognitive impairment in hospital inpatients: A systematic review of diagnostic accuracy studies. PLoS ONE, 14(7): 1-30. https://doi.org/10.1371/journal.pone.0219569
[5] Henderson, G., Ifeachor, E., Hudson, N., Goh, C., Outram, N., Wimalaratna, S. (2006). Development and assessment of methods for detecting dementia using the human electroencephalogram. IEEE Transactions on Biomedical Engineering, 53(8): 1557-1568. https://doi.org/10.1109/TBME.2006.878067
[6] Al-Qazzaz, N.K., Ali, S.H.B.M., Ahmad, S.A., Chellappan, K., Islam, M.S., Escudero, J. (2014). Role of EEG as biomarker in the early detection and classification of dementia. Scientific World Journal, pp. 1-16. https://doi.org/10.1155/2014/906038
[7] Cassani, R., Estarellas, M., San-Martin, R., Fraga, F.J., Falk, T.H. (2018). Systematic review on resting-state EEG for Alzheimer’s disease diagnosis and progression assessment. Disease Markers, pp. 1-26. https://doi.org/10.1155/2018/5174815
[8] Lystad, R.P., Pollard, H. (2009). Functional neuroimaging: A brief overview and feasibility for use in chiropractic research. The Journal of the Canadian Chiropractic Association, 53(1): 59-72.
[9] Ricardo, J.A.G., França Jr., M.C., Lima, F.O., Yassuda, C.L., Cendes, F. (2012). The impact of EEG in the diagnosis and management of patients with acute impairment of consciousness. Arquivos de Neuro-Psiquiatria, 70(1): 34-39. https://doi.org/10.1590/s0004-282x2012000100008
[10] Smith, S.J. (2005). EEG in the diagnosis, classification, and management of patients with epilepsy. Journal of Neurology, Neurosurgery & Psychiatry, 76(suppl 2): ii2-ii7. https://doi.org/10.1136/jnnp.2005.069245
[11] Klimesch, W. (2012). Alpha-band oscillations, attention, and controlled access to stored information. Trends in Cognitive Sciences, 16(12): 606-617. https://doi.org/10.1016/j.tics.2012.10.007
[12] Sanei, S., Chambers, J.A. (2007). EEG Signal Processing. John Wiley & Sons. https://doi.org/10.1002/9780470511923
[13] Billeci, L., Sicca, F., Maharatna, K., Apicella, F., Narzisi, A., Campatelli, G. (2013). On the application of Quantitative EEG for characterizing autistic brain: A systematic review. Frontiers in Human Neuroscience, 7(JUL): 1-15. https://doi.org/10.3389/fnhum.2013.00442
[14] Kanda, P.A.D.M., Anghinah, R., Smidth, M.T., Silva, J.M. (2009). The clinical use of quantitative EEG in cognitive disorders. Dementia & Neuropsychologia, 3(3): 195-203. https://doi.org/10.1590/S1980-57642009DN30300004
[15] Jeong, D.H., Kim, Y. Do, Song, I.U., Chung, Y.A., Jeong, J. (2016). Wavelet energy and wavelet coherence as eeg biomarkers for the diagnosis of Parkinson’s disease-related dementia and Alzheimer’s disease. Entropy, 18(1): 1-17. https://doi.org/10.3390/e18010008
[16] Fauzan, N., Amran, N.H. (2015). Early Detection of Mild Cognitive Impairment, Dementia and Alzheimer’s Using QEEG. European Journal of Interdisciplinary Studies, 3(1): 149. https://doi.org/10.26417/ejis.v3i1.p149-153
[17] Gouw, A.A., Alsema, A.M., Tijms, B.M., Borta, A., Scheltens, P., Stam, C.J., van der Flier, W.M. (2017). EEG spectral analysis as a putative early prognostic biomarker in nondemented, amyloid positive subjects. Neurobiology of Aging, 57: 133-142. https://doi.org/10.1016/j.neurobiolaging.2017.05.017
[18] Anuradha, G., Jamal, N., Rafiammal, S. (2017). Detection of dementia in EEG signal using dominant frequency analysis. In 2017 IEEE International Conference on Power, Control, Signals and Instrumentation Engineering (ICPCSI), pp. 710-714. https://doi.org/10.1109/ICPCSI.2017.8391806
[19] Gómez, C., Hornero, R. (2010). Entropy and complexity analyses in Alzheimer’s disease: An MEG study. The Open Biomedical Engineering Journal, 4: 223-235. https://doi.org/10.2174/1874120701004010223
[20] Mizuno, T., Takahashi, T., Cho, R.Y., Kikuchi, M., Murata, T., Takahashi, K., Wada, Y. (2010). Assessment of EEG dynamical complexity in Alzheimer’s disease using multiscale entropy. Clinical Neurophysiology, 121(9): 1438-1446. https://doi.org/10.1016/j.clinph.2010.03.025
[21] Maturana-Candelas, A., Gómez, C., Poza, J., Pinto, N., Hornero, R. (2019). EEG characterization of the Alzheimer’s disease continuum by means of multiscale entropies. Entropy, 21(6): 1-15. https://doi.org/10.3390/e21060544
[22] Kopal, J., Vyšata, O., Procházka, A., Schätz, M. (2013). EEG microstates in Alzheimer’s disease computed by continuous wavelet coherence. Journal of the Neurological Sciences, 2013: e352. https://doi.org/10.1016/j.jns.2013.07.1293
[23] Chen, C.C., Hsu, C.Y., Chiu, H.W., Hu, C.J., Lee, T.C. (2015). Frequency power and coherence of electroencephalography are correlated with the severity of Alzheimer’s disease: A multicenter analysis in Taiwan. Journal of the Formosan Medical Association, 114(8): 729-735. https://doi.org/10.1016/j.jfma.2013.07.008
[24] Ho, M.C., Chen, T.C., Huang, C.F., Yu, C.H., Chen, J.M., Huang, R.Y. (2014). Detect AD patients by using EEG coherence analysis. Journal of Medical Engineering, 2014: 1-5. https://doi.org/10.1155/2014/236734
[25] Wang, R., Wang, J., Yu, H., Wei, X., Yang, C., Deng, B. (2014). Decreased coherence and functional connectivity of electroencephalograph in Alzheimer’s disease. Chaos, 24(3): 033136. https://doi.org/10.1063/1.4896095
[26] Fatima, M., Faraz, A., Azeem, W., Zaeem, M., Shafique, M. (2019). Detection of Alzheimer ’s disease based on phase synchronization measures in EEG signals. Pakistan Journal of Science, 71(4): 164-168.
[27] Handayani, N., Haryanto, F., Khotimah, S.N., Arif, I., Taruno, W.P. (2018). Coherence and phase synchrony analyses of EEG signals in Mild Cognitive Impairment (MCI): A study of functional brain connectivity. Polish Journal of Medical Physics and Engineering, 24: 1-9. https://doi.org/10.2478/pjmpe-2018-0001
[28] Al-Qazzaz, N.K., Ali, S., Ahmad, S.A., Escudero, J. (2017). Stroke-related mild cognitive impairment detection during working memory tasks using EEG signal processing. In 2017 Fourth International Conference on Advances in Biomedical Engineering (ICABME), pp. 1-4. https://doi.org/10.1109/ICABME.2017.8167557
[29] Al-Qazzaz, N.K., Ali, S., Islam, M.S., Ahmad, S.A., Escudero, J. (2016). EEG markers for early detection and characterization of vascular dementia during working memory tasks. In IECBES 2016 - IEEE-EMBS Conference on Biomedical Engineering and Sciences, pp. 347-351. https://doi.org/10.1109/IECBES.2016.7843471
[30] Al-qazzaz, N.K., Ali, S.H. (2018). Technique in discriminating vascular dementia EEGs. In 2018 2nd International Conference on BioSignal Analysis, Processing and Systems (ICBAPS), pp. 109-112.
[31] Bian, Z., Li, Q., Wang, L., Lu, C., Yin, S., Li, X. (2014). Relative power and coherence of EEG series are related to amnestic mild cognitive impairment in diabetes. Frontiers in Aging Neuroscience, 6: 1-9. https://doi.org/10.3389/fnagi.2014.00011
[32] Challis, R.E., Kitney, R.I. (1991). Biomedical signal processing (in four parts) - Part 3 The power spectrum and coherence function. Medical & Biological Engineering & Computing, 29(3): 225-241. https://doi.org/10.1007/BF02446704
[33] Jiang, Z.Y. (2005). Study on EEG power and coherence in patients with mild cognitive impairment during working memory task. Journal of Zhejiang University Science B, 6(12): 1213-1219. https://doi.org/10.1631/jzus.2005.B1213
[34] Fonseca, L.C., Tedrus, G.M.A.S., Prandi, L.R., Almeida, A.M., Furlanetto, D.S. (2011). Alzheimer’s disease: relationship between cognitive aspects and power and coherence EEG measures. Arquivos de Neuro-Psiquiatria, 69(6): 875-881. https://doi.org/10.1590/s0004-282x2011000700005
[35] Van der Hiele, K., Vein, A.A., Reijntjes, R.H.A.M., Westendorp, R.G.J., Bollen, E.L.E.M., van Buchem, M.A. (2007). EEG correlates in the spectrum of cognitive decline. Clinical Neurophysiology, 118(9): 1931-1939. https://doi.org/10.1016/j.clinph.2007.05.070
[36] Smailovic, U., Koenig, T., Kåreholt, I., Andersson, T., Kramberger, M.G., Winblad, B., Jelic, V. (2018). Quantitative EEG power and synchronization correlate with Alzheimer’s disease CSF biomarkers. Neurobiology of Aging, 63: 88-95. https://doi.org/10.1016/j.neurobiolaging.2017.11.005
[37] Snaphaan, L., Rijpkema, M., Van Uden, I., Fernández, G., De Leeuw, F.E. (2009). Reduced medial temporal lobe functionality in stroke patients: A functional magnetic resonance imaging study. Brain, 132(7): 1882-1888. https://doi.org/10.1093/brain/awp133
[38] University of Wisconsin-Madison. (2019). Brain Lobes and Effects of Stroke. UW Health. Retrieved from http://www.uwhealth.org/healthfacts/stroke/5593.pdf
[39] Kalaria, R.N., Akinyemi, R., Ihara, M. (2016). Stroke injury, cognitive impairment and vascular dementia. Biochimica et Biophysica Acta - Molecular Basis of Disease, 1862(5): 915-925. https://doi.org/10.1016/j.bbadis.2016.01.015