Wenying Ma
© 2021 IIETA. This article is published by IIETA and is licensed under the CC BY 4.0 license (http://creativecommons.org/licenses/by/4.0/).
OPEN ACCESS
To solve the small sample problem of biometric identification, this paper investigates the limiting case of the problem, i.e., the recognition of a single training sample, and proposes a single sample discriminant analysis method based on Gabor wavelet and KPCA-RBF (KPRC) classifier (kernel principal component analysis-radial basis function). The proposed method performs pixel-level fusion of face and palmprint images. Firstly, a face image and a palmprint image were subject to two-dimensional (2D) Gabor wavelet transform. The resulting Gabor face image and Gabor palmprint image were fused on the pixel level into a new fused image. Next, a new classifier called KPCA-RBF was designed to extract nonlinear discriminative features by KPCA, and classify objects with RBF. Based on AR database, FERET database, and palmprint database, the single sample discriminant analysis method was realized based on Gabor transform and KPCA-RBF classifier. Experimental results show that multimodal recognition methods clearly outshine single-modal recognition methods, and the GABOR-KPRC with pixel-level fusion achieves better recognition effect than other fusion methods. It was also demonstrated that Gabor transform and KPRC classifier can effectively improve the fusion effect, whether for pixel-level fusion or decision-level fusion.
Gabor transform, KPCA-RBF (kernel principal component analysis-radial basis function), classifier, pixel-level fusion, single-sample discriminant analysis
Biometric identification is a technology that identifies humans based on their unique physiological or behavioral features. It provides a highly reliable and stable way of identification. Two of the most concerned aspects of biometric identification are frequency domain tool and nonlinear identification method.
Fourier transform [1] is a widely used image processing technology. As an orthogonal transform, Fourier transform converts complex convolution operations in the space domain into simple product operations in the frequency domain, and effectively enhances images, extracts features, and restores images in the latter domain. Discrete cosine transform (DCT) converts face images to the frequency domain, and extracts face features (DCT coefficient) for recognition.
Both Fourier transform and DCT transform can extract signal frequency, a global feature. However, time domain information of a signal cannot be learned from the obtained spectrum. This is no problem for a stable signal, whose frequency information always exists in the time domain. If the signal is unstable, i.e., variable in frequency, however, it is impossible to learn from the spectrum when a certain frequency appears and when it disappears.
The key to solving the above problem is to extract the frequency features and time domain information of the signal simultaneously. In this way, it is possible to identify signals similar in frequency spectrum, yet completely different in time domain. Many mathematical transforms are capable of simultaneously extracting the required information, such as various wavelet transforms.
Wavelet analysis theory is an emerging time-frequency domain tool [2, 3]. Since the inception of the theory, researchers have been highlighting its engineering application. In 1984, French geologists Morlet et al. pioneered the application of wavelet to analyze and process geological data [4, 5]. As the relevant research goes deeper and the application extends further, wavelet analysis has been proved superior in many fields, such as filtering, signal processing, and image processing.
One of wavelet transforms is Gabor transform. The Gabor function is the only function that can reach the lower bound of the uncertainty relation, and meet the required resolution for signal analysis in both time and frequency domains. As a result, this function has been extensively adopted for signal processing. The local, selective direction, and bandpass property of Gabor transform ensure the accuracy of local feature extraction from images, and enhances the resistance to interferences. Studies have shown that Gabor transform excels in texture analysis of skins. Kong et al. [6] introduced the two-dimensional (2D) Gabor phase encoding of iris recognition to extract the palmprint features in frequency domain. In 2002, Liu and Wechsler [7] combined Gabor transform with enhanced linear discriminant analysis to recognize human faces. Later, Liu [8] proposed Gabor-KPCA (kernel principal component analysis), which achieved excellent results on human face recognition. In 2009, Zhu and Liu [9] proposed a human face recognition method based on 2D Gabor wavelet and support vector machine (SVM).
Single sample recognition is the main difficulty in biometric identification. It is an extreme case of small sample identification. In reality, it is often necessary to recognize human faces with a single training image. For example, the national security department manages the file of all the population in the country. Due to the sheer size of the population, the file of each person contains only one photo.
Quite a few researchers have tried to recognize human faces with a single training image. Some attempt to solve the problem in the field of face recognition [10-13]. Nevertheless, the existing methods cannot achieve good identification effects on large biological databases. Most scholars consider multimodal biological fusion as a feasible solution, because the recognition effect can be improved through the complementation between different biological features. Hong and Jain [14] improved face recognition by combining fingerprint and face features. Jain and Ross [15] fully integrates three biological features: face, fingerprint, and palmprint. The fusion of biological recognition technologies usually involves two steps: First, select the complementary information that facilitates recognition; Second, design an effective fusion method. The fusion can be implemented on three different levels [16]: pixel level, feature level, and decision (classification) level. So far, most research focuses on decision-level fusion, which is the highest-level fusion technique [17].
Through the above analysis, this paper firstly performs 2D Gabor wavelet transform of face and palmprint images, and fuses the resulting Gabor face image and Gabor palmprint image on the pixel level into a new fused image. Next, a new classifier called KPCA-RBF (kernel principal component analysis-radial basis function) was designed to extract nonlinear discriminative features by KPCA, and classify objects with RBF. Based on AR database, FERET database, and palmprint database, the single sample discriminant analysis method was realized based on Gabor transform and KPCA-RBF classifier.
The remainder of this paper is organized as follows: the new method was introduced, followed by experiments and results analysis; the end of the manuscript summarizes the findings and predicts the future research.
2.1 Gabor face image and Gabor palmprint image
The single-sample problem can be solved by acquiring richer information from images. Therefore, Gabor transform was performed on face images and palmprint images. As mentioned above, the local, selective direction, and bandpass property of Gabor transform ensure the accuracy of local feature extraction from images, and enhances the resistance to interferences.
As a band-pass filter, the 2D Gabor filter boasts good directional selectivity in the spatial domain and good frequency selectivity in the frequency domain. The parameter design of the Gabor filter directly affects the recognition rate of the algorithm. On the spectrum, the half-peak amplitudes of the response from the Gabor filter group should contact each other, but without any overlap. This is the only way to prevent the loss of image information, and reduce data redundancy. In this paper, a 2D Gabor wavelet is designed from Gabor filters of 4 central frequencies and 8 directions, and used to extract image textures of different frequency scales and directions.
The basic form of the adopted periodic Gabor filter can be described by:
$G(x, y, \theta, u, \sigma)=\frac{1}{2 \pi \sigma^{2}} \exp \left\{-\frac{x^{2}+y^{2}}{2 \sigma^{2}}\right\} \exp \{2 \pi i(u x \cos \theta+u y \sin \theta)\}$ (1)
where, $i=\sqrt{-1}$; u is sine wave frequency; θ is the direction of the control function; σ is the standard deviation of the Gaussian function.
For the filter parameters in formula (1), σ was set to {2,4,8,16}, u=1/σ, and θ={0,1,2,3,4,5,6,7}×(π/8). Therefore, the designed Gabor transform contains 4 scales and 8 directions.
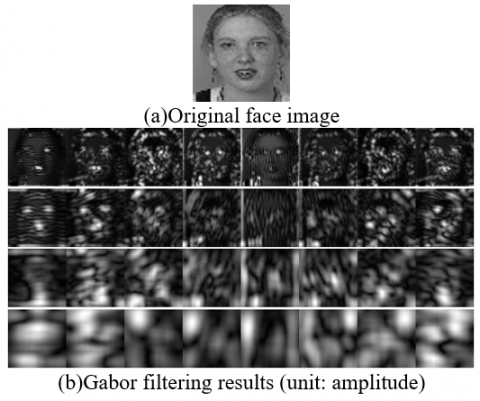
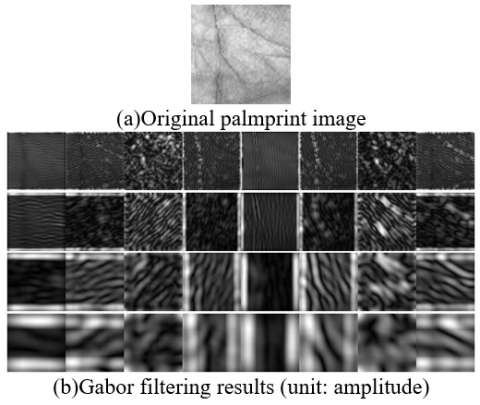
Figure 1 shows the face images (size: 60×60) after Gabor transform. Figure 2 shows the palmprint images (size: 60×60) after Gabor transform.
Figure 1. Gabor transform of face images
Figure 2. Gabor transform of palmprint images
2.2 Pixel-level fusion of Gabor face image and Gabor palmprint image
This subsection introduces the fusion between standard Gabor face and palmprint images.
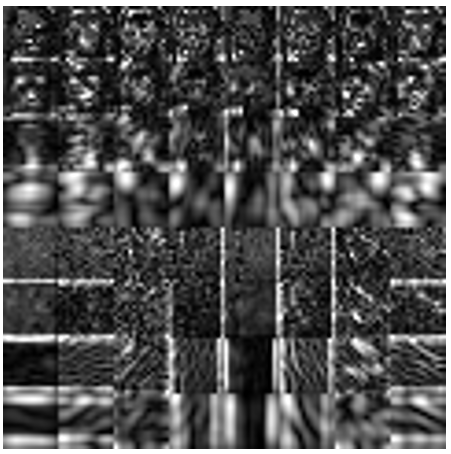
Let Xface and Xpalm be the face image set and the palmprint image set; xface be a sample (size: 60×60) of face image set xface. Through Gabor transform, a total of 32 images can be obtained on four scales and in eight directions from xface (Figure 1). Then, the obtained images are merged according to the sequence of transform, producing a Gabor face image xGaborface. The initial size of xGaborface is 240×480. To reduce the computing cost, each Gabor image was down-sampled with the rate of 4. Thus, xGaborface was reduced to the size 60×120. Each sample xpalm of Xpalm was processed similarly to obtain a new sample xGaborpalm after Gabor transform.
After that, xGaborface and xGaborpalm were merged into a fused sample xfuse of the size 120×120. In this way, a set of fused samples Xfuse could be obtained.
Figure 3 shows the fused samples obtained from Figures 1 and 2.
Figure 3. Fused samples
Owing to the different imaging conditions between face and palmprint images (e.g., illumination changes, and different settings of focal lens), it is necessary to normalize the pixels of the fused images. xfuse can be normalized by:
$x_{\text {norm-fuse }}=\frac{x_{\text {fuse }}-\mu_{\text {fuse }}}{\sigma_{\text {fuse }}}$ (2)
where, μfuse and σfuse are the mean and variance of fused sample set Xfuse, respectively. Note that xfuse, xnorm-fuse, μfuse, and σfuse are all described as matrices. Hence, a normalized fused sample set Xnorm-fuse was obtained.
The fused images are often high-dimensional. The existing solutions to single sample problem generally rely on principal component analysis (PCA) to extract the discriminative features from images, and then classify the features by the nearest neighbor method. This paper proposes a novel classifier called KPCA-RBF, which uses KPCA to extract nonlinear discriminative features, and adopts RBF neural network for classification.
3.1 Single sample KPCA
Suppose the single sample problem involves c types of samples, each of which has only one training sample. In other words, there are a total of c samples. In this case, the within-class scatter does not exist among training samples. It is only possible to obtain between-class scatter. Then, the between-class scatter matrix $S_{b}^{\varphi}$ in feature space F can be described by:
$S_{b}^{\phi}=\frac{1}{c} \sum_{i=1}^{c}\left(\phi\left(\mathrm{x}_{i}\right)-m^{\phi}\right)\left(\phi\left(\mathrm{x}_{i}\right)-m^{\phi}\right)^{T}$ (3)
where, ϕ(xi) is the training sample of type i; mϕ is the mean of all training samples.
In the feature space F, the criterion of KPCA can be defined as:
$J\left(W^{\phi}\right)=W^{\phi T} S_{b}^{\phi} W^{\phi}$ (4)
The projection matrix Wϕ can be described as a linear combination in feature space F:
$W^{\phi}=\sum_{i=1}^{c} a_{i} \phi\left(\mathrm{x}_{i}\right)=\Psi \alpha$ (5)
Substituting formulas (3) and (5) into formula (4):
$J(\alpha)=\alpha^{T}(K K) \alpha$ (6)
where, $\alpha=\left(a_{1}, a_{2}, \ldots, a_{c}\right)^{T}$. Matrix K can be defined as: $K=\widetilde{K}-1_{c} \widetilde{K}-\widetilde{K} 1_{c}+1_{c} \widetilde{K} 1_{c}$, where, $1_{c}=(1 / c)_{c \times c}$, and $\widetilde{K}$ is a c×c kernel matrix. The elements in the matrix can be defined as:
$\tilde{K}_{i j}=\phi\left(x_{i}\right)^{T} \phi\left(x_{j}\right)=\left(\phi\left(x_{i}\right) \cdot \phi\left(x_{j}\right)\right)=k\left(x_{i}, x_{j}\right)$ (7)
where, k(x,y) is the kernel function corresponding to ϕ. Let α be an eigenvector satisfying λα=(KK)α. In the feature space F, the KPCA transform of a sample ϕ(x) can be described by:
$W \cdot \phi(x)=\sum_{i=1}^{c} \alpha_{i}\left(\phi\left(x_{i}\right) \cdot \phi(x)\right)=\sum_{i=1}^{c} \alpha_{i} k\left(x_{i}, x\right)$ (8)
3.2 RBF classifier
Artificial neural network (ANN) is an important classification tool in pattern recognition. According to network structure, neural networks can be roughly categorized into single-layer feedforward network (sensor), multi-layer feedforward network, and recursive network. Among them, multi-layer feedforward network is the most widely used structure in pattern recognition, because this structure supports a special nonlinear transform from the input space to the hidden space. The samples are more likely to be separated in the hidden space. The most influential multi-layer feedforward networks include backpropagation (BP) classifier and radial basis function (RBF) classifier. The latter was adopted for this research.
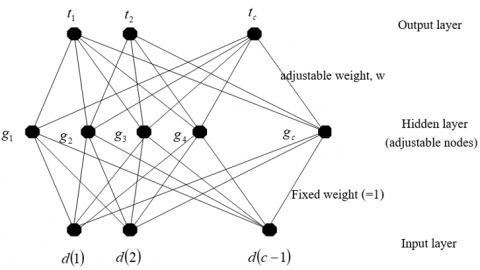
RBF classifier has been widely applied to approximate functions and recognize patterns. As shown in Figure 4, a typical RBF network consists of three layers: an input layer, a hidden layer, and an output layer. In the input layer, the number of nodes depends on the dimensionality of the eigenvector of the samples. In the hidden layer, the nodes correspond to the cluster heads of the training set; the positions and number of hidden layer nodes are adjustable. In the output layer, the number of nodes equals that of classes. For the output of all type i samples, the i-th node outputs 1, and the other nodes output 0. The weight between input and hidden layers is set to 1, while that between hidden and output layers is adjustable. Hence, the output of RBF network is the weighted sum of hidden layer outputs.
Figure 4. Structure of RFB network
RBF networks usually adopt Gaussian kernel function as the RBF: k(||x-xc||)=exp{-||x-xc||2/(2*σ)2)}, where xc is the center of the kernel function; σ is the width of the kernel function, which controls the scope of radial effect. The name Gaussian kernel function comes from the similarity to Gaussian distribution. This function can map the original features to infinite dimensions.
3.3 Algorithm flow
Step 1. Perform 2D Gabor wavelet transform on face and palmprint images.
Perform 2D Gabor wavelet transform on face image set Xface and palmprint image set Xpalm, respectively (Subsection 2.1), producing 32 images on 4 scales in 8 directions in each transform. Stitch the 32 Gabor images of face or palmprint together. Down-sample the stitched image to reduce computing load, resulting in image sets XGaborface and XGaborpalm in frequency domain.
Step 2. Carry out pixel-level fusion of face and palmprint images.
Apply the pixel-level fusion algorithm (Subsection 2.1) on the down-sampled face and palmprint image sets XGaborface and XGaborpalm in frequency domain, producing a fused and normalized image set Xnorm-fuse. Describe Xnorm-fuse in the form of eigenvector, and thus obtain a one-dimensional (1D) sample set X.
Step 3. Extract discriminative features.
Obtain the optimal projection W of X through KPCA. Perform projection on every training sample and test sample, producing a training set Ytrain and a test set Ytest. KPCA uses Gaussian kernel function k(x1,x2)=exp(-||x1-x2||2/2δ2), where δ2 is the variance of training set X.
Step 4. Classify the target images.
Import Ytrain and Ytest separately into RBF network. Set the number of nodes in the input layer, hidden layer, and output layer to c-1, c, and c, respectively. Take all c training samples as cluster heads, i.e., hidden layer nodes. Initialize the node values of the three layers in [-1, 1]. For the Gaussian kernel function of RBF network g(y1,y2)=exp(-||y1-y2||2/2δ2), set the value of δ2 to 12. Compute the weight matrix WRBF between hidden layer and output layer only, for the weight between input and hidden layers is 1. For Ytrain, WRBFG is the actual output (G is the hidden layer value). Let T be the expected output. Then, WRBF=G+T, where G+ is the pseudo-inverse of G. Finally, test the trained RBF network on sample set Ytest.
The complete recognition steps are shown in Figure 5.
Figure 5. Steps of recognition
4.1 Databases
Our experiments use three public image databases, namely, AR database, FERET database, and palmprint database provided by The Hong Kong Polytechnic University (HK-PolyU).
(1) FERET database
FERET database contains 2,200 grayscale images on 200 people, with 11 images per person. The original grayscale images are all of the size 384×256. The remove the background and upper body, all the images were cropped into 300×256. Then, 60×50 images were extracted from the cropped images. Figure 6 presents all the images of a person in FERET database.
Figure 6. All the images of a person in FERET database
(2) AR database
Figure 7. All the images of a person in AR database
AR database contains 3,094 images on 119 people, with 26 images per person. The original grayscale images are all of the size 768×576. For our experiments, the images were compressed to the size of 60×60. Figure 7 presents all the images of a person in AR database.
(3) Palmprint database
The palmprint database developed by HK-PolyU contains the palmprint images of 189 people. The subjects are mainly the students and teachers of the university. Each person provides 10 images on the palmprint of his/her left hand, and 10 on that of his/her right hand. Hence, the database has a total of 3,780=(189*20) palmprint images. The original size of the images is 387×284. For our experiments, the images were cropped to the size of 128×128, which only covers the center of the palm. To reduce the computing load, each image was further compressed to 60×60. Figure 8 presents all the images of a person in palmprint database.
Figure 8. All the images of a person in palmprint database
4.2 Experimental results of single sample discriminant analysis based on Gabor transform and the relevant analysis
This subsection intends to realize the pixel-level fusion and discriminant analysis face and palmprint images based on Gabor transform and KPCA-RBF classifier. During the experiments, two databases were combined: FERET+palmprint databases, and AR+palmprint databases.
Two classifiers were adopted for the experiments, including the proposed KPCA-RBF classifier (KPRC), and the traditional PCA-NN (principal component analysis-nearest neighor) classifier (PNC).
The following three methods were compared in the experiments:
(1) Single modal recognition methods
(a) FERET-PNC, AR-PNC, and Palm-PNC: these three methods apply PNC classifier to the images of the three databases, respectively.
(b) FERET-Gabor-KPRC, AR-Gabor-KPRC, and Palm-Gabor-KPRC: these three methods perform Gabor transform of the images in each database, and then apply KPRC classifier to the three transformed databases, respectively.
(2) Multimodal decision-level fusion methods
(a) FERETPalm-Decisionfusion-PNC and ARPalm-Decisionfusion-PNC: these two methods first classify single modal original images with PNC classifier, and then perform decision-level fusion on the two combined databases, respectively.
(b) FERETPalm-Decisionfusion-KPRC and ARPalm-Decisionfusion-KPRC: these two methods first methods perform Gabor transform of single modal original images, apply KPRC classifier on the two combined databases, respectively, and carry out decision-level fusion.
(3) Multimodal pixel-level fusion methods
(a) FERETPalm-Pixelfusion-PNC and ARPalm-Pixelfusion-PNC: these two methods directly perform pixel-level fusion on original images, and then classify the two combined databases with PNC classifier, respectively.
(b) FERETPalm-Pixelfusion-KPRC and ARPalm-Pixelfusion-KPRC: these two methods first methods perform Gabor transform of original images, carry out decision-level fusion, and then apply KPRC classifier on the two combined databases, respectively.
4.2.1 Results on FERET+palmprint databases
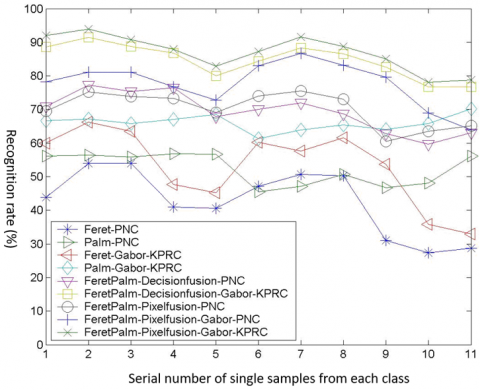
FERET database contains 200 classes of samples, with 11 samples in each class, while palmprint database provides 189 classes of samples, with 20 samples in each class. To fuse the two types of biological features, it is important to extract sample sets of the same size from the two databases. Here, the first 189 classes (with 11 samples in each class) are taken from FERET database, and all 189 classes (with 20 samples in each class) are selected from palmprint database. For single sample recognition problem, the size of training set and test set was set to 189 and 1,890, respectively. From each of the two sample sets, a sample was selected in turn, provided that the samples from the two sample sets have the same class label. Figure 9 compares the recognition results of all contrastive methods. Note that the number of samples increased gradually from 1 to 11. It can be seen that FERET-Gabor-KPRC and Palm-Gabor-KPRC were respectively better than FERET-PNC and Palm-PNC; multimodal fusion methods significantly outperformed single modal recognition methods; FERETPalm-Pixelfusion-Gabor-KPRC achieved better recognition results than any other fusion method almost under all scenarios.
Figure 9. Recognition effects on FERET+palmprint databases
Table 1 compares the mean recognition rates of the contrastive methods. As the two basic single modal recognition methods, FERE-PNC and Palm-PNC correctly recognized 42.60% and 52.36% of all samples, respectively. The use of Gabor transform and KPRC improved the mean recognition rate of single modal face and palmprint images to 53.14% and 65.99%, respectively. Multimodal fusion methods could further enhance the recognition effects. Among them, FERETPalm-Pixelfusion-Gabor-KPRC achieved the best results: the mean recognition rate was as high as 87.01%. This is 17.53% higher than that of traditional decision-level fusion method FERETPalm-Decisionfusion-PNC.
Table 1. Mean recognition rates on FERET+palmprint databases
|
Contrastive method |
Mean recognition rate (%) |
|||
|
Single modal methods |
PNC classifier without Gabor transform |
FERET-PNC |
42.60 |
|
|
Palm-PNC |
52.36 |
|||
|
Gabor transform before KPRC classifier |
FERET-Gabor-KPRC |
53.14 |
||
|
Palm-Gabor-KPRC |
65.99 |
|||
|
Multimodal fusion methods |
Decision-level fusion |
PNC classifier without Gabor transform |
FERETPalm-Decisionfusion-PNC |
69.48 |
|
Gabor transform before KPRC classifier |
FERETPalm-Decisionfusion-Gabor-KPRC |
84.63 |
||
|
Pixel-level fusion |
PNC classifier without Gabor transform |
FERETPalm-Pixelfusion-PNC |
70.24 |
|
|
Gabor transform before PNC classifier |
FERETPalm-Pixelfusion-Gabor-PNC |
77.77 |
||
|
Gabor transform before KPRC classifier |
FERETPalm-Pixelfusion-Gabor-KPRC |
87.01 |
||
4.2.2 Results on AR+palmprint databases
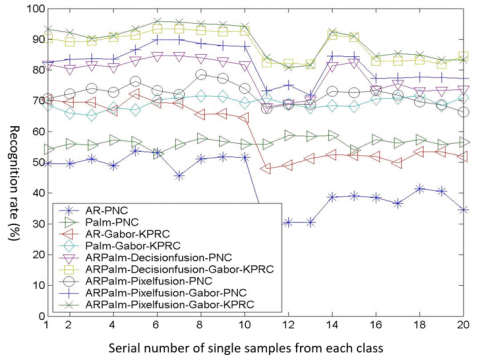
Figure 10. Recognition effects on AR+palmprint databases
AR database contains 119 classes of samples, with 26 samples in each class, while palmprint database provides 189 classes of samples, with 20 samples in each class. To fuse the two types of biological features, it is important to extract sample sets of the same size from the two databases. Here, all 119 classes (with 20 samples in each class) are taken from AR database, and the first 119 classes (with 20 samples in each class) are selected from palmprint database. For single sample recognition problem, the size of training set and test set was set to 119 and 2,261, respectively. From each of the two sample sets, a sample was selected in turn, provided that the samples from the two sample sets have the same class label. The remaining samples were treated as test samples. Figure 10 compares the recognition results of all contrastive methods. Note that the number of samples increased gradually from 1 to 20. It can be seen that AR-Gabor-KPRC and Palm-Gabor-KPRC were respectively better than AR-PNC and Palm-PNC; multimodal fusion methods significantly outperformed single modal recognition methods; ARPalm-Decisionfusion-Gabor-KPRC and ARPalm-Pixelfusion-Gabor-KPRC achieved better recognition results than other fusion methods almost under all scenarios.
Table 2 compares the mean recognition rates of the contrastive methods. As the two basic single modal recognition methods, AR-PNC and Palm-PNC correctly recognized 43.25% and 56.40% of all samples, respectively. The use of Gabor transform and KPRC improved the mean recognition rate of single modal face and palmprint images to 59.81% and 69.23%, respectively. Multimodal fusion methods could further enhance the recognition effects. Among them, ARPalm-Pixelfusion-Gabor-KPRC achieved the best results: the mean recognition rate was as high as 89.35%. This is 11.03% higher than that of traditional decision-level fusion method ARPalm-Decisionfusion-PNC.
Table 2. Mean recognition rates on AR+palmprint databases
|
Contrastive method |
Mean recognition rate (%) |
|||
|
Single modal methods |
PNC classifier without Gabor transform |
AR-PNC |
43.25 |
|
|
Palm-PNC |
56.40 |
|||
|
Gabor transform before KPRC classifier |
AR-Gabor-KPRC |
59.81 |
||
|
Palm-Gabor-KPRC |
69.23 |
|||
|
Multimodal fusion methods |
Decision-level fusion |
PNC classifier without Gabor transform |
ARPalm-Decisionfusion-PNC |
78.32 |
|
Gabor transform before KPRC classifier |
ARPalm-Decisionfusion-Gabor-KPRC |
87.96 |
||
|
Pixel-level fusion |
PNC classifier without Gabor transform |
ARPalm-Pixelfusion-PNC |
72.11 |
|
|
Gabor transform before PNC classifier |
ARPalm-Pixelfusion-Gabor-PNC |
81.99 |
||
|
Gabor transform before KPRC classifier |
ARPalm-Pixelfusion-Gabor-KPRC |
89.35 |
||
To sum up, Tables 1 and 2 confirm that Gabor transform and KPRC classifier could effectively promote fusion effects, whether it is pixel-level fusion or decision-level fusion.
To solve the small sample problem of biometric identification, this paper explores the limiting case of the problem, that is, the recognition of a single training sample, and proposes a single sample discriminant analysis method based on Gabor wavelet and KPCA-RBF (KPRC) classifier for pixel-level fusion of face and palmprint images. Experimental results show that multimodal recognition methods clearly outshine single-modal recognition methods, and the GABOR-KPRC with pixel-level fusion achieves better recognition effect than other fusion methods. It was also proved that Gabor transform and KPRC classifier can effectively improve the fusion effect, whether it is pixel-level fusion or decision-level fusion.
In the field of time-frequency transform, various high-dimensional resolution analyses are now hot topics among researchers. Contourlet transform, i.e., directional wavelet, is considered a real 2D image representation method. It offers a flexible, multi-scale, local, and directional analysis approach, which can capture the exact geometry of images. In future research, directional wavelet will be introduced to preprocess specific images (e.g., palmprint images) and decompose the directions, in order to extract more directional information. Then, the discriminant analysis will be coupled with the extracted data to improve the feature identification ability.
This article was supported by academic research funds of Zibo Vocational Institute (Grant No.: 2018zzzr01).
[1] Grigoryan, A.M. (2005). Fourier transform representation by frequency-time wavelets. IEEE Transactions on Signal Processing, 53(7): 2489-2497. https://doi.org/10.1109/TSP.2005.849180
[2] Chui, C.K. (1992). An Introduction to Wavelets. Academic Press Inc.
[3] Daubechies, I. (1992). Ten Lectures on Wavelets. Society for Industrial and Applied Mathematics.
[4] Grossmann, A., Morlet, J. (1984). Decomposition of Hardy functions into square integrable wavelets of constant shape. SIAM Journal on Mathematical Analysis, 15(4): 723-736. https://doi.org/10.1137/0515056
[5] Goupillaud, P., Grossmann, A., Morlet, J. (1984). Cycle-octave and related transforms in seismic signal analysis. Geoexploration, 23(1): 85-102. https://doi.org/10.1016/0016-7142(84)90025-5
[6] Kong, W.K., Zhang, D., Li, W. (2003). Palmprint feature extraction using 2-D Gabor filters. Pattern Recognition, 36(10): 2339-2347. https://doi.org/10.1016/S0031-3203(03)00121-3
[7] Liu, C., Wechsler, H. (2002). Gabor feature based classification using the enhanced fisher linear discriminant model for face recognition. IEEE Transactions on IMAGE Processing, 11(4): 467-476. https://doi.org/10.1109/TIP.2002.999679
[8] Liu, C. (2004). Gabor-based kernel PCA with fractional power polynomial models for face recognition. IEEE Transactions on Pattern Analysis and Machine Intelligence, 26(5): 572-581. https://doi.org/10.1109/TPAMI.2004.1273927
[9] Zhu, W.T., Liu, S.R. (2009). Face recognition with two dimensional Gabor wavelets and support vector machine. Journal of Hangzhou Dianzi University, 29(6): 53-56. http://dx.chinadoi.cn/10.3969/j.issn.1001-9146.2009.06.014
[10] Wu, J., Zhou, Z. H. (2002). Face recognition with one training image per person. Pattern Recognition Letters, 23(14): 1711-1719. https://doi.org/10.1016/S0167-8655(02)00134-4
[11] Martinez, A.M. (2002). Recognizing imprecisely localized, partially occluded, and expression variant faces from a single sample per class. IEEE Transactions on Pattern Analysis and Machine Intelligence, 24(6): 748-763. https://doi.org/10.1109/TPAMI.2002.1008382
[12] Huang, J., Yuen, P.C., Chen, W.S., Lai, J.H. (2003). Component-based LDA method for face recognition with one training sample. 2003 IEEE International SOI Conference. Proceedings (Cat. No. 03CH37443), Nice, France, pp. 120-126. https://doi.org/10.1109/AMFG.2003.1240833
[13] Wiskott, L., Krüger, N., Kuiger, N., Von Der Malsburg, C. (1997). Face recognition by elastic bunch graph matching. IEEE Transactions on Pattern Analysis and Machine Intelligence, 19(7): 775-779. https://doi.org/10.1109/34.598235
[14] Hong, L., Jain, A. (1998). Integrating faces and fingerprints for personal identification. IEEE Transactions on Pattern Analysis and Machine Intelligence, 20(12): 1295-1307. https://doi.org/10.1109/34.735803
[15] Jain, A.K., Ross, A. (2002). Learning user-specific parameters in a multibiometric system. In Proceedings. International Conference on Image Processing, Rochester, NY, USA. https://doi.org/10.1109/ICIP.2002.1037958
[16] Ross, A., Jain, A. (2003). Information fusion in biometrics. Pattern Recognition Letters, 24(13): 2115-2125. https://doi.org/10.1016/S0167-8655(03)00079-5
[17] Jing, X., Zhang, D. (2003). Face recognition based on linear classifiers combination. Neurocomputing, 50: 485-488. https://doi.org/10.1016/S0925-2312(02)00674-4