Zohair Al-Ameen
© 2021 IIETA. This article is published by IIETA and is licensed under the CC BY 4.0 license (http://creativecommons.org/licenses/by/4.0/).
OPEN ACCESS
Contrast is a distinctive image feature that tells if it has adequate visual quality or not. On many occasions, images are captured with low-contrast due to inevitable obstacles. Therefore, an improved type-II fuzzy set-based algorithm is developed to enhance the contrast of various color and grayscale images properly while preserving the brightness and providing natural colors. The proposed algorithm utilizes new upper and lower ranges, amended Hamacher t-conorm, and a transform-based gamma correction method to provide the enhanced images. The proposed algorithm is assessed with artificial and real contrast distorted images, compared with twelve specialized methods, and the outcomes are evaluated using four advanced metrics. From the obtained results of experiments and comparisons, the developed algorithm demonstrated the ability to process various color and grayscale images, performed the best among the comparative methods, and scored the best in all four quality evaluation metrics. The findings of this study are significant because the proposed algorithm has low-complexity and can adjust the contrast of different images expeditiously, which enables it to be used with different imaging modalities especially those with limited hardware resources or produce high-resolution images.
contrast enhancement, type-II fuzzy, color image, image enhancement, grayscale image, image processing
Digital images can provide extremely useful information for different real-life applications [1]. The quality of digital images is necessary for human and machine analysis and understanding [2]. Therefore, the demand for clear high-quality images has tremendously increased in the past years [3]. The acquired images do not flawlessly describe the captured scene and satisfy the user’s expectation due to the presentation of unwanted image degradations [4]. Degradations are deemed as unwanted effects that reduce the visible quality of digital images making them unlikely to be used for different applications. One of the most common degradations that affect digital images is the low-contrast effect [5], which can occur due to lack of user experience, faulty camera settings, hardware or software limitations, nature of the environment, and deficient lighting conditions [6]. The contrast is usually described as the variance between the darkest and the brightest values of the image [7]. It is considered an essential feature that describes the lucidity of details in an image [8].
In general, the low-contrast images own a narrow dynamic range, whereas the high-contrast images own a wide dynamic range [9]. This means that the high-contrast images are observed better than those of low-contrast [10]. Therefore, improving the contrast to better view the image pictorial features, reveal the latent details, and improve the representation of information is a primary requirement [11]. Image processing procedures related to image contrast enhancement are usually involved [12]. More specifically, this is done by applying a reliable contrast enhancement method, which plays a key role in improving the perceived quality without generating unwanted processing artifacts [13]. Contrast enhancement has been applied in various fields in recent years including photography, medical, biological, microscopy, aerial, satellite, computer vision, and so forth [1]. Accordingly, the users' desire to obtain lucid images with high visible details and the vendors’ intensive efforts to deliver the best of experience related to images has led to an active increase in research, development, and study of various image enhancement algorithms [14]. Likewise, many methods were developed in different directions in the past years, in that some selected methods are studied in Section 2.
A good contrast enhancement method should preserve the brightness from being amplified and produce adequate colors while improving the contrast. Besides, it should involve low computations with the lowest number of inputs to the method. All of that motivated the development of the proposed algorithm as it applies several equations, preserves the brightness, and provides natural colors when improving the contrast. Its working mechanism is straightforward. The image is first fuzzified using a simple method then the local statistics of the fuzzified image are computed. Next, new upper and lower ranges are determined and an amended Hamacher t-conorm is computed. Finally, a specialized gamma correction method is applied to produce the output. Testing the proposed algorithm is made possible with artificial and real grayscale and color contrast distorted images, whereas the artificial images are utilized for comparisons while the real images are utilized for experiments. The dataset used in this study contains more than one hundred grayscale and color images that were collected from different internet websites. The proposed algorithm was applied to various images related to photography, aerial, satellite, microscopy, medical, and biological imaging, in that it successfully processed those images.
As for the used image evaluation metrics, four well-known advanced full-reference metrics have been employed to measure the accuracy of the comparative methods. The used metrics are namely structural similarity (SSIM) [15], visual information fidelity (VIF) [16], gradient magnitude similarity deviation (GMSD) [17], and multiscale contrast similarity deviation (MCSD) [18]. Each metric measures the accuracy based on the detection of a distinctive feature, in that their readings would aid significantly in determining which method performed the best when comparing the proposed and the comparative methods. As for the comparative methods, twelve modern methods have been utilized, in that each method uses a different enhancement concept and own a distinct working mechanism.
The outcome of the comparison is appraised based on the metrics scores, visual appearance, and processing speed. Depending on the acquired results, the proposed algorithm showed a promising performance with artificial and real contrast-distorted grayscale and color images as it provided natural appearance, preserved brightness, adequate colors, and did not introduce any processing errors to the processed images. Likewise, it outperformed the comparatives in terms of metrics scores and visible quality. This achievement is significant because not all low-intricacy methods can reach this level of outcome accuracy. The rest of this article is coordinated subsequently: In Section 2, selected research works related to this study are reviewed concisely. In Section 3, exhaustive explications regarding the developed algorithm are given. In Section 4, all the results of the comparisons and experiments are demonstrated, and their associated exegeses and discussions are stated. In Section 5, an abridged conclusion is specified.
In the past years, many researchers have been trying to introduce methods that process the low-contrast effect properly. Tsai and Yeh [19] developed an automatic piecewise linear transformation (APLT) algorithm, in that it starts by transforming the image from the RGB domain to the HSV domain. Next, a content analysis approach is applied to evaluate the distribution of illumination. Based on this analysis, the image is processed by a piecewise linear method and the final output is obtained by transforming the image back to the RGB domain. Oppositely, Arici et al. [20] introduced a weighted approximated histogram equalization (WAHE) algorithm, in that it handles the issue of histogram spikes, applies intensity stretching, and construct the histogram adaptively according to the detected features in the image. In this method, the large histogram values are reduced for some regions to increase the focus on the foreground image objects, leading the output image to have better contrast.
Likewise, Celik and Tjahjadi [21] provided a contextual variational contrast enhancement (CVCE) algorithm, in that it works by utilizing a joint relationship approach between a pixel and its surrounding pixels to create a 2D histogram. Then, the sum of Frobenius norms differences obtained from the input and equally distributed histograms is minimized to construct a 2D smoothed target. The final output is produced by applying a diagonal mapping between the input and target histograms. Besides, Lee et al. [22] developed a layered difference representation (LDR) algorithm, in that it works by increasing the difference of gray levels for neighboring pixels. Next, a 2D histogram that utilizes a tree layered structure is obtained by counting the pairs of neighboring pixels and considering gray level differences. Then, an optimization process is implemented to derive a transformation process to each layer. Next, the transformation processes for all layers are combined to form an integrated process that is used as a mapping procedure between the input and the output to generate the resulting image.
Moreover, Huang et al. [23] introduced adaptive gamma correction by weighting distribution (AGCWD) algorithm, in that it starts by performing histogram analysis on the input image. Next, a weighted distribution process is applied followed by a gamma-correction procedure to generate the output image. As well, Hoseini and Shayesteh [24] proposed an ant colony optimization, genetic algorithm, simulated annealing (ACOGASA) based algorithm, in that enhancement is attained by applying a global transformation. The ant colony approach is utilized to create different transfer functions that help in mapping the intensities from input to output. The simulated annealing approach is used as a local search technique to tune the determined transfer functions. The genetic algorithm is responsible for the progressing of the ant’s features with the aid of an automatic fitness function that affects the output image’s naturalness and contrast. Besides, Chaira [25] created a type-II fuzzy set (T2FS) algorithm, which will be explained in detail later in Section 2 of the article.
Furthermore, Lin et al. [26] developed an averaging histogram equalization (AVHEQ) algorithm, in that it starts by applying a dynamic stretching technique on the input RGB image and then convert the output to the HSI domain. Next, the histogram of the I channel is averaged and equalized. After that, the output is further processed by histogram remapping and the output of this step is checked (i.e., detecting the brightness error) against a reference I channel that is determined by converting the original image to the HSI domain without any processing involvement. If the error is high, histogram averaging, equalization and remapping are applied again until the brightness error reaches a satisfactory level. When that happens, an HSI to RGB conversion occurs using the new I channel with the previously retained H and S channels to get the resulting image. Besides, Gu et al. [27] introduced a reference-based optimal histogram mapping (ROHIM) algorithm that starts by adjusting the histogram of the input image by a compound function. Next, the optimal parameters are determined to maximize the target function scores. The final output is created using an ideal transfer mapping approach that joints logistic functions with mean shifting.
Likewise, Gu et al. [28] proposed a blind optimized image enhancement (BOIE) algorithm, in that this algorithm is created by a cascade joint between AGCWD and another method named RICE. Thus, the input image is first processed by AGCWD and the output of this algorithm is then passed to RICE for further processing to get the output image. Both algorithms have parameters, wherein they are determined by using a specially designed no-reference image evaluation metric. Moreover, Parihar et al. [29] proposed a fuzzy-contextual contrast enhancement (FCCE) algorithm, in that it starts by assessing the fuzzy similarity of the input image. Next, the fuzzy contrast factor (FCF) and the fuzzy dissimilarity histogram (FDH) for the input image are determined. Then, using these factors, an FDH based transformation is applied for intensity enhancement. The output of this step is further processed by a contextual transformation approach to get the final output. Besides, Lu et al. [30] developed an effective guided image filtering (EGIF) algorithm, in that it incorporates the mean of local variance related to all image pixels to the guide filter’s cost function to well-preserve the edges in the base layer. Next, the details layer augmentation factor is computed based on the contents in an adaptive approach to suppress the image noise while improving fine details. None of the legacy methods are deemed as a definite solution for contrast enhancement. Therefore, this field remains open for research to provide better contrast enhancement methods.
A Type-II fuzzy set (T2FS) based algorithm [25] was introduced for contrast enhancement of grayscale medical images. This algorithm improves the contrast by utilizing a few simple distinct steps. Initially, the input image is fuzzified by the following equation:A Type-II fuzzy set (T2FS) based algorithm [25] was introduced for contrast enhancement of grayscale medical images. This algorithm improves the contrast by utilizing a few simple distinct steps. Initially, the input image is fuzzified by the following equation:
$f_{(x, y)}=\frac{g_{(x, y)}\quad-\min \left(g_{(x, y)}\right)}{\max \left(g_{(x, y)}\quad\right)-\min \left(g_{(x, y)}\right)}$ (1)
where, f(x,y) is a fuzzified image, x and y are image coordinates, g(x,y) is an input image, max and min are the highest and lowest image values in g(x,y). Then, the lower w(x,y) and upper u(x,y) ranges of the Hamacher t-conorm which is the Type-II fuzzy membership function are determined using the following equations:
$w_{(x, y)}=\left(f_{(x, y)}\right)^{1 / \alpha}$ (2)
$u_{(x, y)}=\left(f_{(x, y)}\right)^{\alpha}$ (3)
where, α is a parameter that controls the amount of contrast enhancement, in that it should satisfy 0 < α ≤ 1, where a greater value results in further amelioration. In the T2FS algorithm, parameter α is determined in a heuristic way to fulfill the requirement 0 < α ≤ 1 that was confirmed experimentally. Numerous experiments have proven that when α > 0.6, better contrast enhancement is obtained [25]. Next, the Hamacher t-conorm with the consideration of the lower and upper ranges is computed as in the subsequent equation to produce the enhanced image:
$h_{(x, y)}=\frac{u_{(x, y)} \quad+ w_{(x, y)} \quad+ (\lambda-2) \quad\cdot u_ {(x, y)} \quad\cdot w_{(x, y)}}{1- (1-\lambda) \cdot u_ {(x, y)} \quad\cdot w_ {(x, y)}}$ (4)
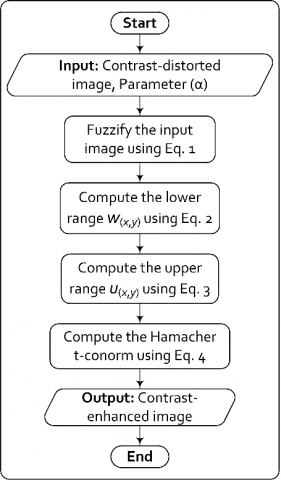
where, h(x,y) is the contrast-enhanced image, λ is the average image pixel values of f(x,y), and (·) is a multiplication process. This algorithm has a simple structure and involves a few calculations, which makes it desirable to be used with various real-life image processing applications. The framework of the pristine algorithm is demonstrated in Figure 1.
Figure 1. The framework of the pristine algorithm
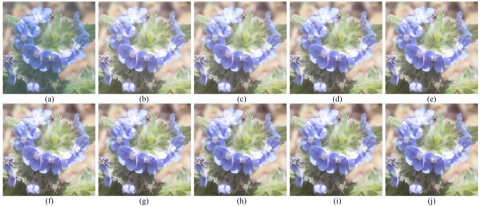
The true processing abilities of this algorithm are further investigated with different images and a sample of such investigations is given in Figure 2. The results of different tests revealed that this algorithm has several shortcomings. The first being it provides slight contrast enhancement when increasing the value of α. The second being it amplifies the brightness in the highly illuminated parts of the image leading to information loss in these parts of the image. The third being it increases the global image brightness which is deemed undesirable especially when the image already owns enough brightness. The fourth being it delivers somewhat light colors to the processed images.
Despite that, it has great potential to be further developed to provide better contrast and colors while preserving the local brightness and adjusting the global brightness. In this study, an improved type-II fuzzy set (IT2FS) algorithm, in that the input image g(x,y) is also initially fuzzified using Eq. (1). Then, the mean μ and standard deviation σ of the fuzzified image f(x,y) are computed to be used later with the subsequent steps of the algorithm using the following equations [31]:
$\mu=\frac{1}{n} \cdot \sum_{i=1}^{n} f_{i}$ (5)
$\sigma=\sqrt{\frac{1}{n-1} \cdot \sum_{i=1}^{n}\left(f_{i}-\mu\right)^{2}}$ (6)
where, fi is the vector counterpart of image f(x,y), n is the number of elements in fi. Then, new lower and upper ranges are computed for the Hamacher t-conorm. The new upper range ȗ(x,y) represents one form of a gamma correction transformation that is presented by Kallel et al. [32] and can be computed using the following equation:
$\hat{u}_{(x, y)}=\left(f_{(x, y)}\right)^{\alpha}+\left(1-\left(f_{(x, y)}\right)^{\alpha}\right) \cdot\left(\sigma^{2}\right)^{\alpha}$ (7)
where, α is the parameter responsible for contrast enhancement that has been explained earlier in this section.
Figure 2. Implementing the original Type-II fuzzy set-based algorithm with different α values. (a) natural contrast-degraded image; the remaining images are enhanced using: (b) α = 0.6; (c) α = 0.65; (d) α = 0.7; (e) α = 0.75; (f) α = 0.8; (g) α = 0.85; (h) α = 0.9; (i) α = 0.95; (j) α = 1
The variance σ2 helps to accelerate the enhancement process when changing the upper and lower ranges and aids in keeping the value of α in its default range. Thus, using the variance eventually delivered better-observed results. The new lower range ŵ(x,y) represents a modified version of a contrast stretching method described by Asokan et al. [33]. The original method can be expressed using the following equation:
$\hat{w}_{(x, y)}=\left(\frac{k \cdot \mu}{\sigma+b}\right) \cdot\left(f_{(x, y)}-c \cdot \mu\right)+\mu^{d}$ (8)
where, c and d are unknown parameters, b and k are contrast stretching parameters, in which they should be inputted manually by the user. To adapt this method to be suitable for the lower range, this method is modified heuristically to get the following method:
$\hat{w}_{(x, y)}=\left(\frac{\alpha \cdot \mu}{\sigma+\alpha}\right) \cdot\left(f_{(x, y)}-\alpha \cdot \mu\right)$ (9)
Hence, instead of inputting different parameters, the predefined α is used instead, which aided remarkably in supporting an adequate performance for this method. At this point, computing the Hamacher t-conorm with the consideration of the new lower and upper ranges becomes possible with a slight modification which is the utilization of the variance instead of the mean as in the original algorithm. The new Hamacher t-conorm can be computed using the following equation:
$t_{(x, y)}=\frac{\hat{u}_{(x, y)} \quad+ \widehat{w}_{(x, y)} \quad+ \left(\sigma^{2}-2\right) \cdot \hat{u}_{(x, y)} \quad\cdot \widehat{w}_{(x, y)}}{1- \left(1-\sigma^{2}\right) \cdot \hat{u}_{(x, y)} \quad\cdot \widehat{w}_{(x, y)}}$ (10)
At this point, the processed image t(x,y) requires gamma correction to become adequately clear. Hence, a transform-based gamma correction (TGC) method is used for this purpose and it can be determined as follows [34]:
$c_{(x, y)}=\max \left(t_{(x, y)}\right) \cdot\left(\frac{t_{(x, y)}}{\max \left(t_{(x, y)}\right)}\right)^{\gamma}$ (11)
where, c(x,y) is the algorithm’s final output, and (γ = 1.5·α).
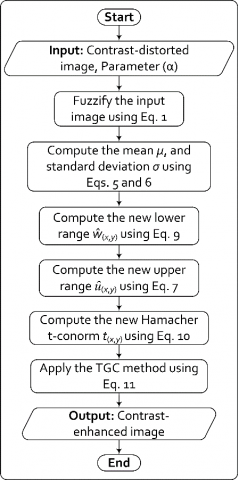
Figure 3. The framework of the proposed algorithm
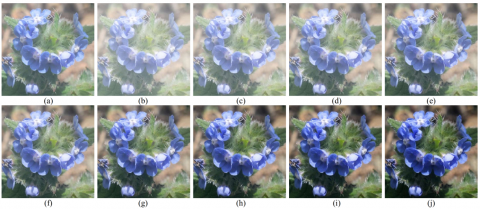
To easily understand the application specifics of the proposed algorithm, its framework is shown in Figure 3. Likewise, the proposed algorithm is tested with different α values and the obtained results are shown in Figure 4 to show the difference in performances between the original and proposed algorithms. As observed from the results in Figure 4, the contrast is being further adjusted when α is being increased resulting in better quality results with brightness preservation and better colors, unlike the original algorithm that resulted in unsatisfactory contrast, brightness amplification, and pale colors. Despite the key advantages of the proposed algorithm, its only shortcoming is an adequate α value must be selected manually to produce the desired outcome.
Figure 4. Implementing the proposed Type-II fuzzy set-based algorithm with different α values. (a) natural contrast-degraded image; the remaining images are enhanced using: (b) α = 0.6; (c) α = 0.65; (d) α = 0.7; (e) α = 0.75; (f) α = 0.8; (g) α = 0.85; (h) α = 0.9; (i) α = 0.95; (j) α = 1
The information related to the utilized dataset, the quality evaluation metrics, the comparison algorithms, and the computer specs are given in detail. Moreover, the experimental results obtained by applying the proposed algorithm to different types of images and their discussions with the comparison results and their explanations are given as well. As for the dataset, it consists of more than 200 images collected from different sources. The used images have different sizes, in that the smallest size is 384×384, and the largest size is 2395×2395. Samples of the used images are demonstrated in Figure 5 as an image gallery.
Figure 5. Image gallery that shows samples of images included in the dataset that is used with this study
For experiments, natural contrast-distorted images are used, whereas artificial contrast distorted images are used for comparisons. The reason being is to know the actual performance and processing abilities of the proposed IT2FS algorithm. The digital photography, aerial images, and comparison images were obtained from the different websites, while the satellite images were obtained from the Johnson space center at NASA and are accessible at https://eol.jsc.nasa.gov.
Besides, the scanning electron microscope (SEM) images were obtained from the Dartmouth College, faculty of the electron microscope, at the website http://www.dartmou th.edu/~emlab/gallery/. Likewise, the x-ray and magnetic resonance (MR) images are obtained from https://www. ctisus.com/, which is one of the leading radiological repositories on the internet. Besides, the fundus image was obtained by Creel [35], while the histology images were obtained from http://medcell.med.yale.edu/.
As for the used image evaluation metrics, four advanced full-reference metrics were utilized that are SSIM [15], VIF [16], GMSD [17], and MCSD [18]. The SSIM assesses images based on the change in their structural information. The structural information can be found in the illumination component of the image. The SSIM depends heavily on measuring the local luminance and contrast to produce the similarity amount. Thus, it is a good choice to evaluate the amount of contrast change between two given images.
The VIF assesses images by quantifying important information in the ideal image, then quantifying the loss of such information in the second image based on the human visual system model and natural scene statistics. The VIF showed promising abilities in detecting variations between two images in terms of information visibility. The GMSD assesses images by calculating the map of the local quality by using the maps of the gradient magnitudes of the ideal and distorted/recovered images.
The final score is determined using a strategy of pooling that considers the application of the standard deviation. Thus, this metric is sensitive to contrast change and can successfully detect the change of such an aspect. The MCSD assesses images by considering the representation of multi-scale related to contrast to associate the outcome to the perception of humans. In each scale, the contrast similarity deviation (CSD) is computed for both images, and then the CDS for three scales are pooled to get the final score.
This metric is specialized in detecting the contrast variation between two images and thus, it is used in this study. The four used metrics produce a value that is greater than zero, in that greater scores for SSIM and VIF indicate better quality results in terms of structure and observed details, whereas lower scores for GMSD and MCSD indicate better quality results in terms of perceived features and contrast.
As for the performed comparisons, the proposed IT2FS algorithm is compared with twelve enhancement algorithms that are, original T2FS [25], APLT [19], WAHE [20], CVCE [21], LDR [22], AGCWD [23], ACOGASA [24], AVHEQ [26], ROHIM [27], BOIE [28], FCCE [29], and EGIF [30], in that each algorithm uses a processing concept that differs from the others. The computer used to perform the experiments and comparisons uses an Intel 2.8 GHz Core I7-7700HQ CPU and 16 GB of RAM and the utilized platform is MATLAB 2018a.
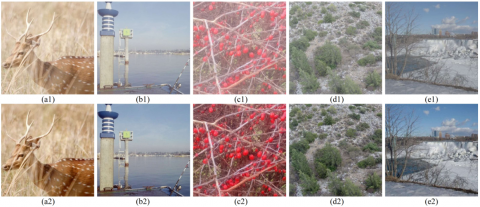
Figure 6. Applying the proposed IT2FS algorithm on different real contrast-distorted digital photography images. (a1-e1) original contrast-distorted images; (a2-e2) processed by the proposed algorithm with α equals to {0.9, 0.87, 0.91, 0.95, 0.78}, respectively
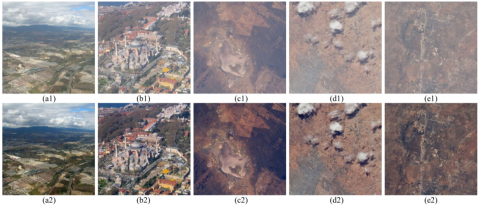
Figure 7. Applying the proposed IT2FS algorithm on different real contrast-distorted aerial and satellite images. (a1-e1) original contrast-distorted images; (a2-e2) processed by the proposed algorithm with α equals to {0.92, 0.86, 0.9, 0.81, 0.8}, respectively
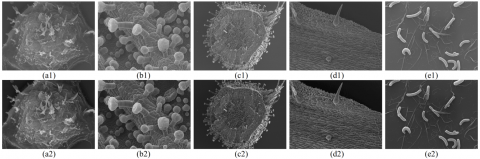
Figure 8. Applying the proposed IT2FS algorithm on different real contrast-distorted microscopy (SEM) images. (a1-e1) original contrast-distorted SEM images; (a2-e2) recovered by the developed algorithm by α equals to {0.75, 0.98, 1, 0.84, 1}, respectively
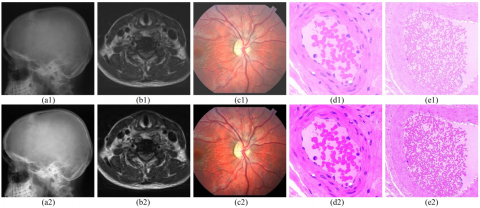
Figure 9. Applying the proposed IT2FS algorithm on different real contrast-distorted medical and biological images. (a1-e1) original contrast distorted x-ray, MR, fundus, and histology images. (a2-e2) processed by the proposed algorithm with α equals to {0.9, 0.85, 0.98, 1, 1}, respectively
Regarding the method of implementing the experiments and comparisons, it can be described as follows: first, different natural contrast-distorted images are processed by the proposed algorithm to show its real processing abilities with different images related to important real-world applications. Results of such action are demonstrated in the article as experimental results. Next, certain artificial contrast distorted images are processed by the proposed and the compared algorithms, whereas the resulting images are saved to be displayed in the article as the comparison results. Concurrently, the runtimes are also recorded to be used as a comparison asset. The images generated by the proposed and the comparison methods are collected and then sent to the utilized image evaluation methods to assess their quality and record it. Next, the recorded information is organized in a table and the average of each performance is obtained to be used when discussing the results of companions.
Figure 6 to Figure 9 demonstrate the results of applying the proposed algorithm to different digital photography, aerial, satellite, microscopy (SEM), medical, and biological images, that can be color or grayscale. As observed in Figure 6 to Figure 9, the IT2FS algorithm has achieved noteworthy success in improving the visual quality of different types of color and gray images. As for the grayscale images, it is definite that the resulting images have a higher visual quality and a significant difference from their unprocessed counterparts in terms of brightness and contrast, where the processed images can be well-perceived with better details.
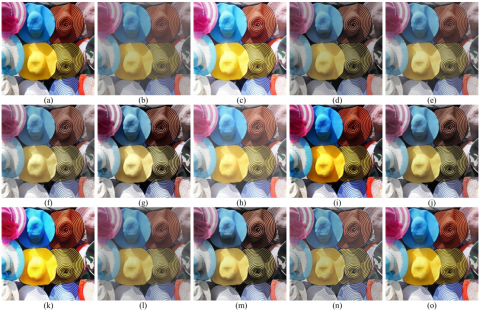
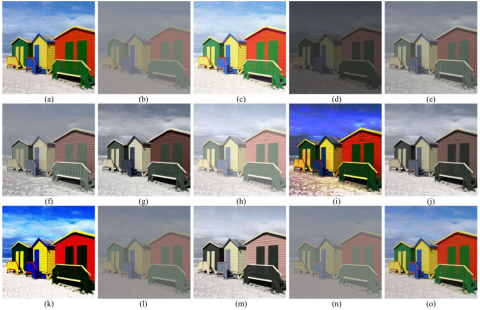
Figure 10. The comparison results between the proposed and the compared algorithms using an artificial contrast-distorted image: (a) Ideal image, (b) Contrast reduced image by 50%; The subsequent results represent image (b) processed by: (c) original T2FS, (d) APLT (e) WAHE, (f) CVCE, (g) LDR, (h) AGCWD, (i) ACOGASA, (j) AVHEQ, (k) ROHIM, (l) BOIE, (m) FCCE, (n) EGIF, (o) Proposed IT2FS
Figure 11. The comparison results between the proposed and the compared algorithms using an artificial contrast-distorted image: (a) Ideal image, (b) Contrast reduced image by 80%; The subsequent results represent image (b) processed by: (c) original T2FS, (d) APLT (e) WAHE, (f) CVCE, (g) LDR, (h) AGCWD, (i) ACOGASA, (j) AVHEQ, (k) ROHIM, (l) BOIE, (m) FCCE, (n) EGIF, (o) Proposed IT2FS
Table 1. Readings of the used evaluation metrics along with the recorded processing times for the achieved comparisons
|
Competitors |
Images |
SSIM |
VIF |
GMSD |
MCSD |
Times |
|
Degraded |
Fig. 10 |
0.7449 |
0.6602 |
0.0725 |
0.0681 |
N/A |
|
Fig. 11 |
0.6443 |
0.2781 |
0.2008 |
0.1889 |
N/A |
|
|
Avg. |
0.6946 |
0.46915 |
0.13665 |
0.1285 |
N/A |
|
|
Original T2FS |
Fig. 10 |
0.7700 |
0.7108 |
0.0493 |
0.0503 |
0.042484 |
|
Fig. 11 |
0.7714 |
0.6561 |
0.0480 |
0.0445 |
0.045608 |
|
|
Avg. |
0.7707 |
0.68345 |
0.04865 |
0.0474 |
0.044046 |
|
|
APLT |
Fig. 10 |
0.7582 |
0.5813 |
0.0645 |
0.0608 |
0.570465 |
|
Fig. 11 |
0.5494 |
0.2651 |
0.1882 |
0.1772 |
0.534802 |
|
|
Avg. |
0.6538 |
0.4232 |
0.12635 |
0.119 |
0.5526335 |
|
|
WAHE |
Fig. 10 |
0.7821 |
0.6494 |
0.0245 |
0.0248 |
0.136843 |
|
Fig. 11 |
0.7469 |
0.4752 |
0.0646 |
0.0598 |
0.218792 |
|
|
Avg. |
0.7645 |
0.5623 |
0.04455 |
0.0423 |
0.1778175 |
|
|
CVCE |
Fig. 10 |
0.7883 |
0.6401 |
0.0318 |
0.0320 |
0.388611 |
|
Fig. 11 |
0.6910 |
0.4312 |
0.1250 |
0.1176 |
0.635002 |
|
|
Avg. |
0.73965 |
0.53565 |
0.0784 |
0.0748 |
0.5118065 |
|
|
LDR |
Fig. 10 |
0.8366 |
0.7116 |
0.0122 |
0.0116 |
0.207672 |
|
Fig. 11 |
0.7956 |
0.6393 |
0.0304 |
0.0269 |
0.217920 |
|
|
Avg. |
0.8161 |
0.67545 |
0.0213 |
0.01925 |
0.212796 |
|
|
AGCWD |
Fig. 10 |
0.7201 |
0.6655 |
0.0381 |
0.0389 |
0.116686 |
|
Fig. 11 |
0.6872 |
0.5243 |
0.0727 |
0.0670 |
0.178465 |
|
|
Avg. |
0.70365 |
0.5949 |
0.0554 |
0.05295 |
0.1475755 |
|
|
ACOGASA |
Fig. 10 |
0.8526 |
0.7645 |
0.0239 |
0.0225 |
10.972285 |
|
Fig. 11 |
0.6458 |
0.5609 |
0.1758 |
0.1735 |
19.768283 |
|
|
Avg. |
0.7492 |
0.6627 |
0.09985 |
0.098 |
15.370284 |
|
|
AVHEQ |
Fig. 10 |
0.8363 |
0.6757 |
0.0120 |
0.0119 |
1.393198 |
|
Fig. 11 |
0.7899 |
0.6028 |
0.0409 |
0.0367 |
2.393687 |
|
|
Avg. |
0.8131 |
0.63925 |
0.02645 |
0.0243 |
1.8934425 |
|
|
ROHIM |
Fig. 10 |
0.8391 |
0.6970 |
0.0532 |
0.0533 |
8.118350 |
|
Fig. 11 |
0.5938 |
0.5720 |
0.1058 |
0.0946 |
20.309299 |
|
|
Avg. |
0.71645 |
0.6345 |
0.0795 |
0.0739 |
14.213824 |
|
|
BOIE |
Fig. 10 |
0.7423 |
0.6202 |
0.0443 |
0.0449 |
2.735248 |
|
Fig. 11 |
0.6419 |
0.3085 |
0.1631 |
0.1568 |
2.886621 |
|
|
Avg. |
0.6921 |
0.4643 |
0.1037 |
0.1008 |
2.8109345 |
|
|
FCCE |
Fig. 10 |
0.7984 |
0.6203 |
0.0628 |
0.0509 |
0.254507 |
|
Fig. 11 |
0.7322 |
0.5890 |
0.1030 |
0.0969 |
0.430130 |
|
|
Avg. |
0.7653 |
0.6046 |
0.0829 |
0.0739 |
0.3423185 |
|
|
EGIF |
Fig. 10 |
0.8090 |
0.6216 |
0.0301 |
0.0210 |
0.429744 |
|
Fig. 11 |
0.6747 |
0.3572 |
0.1208 |
0.1161 |
0.816677 |
|
|
Avg. |
0.7418 |
0.4894 |
0.0754 |
0.0685 |
0.6232105 |
|
|
Proposed IT2FS |
Fig. 10 |
0.8953 |
0.7890 |
0.0067 |
0.0064 |
0.244994 |
|
Fig. 11 |
0.8717 |
0.7191 |
0.0138 |
0.0127 |
0.479205 |
|
|
Avg. |
0.8835 |
0.7540 |
0.0102 |
0.0095 |
0.3620995 |
Figure 12. Illustration chart of the average SSIM and VIF readings of Table 1
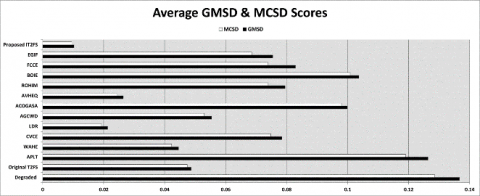
Figure 13. Illustration chart of the average MCSD and GMSD readings of Table 1
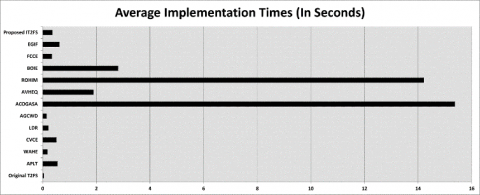
Figure 14. Average implementation times of the archived comparisons in Table 1
The brightness of vital details is well presented, and the contrast appears better leading the processed image to appear visually pleasant. Concerning color images, their details can be seen better after being processed, as the colors, brightness, and contrast have been well-improved, which made the overall quality of the results satisfactory to the viewer. Moreover, it improved the aforesaid traits while preserving all the essential details. It is like a layer of murkiness is taken out of the images, retaining the important features intact. This is an imperative achievement because the colors appeared better, the brightness is preserved, and there is a noticeable improvement in the contrast using an algorithm that does not include many inputs, calculations and is not complicated at the same time.
As for the comparison results represented in Figures 10 to 14 and Table 1, it can be observed that different results in terms of apparent quality were attained since various comparative algorithms with dissimilar filtering mechanisms were utilized. The original T2FS algorithm enhanced the contrast yet amplified the brightness in some areas and increased the overall brightness of the results, making the colors appear lighter. This affected its quality scores according to MCSD and GMSD, recoded very well according to VIF and above moderate according to SSIM. Still, it was the fastest among the comparative methods, which confirmed the hypothesis previously discussed that this method has a high potential of being developed.
The APLT performed the worst among the competitors as the output images have a dark appearance, light colors, and improper contrast. That is why it provided the worst scores according to the evaluation metrics with a slightly higher implementation time than the proposed algorithm. As for WAHE and CVCE, they both have a somewhat similar visual appearance, but in terms of evaluation metrics, it was in favor of WAHE. Although the CVCE seems visibly better, the metrics indicate otherwise because the CVCE changed the structural information and provided unorthodox contrast when compared to the ideal image. Also, both algorithms did not provide results with adequate quality and the CVCE was slower than WAHE.
Besides, LDR and AVHEQ have almost similar performances, slightly in favor of LDR as it produced results with slightly more realistic colors. Still, the results of both methods own deficient contrast, and therefore they scored moderately in terms of evaluation metrics. As for their implementation times, the LDR was way faster than AVHEQ. Moreover, ACOGASA and ROHIM have many things in common. Firstly, they were the slowest algorithms, as they both required extremely long implementation times. Secondly, they both produced results with dark colors, unrealistic brightness, and unusual contrast. Still, ROHIM performed somewhat better than ACOGASA.
The AGCWD was extremely fast in recovering results, yet its results suffered from faded colors and overall brightness amplification with unnatural contrast. Because of these artifacts, it scored below moderate with the evaluation metrics. The results of BOIE and EGIF appear almost the same visibly, the evaluation metrics indicate otherwise, in favor of EGIF. This occurs because the outcomes of EGIF have better local contrast and look relatively sharper than the outcomes of BOIE, as well as EGIF implements way faster than BOIE. In contrast, the FCCE produced results rapidly with relatively acceptable brightness and contrast. Still, the colors of the output images are unnatural when compare to the ideal image. That is why it scored below high with the evaluation metrics. As for the proposed IT2FS algorithm, its output images appear almost the same as the ideal images, even when the contrast ratio was reduced tremendously. The resulting images own rich colors, preserved brightness, natural contrast, and no visual processing errors were noticed in the processed images. That is why the proposed algorithm scored the best according to the four-evaluation metrics. As for the implementation time, it was the fifth-fastest algorithm among the competitors with an average time of 0.362 seconds, which remains convenient. This is pleasing as low-intricacy modifications were made that have significantly increased the processing power of the algorithm. As known, it is difficult to develop a low-intricacy algorithm that can produce high-quality results. This difficult task is achieved in this study as proved by the given results. It is anticipated that the IT2FS algorithm can be utilized with different image processing devices that demand low-computational costs.
An improved type-II fuzzy set algorithm is developed for contrast amelioration of color and grayscale images that are being artificial or natural contrast-distorted for different contemporary applications. It functions by determining new ranges, an amended Hamacher t-conorm, and a dedicated gamma correction method. The results of the proposed IT2FS have adequate colors, preserved brightness, and natural contrast with no visible errors. A dataset of color and grayscale real and artificial contrast-distorted images was utilized in testing the true processing abilities of IT2FS, whereas it successfully processed both types. Moreover, IT2FS was applied to different photography, aerial, satellite, microscopy, medical, and biological images, in that it also achieved the desired aim in processing such images. A comparison with twelve enhancement methods was made and the outcome was evaluated with four advanced evaluation metrics. Using the outcomes of all these tests, the IT2FS successfully outperformed the comparatives and scored the best in the four used evaluation metrics. As future works, the IT2FS is likely to be further modified to process images acquired from numerous imaging modalities and can be further optimized to become completely automatic.
I wish to thank the NASA Johnson space center (remote sensing unit) for permitting me to use their color images. Similarly, I wish to express my gratitude to the University of Mosul, Department of Computer Science, for giving much facilitation that led to the felicitous completion of this study.
[1] Ngo, H.H., Nguyen, C.H., Nguyen, V.Q. (2019). Multichannel image contrast enhancement based on linguistic rule-based intensificators. Applied Soft Computing, 76: 744-762. https://doi.org/10.1016/j.asoc.2018.12.034
[2] Bhandari, A.K. (2020). A logarithmic law based histogram modification scheme for naturalness image contrast enhancement. Journal of Ambient Intelligence and Humanized Computing, 11(4): 1605-1627. https://doi.org/10.1007/s12652-019-01258-6
[3] Cheng, X., Yuan, X., Hao, Q., Chang, K. (2017). Quality optimization and control technology for a full field-of-view imaging surface using a stationary phase method and an ambiguity function method. Optical Engineering, 56(3): 1-8. https://doi.org/10.1117/1.OE.56.3.034104
[4] Rahman, S., Rahman, M.M., Abdullah-Al-Wadud, M., Al-Quaderi, G.D., Shoyaib, M. (2016). An adaptive gamma correction for image enhancement. EURASIP Journal on Image and Video Processing, pp. 1-13. https://doi.org/10.1186/s13640-016-0138-1
[5] Wu, H.T., Wu, Y., Guan, Z., Cheung, Y.M. (2019). Lossless contrast enhancement of color images with reversible data hiding. Entropy, 21(9): 1-14. https://doi.org/10.3390/e21090910
[6] Kandhway, P., Bhandari, A.K. (2019). An optimal adaptive thresholding based sub-histogram equalization for brightness preserving image contrast enhancement. Multidimensional Systems and Signal Processing, 30(4): 1859-1894. https://doi.org/10.1007/s11045-019-00633-y
[7] Mahmood, A., Khan, S.A., Hussain, S., Almaghayreh, E.M. (2019). An adaptive image contrast enhancement technique for low-contrast images. IEEE Access, 7: 161584-161593. https://doi.org/10.1109/ACCESS.2019.2951468
[8] Mandal, S., Mitra, S., Shankar, B.U. (2020). FuzzyCIE: fuzzy colour image enhancement for low-exposure images. Soft Computing, 24(3): 2151-2167. https://doi.org/10.1007/s00500-019-04048-6
[9] Fu, Q., Jung, C., Xu, K. (2018). Retinex-based perceptual contrast enhancement in images using luminance adaptation. IEEE Access, 6: 61277-61286. https://doi.org/10.1109/ACCESS.2018.2870638
[10] Chen, J., Yu, W., Tian, J., Chen, L., Zhou, Z. (2018). Image contrast enhancement using an artificial bee colony algorithm. Swarm and Evolutionary Computation, 38: 287-294. https://doi.org/10.1016/j.swevo.2017.09.002
[11] Liu, C., Sui, X., Liu, Y., Kuang, X., Gu, G., Chen, Q. (2019). Adaptive contrast enhancement based on histogram modification framework. Journal of Modern Optics, 66(15): 1590-1601. https://doi.org/10.1080/09500340.2019.1649482
[12] Wang, W., Sun, N., Ng, M.K. (2019). A variational gamma correction model for image contrast enhancement. Inverse Problems & Imaging, 13(3): 461-478. http://dx.doi.org/10.3934/ipi.2019023
[13] Sun, X., Xu, Q., Zhu, L. (2019). An effective Gaussian fitting approach for image contrast enhancement. IEEE Access, 7: 31946-31958. https://doi.org/10.1109/ACCESS.2019.2900717
[14] Lee, S., Kim, C. (2019). Ramp distribution-based contrast enhancement techniques and over-contrast measure. IEEE Access, 7: 73004-73019. https://doi.org/10.1109/ACCESS.2019.2920015
[15] Wang, Z., Bovik, A.C., Sheikh, H.R., Simoncelli, E.P. (2004). Image quality assessment: from error visibility to structural similarity. IEEE Transactions on Image Processing, 13(4): 600-612. https://doi.org/10.1109/TIP.2003.819861
[16] Sheikh, H.R., Bovik, A.C. (2006). Image information and visual quality. IEEE Transactions on Image Processing, 15(2): 430-444. https://doi.org/10.1109/TIP.2005.859378
[17] Xue, W., Zhang, L., Mou, X., Bovik, A.C. (2013). Gradient magnitude similarity deviation: A highly efficient perceptual image quality index. IEEE Transactions on Image Processing, 23(2): 684-695. https://doi.org/10.1109/TIP.2013.2293423
[18] Wang, T., Zhang, L., Jia, H., Li, B., Shu, H. (2016). Multiscale contrast similarity deviation: An effective and efficient index for perceptual image quality assessment. Signal Processing: Image Communication, 45: 1-9. https://doi.org/10.1016/j.image.2016.04.005
[19] Tsai, C.M., Yeh, Z.M. (2008). Contrast enhancement by automatic and parameter-free piecewise linear transformation for color images. IEEE Transactions on Consumer Electronics, 54(2): 213-219. https://doi.org/10.1109/TCE.2008.4560077
[20] Arici, T., Dikbas, S., Altunbasak, Y. (2009). A histogram modification framework and its application for image contrast enhancement. IEEE Transactions on Image Processing, 18(9): 1921-1935. https://doi.org/10.1109/TIP.2009.2021548
[21] Celik, T., Tjahjadi, T. (2011). Contextual and variational contrast enhancement. IEEE Transactions on Image Processing, 20(12): 3431-3441. https://doi.org/10.1109/TIP.2011.2157513
[22] Lee, C., Lee, C., Kim, C.S. (2013). Contrast enhancement based on layered difference representation of 2D histograms. IEEE Transactions on Image Processing, 22(12): 5372-5384. https://doi.org/10.1109/TIP.2013.2284059
[23] Huang, S.C., Cheng, F.C., Chiu, Y.S. (2013). Efficient contrast enhancement using adaptive gamma correction with weighting distribution. IEEE Transactions on Image Processing, 22(3): 1032-1041. https://doi.org/10.1109/TIP.2012.2226047
[24] Hoseini, P., Shayesteh, M.G. (2013). Efficient contrast enhancement of images using hybrid ant colony optimisation, genetic algorithm, and simulated annealing. Digital Signal Processing, 23(3): 879-893. https://doi.org/10.1016/j.dsp.2012.12.011
[25] Chaira, T. (2014). An improved medical image enhancement scheme using Type II fuzzy set. Applied Soft Computing, 25: 293-308. https://doi.org/10.1016/j.asoc.2014.09.004
[26] Lin, S.C.F., Wong, C.Y., Rahman, M.A., Jiang, G., Liu, S., Kwok, N., Wu, T. (2015). Image enhancement using the averaging histogram equalization (AVHEQ) approach for contrast improvement and brightness preservation. Computers & Electrical Engineering, 46: 356-370. https://doi.org/10.1016/j.compeleceng.2015.06.001
[27] Gu, K., Zhai, G., Lin, W., Liu, M. (2015). The analysis of image contrast: From quality assessment to automatic enhancement. IEEE Transactions on Cybernetics, 46(1): 284-297. https://doi.org/10.1109/TCYB.2015.2401732
[28] Gu, K., Tao, D., Qiao, J.F., Lin, W. (2017). Learning a no-reference quality assessment model of enhanced images with big data. IEEE Transactions on Neural Networks and Learning Systems, 29(4): 1301-1313. https://doi.org/10.1109/TNNLS.2017.2649101
[29] Parihar, A.S., Verma, O.P., Khanna, C. (2017). Fuzzy-contextual contrast enhancement. IEEE Transactions on Image Processing, 26(4): 1810-1819. https://doi.org/10.1109/TIP.2017.2665975
[30] Lu, Z., Long, B., Li, K., Lu, F. (2018). Effective guided image filtering for contrast enhancement. IEEE Signal Processing Letters, 25(10): 1585-1589. https://doi.org/10.1109/LSP.2018.2867896
[31] Zou, Y., Dai, X., Li, W., Sun, Y. (2015). Robust design optimisation for inductive power transfer systems from topology collection based on an evolutionary multi-objective algorithm. IET Power Electronics, 8(9): 1767-1776. https://doi.org/10.1049/iet-pel.2014.0468
[32] Kallel, F., Sahnoun, M., Hamida, A.B., Chtourou, K. (2018). CT scan contrast enhancement using singular value decomposition and adaptive gamma correction. Signal, Image and Video Processing, 12(5): 905-913. https://doi.org/10.1007/s11760-017-1232-2
[33] Asokan, A., Popescu, D.E., Anitha, J., Hemanth, D.J. (2020). Bat algorithm based non-linear contrast stretching for satellite image enhancement. Geosciences, 10(2): 78: 1-12. https://doi.org/10.3390/geosciences10020078
[34] Huang, Z., Fang, H., Li, Q., Li, Z., Zhang, T., Sang, N., Li, Y. (2018). Optical remote sensing image enhancement with weak structure preservation via spatially adaptive gamma correction. Infrared Physics & Technology, 94: 38-47. https://doi.org/10.1016/j.infrared.2018.08.019
[35] Creel, D. (2012). Visually evoked potentials. In Webvision: The Organization of the Retina and Visual System [Internet]. University of Utah Health Sciences Center, pp. 1-30. https://www.ncbi.nlm.nih.gov/books/NBK107218/