Ziani Said* | Youssef El Hassouani
© 2020 IIETA. This article is published by IIETA and is licensed under the CC BY 4.0 license (http://creativecommons.org/licenses/by/4.0/).
OPEN ACCESS
This paper presents a new approach for extracting and characterizing the fetal electrocardiogram from a mixture of maternal and fetal electrocardiograms, which is of very low amplitude and therefore its medical characterization would be very difficult and unreliable. This method is based on time-scale analysis by using Continuous Wavelet Transform and the Scalogram. Previous work in this field has only investigated on time and time-frequency methods using the Short Fourier Transform, which does not give convincing and accurate results for biomedical signals that require high precision because any part of the extracted signal may indicate a dangerous pathology. The effectiveness of this approach lies in the fact that the time-scale analysis or scalogram of fetal-maternal electrocardiogram mixture has several energetic zones corresponding either to the electrical activity of the heart of the fetus or of her mother, which it facilitates considerably the use of these diagrams in order to separate maternal and fetal electrocardiograms. Compared to other more recent, the results found by simulations are very interesting and the extracted signal corresponds approximately to the source. As a consequence, we can characterize and extract all useful medical parameters. More importantly, our approach can be implemented on real time life by using embedded system such as Raspberry and Digital Signal Processor.
wavelet transform, source separation time–scale, electrocardiogram characterization
Today, more than 17 million people die from cardiovascular disease annually, according to the World Health Organization (WHO). In Morocco, cardiovascular diseases represent the first cause of death. A heart defect may occur and alertness should be increased and close monitoring of any newborn baby is necessary. Whether inherited or not, congenital heart disease varies, while remission depends on the speed of diagnosis. Each year in Morocco, an average of 6000 newborn babies suffer from a heart defect, or congenital heart disease. Prenatal pathology is often diagnosed at the onset of symptoms in infants, according to specialists, the early diagnosis, that is to say before birth or from the first weeks of pregnancy, is made quite late in Morocco. It is from there that our scientific contribution will present the effective solution which sets up a reliable tool capable of making an early detection of cardiac malformations: it is the electrocardiogram (ECG). The analysis of an ECG is mine information for the cardiologist that he operates according to his patient's state of health and his symptoms. The electrocardiogram Figure 1 is the recording of the electrical activity of the heart contraction via skin electrodes positioned at different points on the body.
Figure 1. ECG signal
The ECG allows immediate recognition of variations in heart rate, rhythm disturbances, conduction disorders and myocardial ischemia. Monitoring the fetal heart rate is an important factor in monitoring the progress of childbirth. Regular recording of the fetal heart rate shows how well the baby tolerates uterine contractions, which alter blood flow in the placenta and reduce oxygen supply. If the recording does not show any abnormality in the fetal heart rate, the baby is diagnosed in perfect condition. The fetal electrocardiogram FECG can be measured by placing electrodes on the mother’s abdomen. However, this signal has very low power and is mixed with several sources of noise and interference. Nevertheless, the main contamination is the maternal electrocardiogram MECG, since its amplitude is much higher than that of the fetus. As a result, the basic problem is to extract the FECG signal from the mixture of MECG and FECG signals, where the interfering MECG is a much stronger signal. The aim of this work is to extract and characterize the FECG signal, in order to diagnose the condition of the fetal heart by using the continuous wavelet transform (CWT) [1, 2] as a very powerful mathematical microscope [3]. An ECG electrode placed on the mother's abdomen records the electrical activity of two hearts and therefore this electrode picks up a mixture of two signals: FECG and MECG. Mathematically, the system is called determined because the number of mixtures taken by two sensors (electrodes) x1 and x2 is equal to the number of unknown sources s1 and s2. By construction of the problem, x1 and x2 are written as follows:
$\left(\begin{array}{l}x_{1} \\ x_{2}\end{array}\right)=\left[\begin{array}{ll}a_{11} & a_{12} \\ a_{21} & a_{22}\end{array}\right]\left(\begin{array}{l}s_{1} \\ s_{2}\end{array}\right)$ (1)
where, the coefficients aij are real, constant and different from zero and:
s1=Fetal ECG (FECG)
s2=Maternal ECG
x1=mixture 1 of s1 and s2
x2=mixture 1 of s1 and s2
We denote:
$S=\left(\begin{array}{l}s_{1} \\ s_{2}\end{array}\right), \quad X=\left(\begin{array}{l}x_{1} \\ x_{2}\end{array}\right)$
And:
$A=\left[\begin{array}{ll}a_{11} & a_{12} \\ a_{21} & a_{22}\end{array}\right]$ (2)
Thus:
$X=A S$ (3)
And:
$\left\{\begin{array}{l}x_{1}=a_{11} s_{1}+a_{12} s_{2} \\ x_{2}=a_{21} s_{1}+a_{22} s_{2}\end{array}\right.$ (4)
Here, we only consider linear instantaneous mixtures, so the operator A corresponds to a scalar matrix different from zero. The problem, is how we can determine s1 and s2 from x1 and x2 without having the scalar matrix A. Recently a very interesting approach was proposed by Ziani et al, since his first paper [2] which is based on statistical methods, the second paper [3] deals with the fetal electrocardiogram extraction based on the wavelet. The third article [4] is based on Non-negative Matrix Factorization NMF. Other articles focused on the characterization of the QRS complex using Time Analysis. However, it is restricted to the very special case when each source occurs alone in large enough time intervals. Due to this limitation, poor performance is often obtained when dealing with real sources, like biomedical signals, which do not match always this requirement. To overcome this restriction, we proposed our approach based on Time-Scale domain analysis, which is efficient and provides a very high performance. This paper is organized as follows: In Section 2, we started by the presentation of the experimental methods. Then, we report the most important findings, including results of statistical analyses as appropriate and comparisons to other research results [5-10] in Section 3. As for section 4, it deals with the comparison with to the Time-Frequency Analysis and drew various conclusions from this investigation.
2.1 Theoretical background
2.1.1 Wavelet
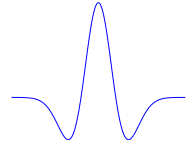
A wavelet Figure 2 is a function φ(t) which satisfies certain mathematical criteria [11-13].
Figure 2. Morlet wavelet
-Wavelet must have finite energy:
$€=\int_{-\infty}^{+\infty}|\psi(\mathrm{t})|^{2}$ (5)
- Admissibility constant:
$\mathcal{Q}=\int_{0}^{+\infty} \frac{|\widehat{\psi(\mathrm{f})}|^{2}}{\mathrm{f}} \mathrm{df}$ (6)
-The Fourier transform of ψ (t)
$\widehat{\Psi(\mathrm{f})}=\int_{-\infty}^{+\infty} \psi(t) e^{-i 2 \pi f t} d t$ (7)
2.1.2 Continuous wavelet transform CWT
The continuous wavelet transform (CWT) is a very effective time-scale method for characterizing complex signals. A common application of the (CWT) is in the detection of edges and singularities of signals using multi-resolution analysis. The (CWT) of a signal x(t) with an analyzing wavelet ψ(t) can be defined as:
$T(a, b)=\frac{1}{\sqrt{a}} \int_{-\infty}^{+\infty} x(t) \psi^{*}\left(\frac{t-b}{a}\right) d t$ (8)
where, $\mathrm{a}, \mathrm{b} \in \mathbb{R}$ and $\mathrm{a} \neq 0, \psi^{*}$ is a complex conjugate parameter, respectively [14, 15]. The normalized wavelet is often written more compactly as
$\psi_{\mathrm{a}, \mathrm{b}}=\frac{1}{\sqrt{\mathrm{a}}} \psi\left(\frac{\mathrm{t}-\mathrm{b}}{\mathrm{a}}\right)$ (9)
At a specific scale a and location b the relative contribution of the signal energy is given by the two-dimensional wavelet energy density function:
$E(a, b)=|T(a, b)|^{2}$ (10)
A plot of E(a,b) is known as a scalogram or Times- Scales Image (TSI).
2.2 Algorithm
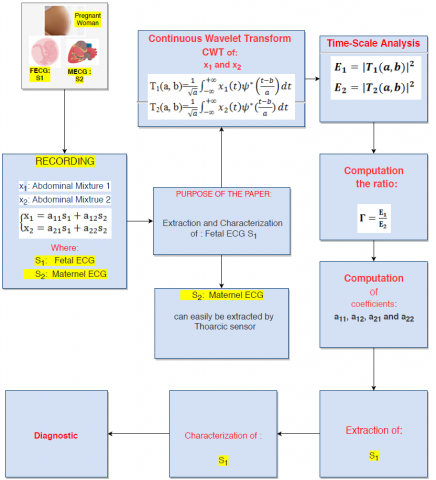
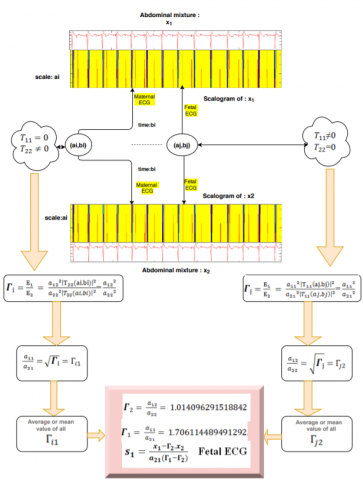
The approach presented in this article is detailed in the algorithm below dissolved in Figure 3.
Figure 3. Algorithm
2.3 Description of algorithm
We consider the following linear instantaneous mixture (Eq. (1)) of two real valued sources. So, the CWT of x1 and x2 can be written as:
$\mathbf{T}_{1}(\mathbf{a}, \mathbf{b})=\frac{1}{\sqrt{\mathrm{a}}} \int_{-\infty}^{+\infty} \mathrm{x}_{1}(\mathrm{t}) \psi^{*}\left(\frac{\mathrm{t}-\mathrm{b}}{\mathrm{a}}\right) \mathrm{dt}$
$=\mathrm{a}_{11}\left[\frac{1}{\sqrt{\mathrm{a}}} \int_{-\infty}^{+\infty} \mathrm{s}_{1}(\mathrm{t}) \psi^{*}\left(\frac{\mathrm{t}-\mathrm{b}}{\mathrm{a}}\right) \mathrm{dt}\right]+$
$\mathrm{a}_{12}\left[\frac{1}{\sqrt{\mathrm{a}}} \int_{-\infty}^{+\infty} \mathrm{s}_{2}(\mathrm{t}) \psi^{*}\left(\frac{\mathrm{t}-\mathrm{b}}{\mathrm{a}}\right) \mathrm{dt}\right]$
$\mathbf{T}_{2}(\mathbf{a}, \mathbf{b})=\frac{1}{\sqrt{\mathrm{a}}} \int_{-\infty}^{+\infty} \mathrm{x}_{2}(\mathrm{t}) \psi^{*}\left(\frac{\mathrm{t}-\mathrm{b}}{\mathrm{a}}\right) \mathrm{dt}=$
$\mathrm{a}_{21}\left[\frac{1}{\sqrt{\mathrm{a}}} \int_{-\infty}^{+\infty} \mathrm{s}_{1}(\mathrm{t}) \psi^{*}\left(\frac{\mathrm{t}-\mathrm{b}}{\mathrm{a}}\right) \mathrm{dt}\right]+$
$\mathrm{a}_{22}\left[\frac{1}{\sqrt{\mathrm{a}}} \int_{-\infty}^{+\infty} \mathrm{s}_{2}(\mathrm{t}) \psi^{*}\left(\frac{\mathrm{t}-\mathrm{b}}{\mathrm{a}}\right) \mathrm{dt}\right]$
Thus:
$\left\{\begin{array}{l}\mathrm{T}_{1}(\mathrm{a}, \mathrm{b})=\mathrm{a}_{11} \mathrm{T}_{11}+\mathrm{a}_{12} \mathrm{T}_{22} \\ \mathrm{T}_{2}(\mathrm{a}, \mathrm{b})=\mathrm{a}_{21} \mathrm{T}_{11}+\mathrm{a}_{22} \mathrm{T}_{22}\end{array}\right.$ (11)
where:
$\mathrm{T}_{11}=\frac{1}{\sqrt{\mathrm{a}}} \int_{-\infty}^{+\infty} \mathrm{s}_{1}(\mathrm{t}) \psi^{*}\left(\frac{\mathrm{t}-\mathrm{b}}{\mathrm{a}}\right) \mathrm{dt}$ is the $\mathrm{CWT}$ of $\mathrm{s}_{1}$
And
$\mathrm{T}_{22}=\frac{1}{\sqrt{\mathrm{a}}} \int_{-\infty}^{+\infty} \mathrm{s}_{2}(\mathrm{t}) \psi^{*}\left(\frac{\mathrm{t}-\mathrm{b}}{\mathrm{a}}\right) \mathrm{dt}$ is the $\mathrm{CWT}$ of $\mathrm{s}_{2}$
At a specific scale a and location b the relative contribution of the signal energy is given by the two-dimensional wavelet energy density function:
$\left\{\begin{array}{l}\mathbf{E}_{1}=\left|\mathbf{T}_{1}(\mathbf{a}, \mathbf{b})\right|^{2} \approx \mathbf{a}_{11}^{2}\left|\mathbf{T}_{11}(\mathbf{a}, \mathbf{b})\right|^{2}+\mathbf{a}_{12}^{2}\left|\mathbf{T}_{22}(\mathbf{a}, \mathbf{b})\right|^{2} \\ \mathbf{E}_{2}=\left|\mathbf{T}_{2}(\mathbf{a}, \mathbf{b})\right|^{2} \approx \mathbf{a}_{21}^{2}\left|\mathbf{T}_{11}(\mathbf{a}, \mathbf{b})\right|^{2}+\mathbf{a}_{22}^{2}\left|\mathbf{T}_{22}(\mathbf{a}, \mathbf{b})\right|^{2}\end{array}\right.$ (12)
So the ratio Γ can be written as:
$\Gamma=\frac{E_{1}}{E_{2}}=\frac{a_{11}^{2}\left|T_{11}(a, b)\right|^{2}+a_{12}^{2}\left|T_{22}(a, b)\right|^{2}}{a_{21}^{2}\left|T_{11}(a, b)\right|^{2}+a_{22}^{2}\left|T_{22}(a, b)\right|^{2}}$ (13)
Therefore, our goal is to determine the coefficients a11, a12, a21 and a22 in order to solving Eq. (1). Also, the heart rate of the fetus is very high compared to that of her mother. Then, there are at least two pairs (ai, bi) and (aj, bj) in the time-scale space such as the continuous wavelet transform of s1 or s2 is equal to zero i.e.
$\mathrm{T}_{11}=0$ and $\mathrm{T}_{12} \neq 0$ or $\mathrm{T}_{11} \neq 0$ and $\mathrm{T}_{12}=0$
This implies that:
if $\mathrm{T}_{11}=0$ and $\mathrm{T}_{22} \neq 0$
So:
$\Gamma=\frac{E_{1}}{E_{2}}=\frac{a_{11}^{2}\left|T_{11}(a, b)\right|^{2}}{a_{21}^{2}\left|T_{11}(a, b)\right|^{2}}=\frac{a_{11}^{2}}{a_{21}^{2}}$
$\frac{a_{11}}{a_{21}}=\sqrt{\Gamma}=\Gamma_{1}$ (14)
if T11≠0 and T22=0
So:
$\Gamma=\frac{E_{1}}{E_{2}}=\frac{a_{12}^{2}\left|T_{22}(a, b)\right|^{2}}{a_{22}^{2}\left|T_{22}(a, b)\right|^{2}}=\frac{a_{12}^{2}}{a_{22}^{2}}$
$\frac{a_{12}}{a_{22}}=\sqrt{\Gamma}=\Gamma_{2}$ (15)
So by replacing Eq. (14) and Eq. (15) in Eq. (1) we get:
$\left\{\begin{array}{l}x_{1}=a_{11} s_{1}+a_{12} s_{2} \\ x_{2}=a_{21} s_{1}+a_{22} s_{2}\end{array}\right.$
$\left\{\begin{array}{l}\mathrm{x}_{1}=\Gamma_{1} \cdot \mathrm{a}_{21} \mathrm{s}_{1}+\Gamma_{2} \cdot \mathrm{a}_{22} \mathrm{s}_{2} &(a)\\ \mathrm{x}_{2}=\mathrm{a}_{21} \mathrm{s}_{1}+\mathrm{a}_{22} \mathrm{s}_{2}&(b)\end{array}\right.$
$s_{1}=\frac{x_{1}-\Gamma_{2} \cdot x_{2}}{a_{21}\left(\Gamma_{1}-\Gamma_{2}\right)}$ (16)
$-\Gamma_{2} \cdot(b)$ implies: s1 presents the Fetal ECG: FECG
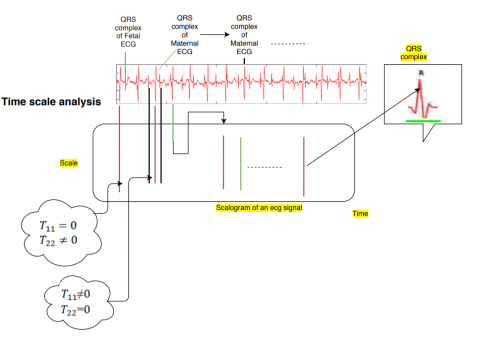
It is interesting to note that the calculation of Γ1 and Γ2 allows us to determine the desired signal. What is particularly striking in this work is the extreme ease for determining the ratios Γ1 and Γ2. The continuous wavelet transforms (CWT) as a matter of fact is a mathematical microscope which allows the detection of the frequency content of a signal and especially the detection of all the irregularities contained in an electrocardiogram. As we know, the most important wave in an electrocardiogram is the QRS complex which provides all medical parameters of the electrical activity of the heart. The highlight point of this approach is based on the fact that the signal recorded by the electrode placed on the mother's abdomen contains both, the QRS complexes corresponding to the fetus and to its mother, although the amplitude of the fetal electrocardiogram is much lower, the fetus' heart rate is higher than that of its mother, so the QRS complexes will be located clearly in the time-scale domain or scalogram and therefore we can easily locate all points (ai , bi) where one of the sources occurs alone i.e. (T11=0 and T22≠0) and (T11≠0 and T22=0) as shown in Figure 4 and Figure 5. Therefore, it is enough to determine the ratio Eq. (13) at each point (ai, bi) and by determining the period of repetition of these points we will make the average of all the founded values Eq. (14), Eq. (15).
Figure 4. Process of locating points (ai, bi)
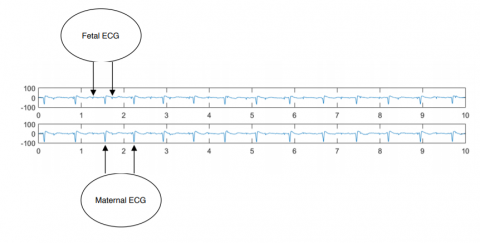
Figure 5. Data mixtures x1 and x2
In this section, it is explained the results of our research and at the same time is given the comprehensive discussion. Results can be presented in Figures 5-8. The data is extracted from the DaISy database [15] (Database for the Identification of Systems). The sampling frequency is 250 Hz. We used Matlab and Python on Windows 7. The mixed signal x1 and x2 are parameterized with T=2500 s as in Figure 5.
Figure 6. Ratios Γ1 and Γ2
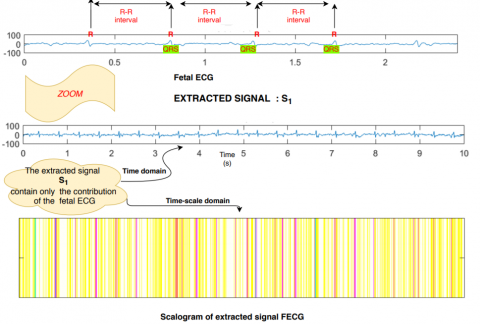
Figure 7. Extracted signal FECG
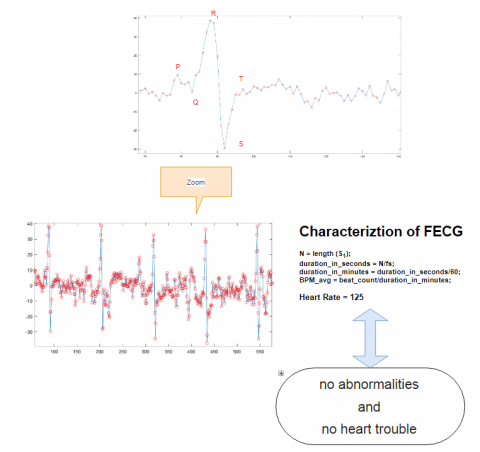
Figure 8. Characterization Extracted signal FECG
3.1 Results
As mentioned in section 2, we applied the algorithm Figure 3 step by step. First, we applied the wavelet transforms to the input signals x1 and x2, and then we developed the corresponding scalogram. Second, we determined the points (ai, bi) mentioned in the previous section, then we calculated the ratios Γ1 and Γ2. The results of the first simulation are given in Figure 6. Accordingly, the desired signal presenting the electrical activity of the fetal heart could be determined. The second simulation Figure 7 shows the time evolution of the extracted signal as well as its scalogram. Furthermore, the third simulation Figure 8, presents a characterization of the extracted signal S1 in order to extract medical parameter such as the heart rate and the visualization of all characteristic waves, namely T, QRS and U.
3.2 Discussion
The extraction of fetal ECG is often challenging, because prenatal screening of congenital heart disease is important for investigation of affected fetuses for comorbidities, prognostication, preparation for postnatal management, and parental choice about continuation of pregnancy. In this research we discovered a new method for extracting the fetal electrocardiogram from an abdominal signal which contains a mixture of the electrical activity of the fetal’s heart and her mother as shown in Figure 9. At first sight the fetal signal seems to be just an artefact of maternal signal owing to its very low amplitude that is why the extracted ECG (s1) highlights the scientific contribution of our approach because it contains all the important waves (P, QRS, T and U) Figure 8 for making a successful clinical diagnosis. As shown in Figure 8, the electrical activity of the fetal heart is normal and there is no more abnormality. Besides, we can make a regular monitoring by implementing the present approach on real time life by using embedded system such as Raspberry or digital signal processor DSP since the execution time of the algorithm is really optimal. The added value of this article is that it presents a clear approach with a minimum execution time and which has led to surprising and high quality results. A Comparison of other methods such as statistical methods [14, 15], time-frequency methods [16, 17] and ica-svd methods [2-4, 18], our approach is accurate, reliable and can be generalized to all biomedical signals and audio signals. Moreover, it can be applied to speech recognition and classifications.
Figure 9. Abdominal electrocardiogram
The question which then arises is how to extract the fetal ECG from a mixture a fetal and maternal ECG. The proposed algorithm this paper is based on the continuous wavelet transform as an advanced and very rich mathematical tool which makes it possible to locate in time and in precise chronological order the frequencies contained in a stationary or no stationary signal and it is this property which allowed us to separate the foetal and maternal contributions in the time-scale domain. As a result, we were able to extract the fetal electrocardiogram. The simulation of the algorithm was done on Python and Matlab and it is applied to a real signal from the DAISY database, the results found are in perfect agreement with the results of the database. I really want to emphasize the simplicity of the algorithm and its notable reliability which allowed us to make a deep characterization leading to a successful early detection. What is more important here is the possibility of implementation of the algorithm in real time through the use of embedded processor and this allows regular monitoring of pregnant women to reassure themselves about the cardiac state of their foetuses. Currently, pediatric cardiologist uses ultrasound, which unfortunately remains a limited and non-rich tool and which can’t completely show the foetal morphology malformations a statement that what is expected, as stated in the introduction Prenatal screening for structural congenital heart disease allows the preparation of postnatal intervention in most instances; in a minority of cases (mainly critical left-heart lesions), fetal cardiac intervention can be considered. Finally, we can’t deny that this paper presents an important tool for detecting cardiac malformations for fetuses. Future works will be the concretization of this approach by an important industrial product.
The authors would like to thank the anonymous reviewers for their insightful comments and recommendations
Abbreviations
|
CWT |
Continous Wavelet Transform |
|
TSI |
Time scale image |
|
BPM ECG FECG |
Beat by minute Electrocardiogram Fetal electrocardiogram |
[1] Renuka Devi, B. (2018). Texture feature-based image searching system using wavelet transform approach. Traitement du Signal, 35(1): 263-269. https://doi.org/10.3166/TS.35.23-33
[2] Ziani, S., Jbari, A., Bellarbi, L., Farhaoui, Y. (2018). Blind maternal-fetal ECG separation based on the time-scale image TSI and SVD – ICA methods. Procedia Computer Science, 134: 322-327. https://doi.org/10.1016/j.procs.2018.07.179
[3] Ziani, S., El Hassouani, Y., Farhaoui, Y. (2019). An NMF based method for detecting RR interval. In: Farhaoui, Y., Moussaid, L. (eds) Big Data and Smart Digital Environment. ICBDSDE 2018. Studies in Big Data, 53: 342-346. https://doi.org/10.1007/978-3-030-12048-1_35
[4] Ziani, S., El Hassouani, Y. (2019). Fetal-maternal electrocardiograms mixtures characterization based on time analysis. 2019 5th International Conference on Optimization and Applications (ICOA), Kenitra, Morocco, pp. 1-5. https://doi.org/10.1109/ICOA.2019.8727619
[5] Chan, A.D.C., Hamdy, M.M., Badre, A., Badee, V. (2008). Wavelet distance measure for person identification using electrocardiograms. IEEE Transactions on Instrumentation and Measurements, 57(2): 248-253. https://doi.org/10.1109/TIM.2007.909996
[6] Lourenço, A., Silva, H., Fred, A. (2011). Unveiling the biometric potential of finger-based ECG signals. Computational Intelligence and Neuroscience, 1: 1-8. https://doi.org/10.1155/2011/720971
[7] Hyvarinen, A. (2001). Blindsource separation by nonstationarity of variance: A cumulant-based approach. IEEE Transactions on Neural Networks, 12(6): 1471-1474. https://doi.org/10.1109/72.963782
[8] Parra, L., Spence, C. (2000). Convolutive blindseparation of nonstationary sources. IEEE Transactions on Speech and Audio Processing, 8(3): 320-327. https://doi.org/10.1109/89.841214
[9] Pham, D.T., Cardoso, J.F. (2000). Blind separation of instantaneous mixtures of non-stationary sources. IEEE Transactions on Signal Processing, 48(2): 363-375. https://doi.org/10.1109/78.823964
[10] Abrard, F., Deville, Y. (2005). A time-frequency blind signal separation method applicable to underdetermined mixtures of dependent sources. Signal Processing, 85: 1389-1403. https://doi.org/10.1016/j.sigpro.2005.02.010
[11] Daubechies, I. (1992). Ten Lectures on Wavelets. Society for Industrial and Applied Mathematics. https://doi.org/10.1137/1.9781611970104
[12] Mallat, S. (1998). Wavelet Tour of Signal Processing (second edition). Academic Press, San Diego. https://doi.org/10.1016/B978-012466606-1/50008-8
[13] De Moor, B., De Gersem, P., De Schutter, B. Favoreel, W. (1997). DAISY: A database for fication of systems. Computer Aided Control Systems Design. 38(3): 4-5.
[14] Hurst, J.W. (1998). Naming of the waves in the ECG, with a brief account of their genesis. Circulation, 98(18): 1937-1942. https://doi.org/10.1161/01.CIR.98.18.1937
[15] Kanjilal, P.P., Saba, G. (1997). Fetal ECG extraction from single-channel maternal ECG using singular value decomposition. IEEE Transactions on Biomedical Engineering, 44(1): 51-59. https://doi.org/10.1109/10.553712
[16] Lee, J., Kwak, K. (2019). Personal identification using a robust eigen ECG network based on time-frequency representations of ECG signals. IEEE Access, 7: 48392-48404. https://doi.org/10.1109/ACCESS.2019.2904095
[17] Oresko, J.J., Jin, Z.P., Cheng, J., Huang, S.M., Sun, Y.W., Duschl, H., Cheng, A.C. (2010). A wearable smartphone-based platform for real-time cardiovascular disease detection via electrocardiogram processing. IEEE Transactions on Information Technology in Biomedicine, 14(3): 734-740. https://doi.org/10.1109/TITB.2010.2047865
[18] Chui, K.T., Tsang, K.F.H., Chi, R., Ling, B.W.K., Wu, C.K. (2016). An accurate ECG-based transportation safety drowsiness detection scheme. IEEE Transactions on Industrial Informatics, 12(4): 1438-1452. https://doi.org/10.1109/TII.2016.2573259