Zohair Al-Ameen
© 2020 IIETA. This article is published by IIETA and is licensed under the CC BY 4.0 license (http://creativecommons.org/licenses/by/4.0/).
OPEN ACCESS
The quality of satellite images is frequently degraded by the low-contrast effect. Therefore, different research works have been developed to deal with this undesirable effect. Still, no conclusive verdicts have been reached and the problem remains open for research. Hence, an ameliorated balance contrast enhancement technique using a parabolic function (ABCETP) is proposed in this article to improve the quality in terms of brightness, contrast, and colors. The original BCETP works by determining a parabolic function with three coefficients. However, the proposed ABCETP works by computing a modified parabolic function with one modified and two unmodified coefficients, as well as, it utilizes two additional methods to produce adequate-quality results. The proposed ABCETP is examined with numerous real contrast-distorted images, compared against different contrast enhancement methods and the results are assessed with two specialized quality appraisal metrics. Empirical results obtained from conducting various comparisons and experiments revealed the favorability of ABCETP, wherein it outputted images with better-perceived quality and outperformed the comparative methods in several aspects.
ABCETP, contrast enhancement, image enhancement, satellite imaging
Satellite imagery (SI) has been utilized for different practical applications namely surveillance, education, agriculture, navigation, disaster mitigation, regional planning, and many more [1]. SI can produce different types of high-resolution images that can be either grayscale or color [2]. The perceived quality of satellite images hinges on the electromagnetic energy that is reflected from the objects at the surface of the earth [3]. Because of the earth’s atmospheric influence, some of this energy is attenuated resulting in a lack of detected energy which is the main reason for obtaining satellite images with low-contrast [4]. The contrast itself is deemed as a key element in the perception of details as images with low-contrast are less likely to be well-perceived than images with high-contrast [5]. Hence, low-contrast images are undesirable for analysis and interpretation as observing or extracting certain information is somewhat difficult [6].
Thus, it is essential to improve the contrast properly to get results with more expressive details [7]. This is a significant requirement for numerous imaging-related applications to highlight the right image details adequately [8]. The process of contrast enhancement is usually applied to achieve this goal [9]. It can be defined as the redistribution of image intensities so that the information represented in a low-dynamic range is brought out properly without introducing any undesirable flaws or taking away important details [10]. Its ultimate goal is to produce images with remarkably improved visibility than the originals without altering their pristine contents [11]. The research related to contrast enhancement has attracted the attention of different researchers, in that various research works have been introduced to provide suitable solutions.
Early research works on this topic focused on the use of straightforward linear contrast stretching (LCS) or some simple statistical methods which all have trivial computation cost [12]. The research continued to thrive and more innovative methods were proposed. A balance contrast enhancement technique using a parabolic function which is being developed in this study was introduced by Guo [13]. A few years later, a multiscale retinex with color restoration (MSRCR) was offered [14], in that it combines the MSR algorithm that failed to produce acceptable color rendition with a distinct CR scheme to produce results with better color representation. A contrast stretching approach [15] that utilizes a subjective fitness (SF) with the genetic algorithm (GA) was presented. In this study, the GA is used to change the contrast curve so that the best shape is determined based on the SF with the aid of a novel crossover mechanism that is aimed to deliver an improved genetic mix which can result in better contrast for the processed images.
Another method was introduced by Demirel et al. [16], in that it utilizes discrete wavelet transform and singular value decomposition (DWTSVD). Using DWT, a given image is disintegrated into four subbands. Using the low–low subband, the singular value array is determined and an enhanced outcome is obtained via the application of inverse DWT. The method introduced by Bhandari et al. [17] employs discrete cosine transform (DCT) with SVD, in that it starts by applying the standard histogram equalization to modify the contrast in the entire image. Then, the two required variables of DCT are computed based on the equalized image. Next, the SVD method is applied to the low subband of DCT to determine the essential SVD values of U, Σ, and V. Then based on the two DCT variables, a new Σ is computed and utilized in the enhancement process. Lastly, an inverse DCT is applied to get the resulting image.
One more method that uses DCT and SVD was proposed by Atta and Ghanbari [18], in that and the DCT pyramid method is applied to obtain the low subband of the image to be processed using histogram equalization for general enhancement. Next, the SVD method is computed for the equalized and the pristine low subbands to determine the singular value array of U, Σ, and V. Next, a new Σ value is determined and utilized in the reconstruction of a better equalized low subband. Lastly, an inverse DCT process is applied to get the resulting image. Another method of interest is the one presented by Bhandari et al. [19], in that it initially processes the input image with the general histogram equalization. Then, it applies a DWT method to get the four subbands and optimize them via a cuckoo search approach to get four thresholded subbands. After that, the SVD method is applied to the low thresholded subband to get the array of U1, Σ1, V1, and find the maximum of U1. Next, the DWT is applied on the original color image to get the low subband and apply the SVD method on it to get the array of U2, Σ2, V2, and find the maximum of U2. By using the maximum values of U1 and U2, parameter ξ is computed which helps in determining a new Σ1 for the low equalized subband. Finally, an inverse DWT approach is applied to get the resulting image.
In addition, a regularized-histogram equalization [20] with DCT (RHEDCT) method was developed. It processes the input by applying RHE via the utilization of a sigmoid function with histogram processing to create a new allocation function that is used for global enhancement. Then, the DCT factors are tuned automatically to be used for local enhancement. Another research suggested the use of modified differential evolution algorithm [21], in that it can exploit a definite fitness function to improve different aspects such as the standard deviation, entropy, and edge details by modifying a group of parameters to deliver a global transformation method for contrast enhancement. Another approach presented by Suresh et al. [22] advocates the use of an adaptive cuckoo search based enhancement (ACSE) algorithm, in that it utilizes chaotic initialization, improved Levy flight scheme and mutative randomization to ensure an optimal contrast enhancement procedure.
A different approach [23] was followed as a fractional contrast improvement method was introduced. This method includes the use of a no-reference and non-linear fractional stretching of contrast that involves an automatic inhomogeneous regularization of illumination with a non-linear stretching of local-contrast to improve the contrast and acutance of an image supposed to own poor visibility. From the reviewed methods, it can be seen that various concepts were utilized to improve the contrast of satellite images. The problems that can be recognized in the reviewed methods are as follows: to begin with, some methods can cause brightness amplification and/or color fade when improving the contrast, while other methods change the acutance of the processed images making them appear with high differences than the original counterparts. Besides, some methods require a large number of inputs, while other methods involve a high-computational cost that leads to a slow processing procedure.
Hence, this field remains available for investigation because the findings of the achieved studies are so far insufficient. Thus, an ABCETP technique is proposed in this study, in that it involves different modifications and additions to produce better quality results. Besides, it is evaluated using natural-degraded satellite images and is compared with different distinct methods, as well as, the results are assessed with specialized no-reference image quality assessment (IQA) metrics [24]. The obtained results exhibited the ability of the developed technique in processing various high-resolution images with different contrast distortion ratios and showed that it can outperform many methods in such a trait. The rest of the study is structured in the following style: Section 2 includes detailed explanations regarding the proposed ABCETP technique. Section 3 contains the attained results of experiments and comparisons with the related discussions. Section 4 comprises of certain closing remarks given as a conclusion.
A balance contrast enhancement technique (BCET) [12] was proposed to improve the contrast of remotely sensed images. In general, BCET can be implemented in two ways. The first is by using a parabolic function (BCETP), while the second is by using a cubic function (BCETC). The main aim of BCETP is to improve the contrast of a given image without changing its histogram pattern. In this study, the BCETP is further improved to provide better brightness, contrast, and colors for satellite images. The original BCETP works by determining the following parabolic function:
$Y=A{{\left( X-B \right)}^{2}}+C$ (1)
where, Y represents the final output of the technique, while X represents the inputted image. This parabolic function is controlled by three coefficients A, B, and C. Accordingly, coefficient A represents the distance between the focus point and the directrix of a parabola, in which a lower value yields the two branches of a parabola to become more open. Coefficient A is computed using the following equation:
$A=\frac{H-L}{(h-l)(h+l-2B)}$ (2)
where, h and l represent the maximum and minimum values in image X, while H and L represent the maximum and minimum values in image Y. Since the pixel values of Y should cover the entire dynamic range, the value of H is set to 255 and the value of L is set to 0. Besides, coefficients B and C represent the turning point coordinates of the parabola. Coefficient B is computed as follows:
$B=\frac{U}{2V}$ (3)
$U={{h}^{2}}\left( E-L \right)-s\left( H-L \right)+{{l}^{2}}\left( H-E \right)$ (4)
$V=2\left[ h\left( E-L \right)-e\left( H-L \right)+l\left( H-E \right) \right]$ (5)
where, E is the given mean of Y which equals to 128; parameter s signifies the mean of square X, while parameter e signifies the mean of X, wherein they can be computed as:
$e=\frac{1}{N}\sum\limits_{i=1}^{N}{{{x}_{i}}}$ (6)
$s=\frac{1}{N}\sum\limits_{i=1}^{N}{x_{i}^{2}}$ (7)
where, xi is a vector version X; N is the longest dimension of xi. Regarding coefficient C, it is computed as follows:
$C=L-A{{\left( l-B \right)}^{2}}$ (8)
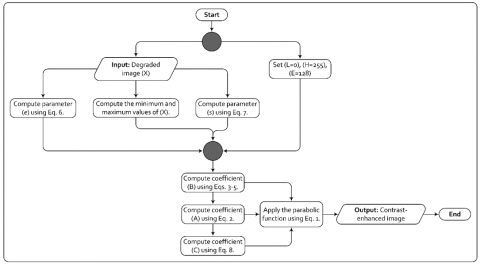
Coefficients A, B, and C are determined based mainly on the minimum, maximum, and the given mean of the output image. To provide a better understanding of the application specifics of the original BCETP, its related block diagram is given in Figure 1. When the original BCETP is applied to various degraded satellite images that are acquired by contemporary satellite devices, it is noticed that its processing ability is somewhat deficient in terms of brightness, contrast, and colors. These facts have been realized experimentally by processing many real contrast-distorted color satellite images with the original BCETP, in that some samples of attained results are shown in Figure 2.
From the samples of results provided in Figure 2, it is apparent that the BCETP provided slight contrast enhancement. Besides, the brightness has augmented in the highly brightened parts of the image as can be seen in the clouds of images b1 and b2. Likewise, the colors are observed somewhat faded in the output images of the original BCETP. Thus, the perceived quality of the processed images is almost the same as the original counterparts. This is anticipated because the BCETP tries to enhance the contrast without changing the histogram pattern, in that this notion would not provide results with acceptable attributes.
Figure 1. The block diagram of the original BCETP
Figure 2. Samples of results obtained from testing the original BCETP with different real contrast-distorted images
Figure 3. The block diagram of the proposed ABCETP
Still, this technique owns two key advantages which are, it utilizes a small number of simple calculations and it has great potential for development. Since contemporary satellite devices are capturing large-resolution images, improving the processing ability of low-complexity techniques is highly desirable to provide high-quality results rapidly. Thus, this technique is further improved to produce images with better brightness, contrast, and colors. The proposed ameliorated BCETP (ABCETP) starts by determining the largest and smallest values in the input image after converting its values from 0-255 to 0-1. The reason being, several statistical methods are used later in the developed algorithm and they require the input to be in the range of 0-1.
Then, parameters e and s are replaced by parameters ς and η, in that the value of ς represents the standard deviation [25] of X and the value η represents the discrete entropy [26] of X. The reason behind using the standard deviation is to provide better local contrast. Moreover, the reason behind using the discrete entropy is to provide a better range for λ which will be used later as a contrast tuning parameter and introduce correct colors. Parameter ς can be computed using the following equations:
$\varsigma =\sqrt{\frac{1}{N-1}\sum\limits_{i=1}^{N}{{{\left| {{x}_{i}}-\mu \right|}^{2}}}}$ (9)
$\mu =\frac{1}{N}\sum\limits_{i=1}^{N}{{{x}_{i}}}$ (10)
where, μ is the mean of xi. Besides, parameters η is computed using the following equation:
$\eta =-\sum\limits_{i}{p\left( {{x}_{i}} \right)}{{\log }_{2}}p\left( {{x}_{i}} \right)$ (11)
where, p(xi) is the probability density function of xi. Next, the values of H and L that represent the maximum and minimum pixel values of the output are set to H=1 and L=0. After that, a modified version of coefficient B denoted as Ḃ is computed with the new values of H and L using the following equation:
$\dot{B}=\frac{{{h}^{2}}\left( \lambda \right)-\eta +{{l}^{2}}\left( 1-\lambda \right)}{2\left[ h\left( \lambda \right)-\varsigma +l\left( 1-\lambda \right) \right]}$ (12)
where, λ is a tuning parameter that is used for contrast adjustment, in that it satisfies (λ > 0), as a greater value results in more contrast enhancement and vice versa. After that, coefficient A and C are computed in a similar way to the original BCETP with the consideration of Ḃ instead of B. Next, a modified parabolic function denoted as Ẏ is applied to determine the enhanced image as follows:
$\dot{Y}=A{{\left( \sinh \left( X \right)-\dot{B} \right)}^{2}}+C$ (13)
where, sinh is the hyperbolic sine of the input image. Hyperbolic functions can provide an S-shaped transformation when applied to digital images [27]. Different S-shaped transformations have been utilized to improve the contrast of digital images [28], in that when the contrast is properly enhanced, the colors are perceived better [29]. Thus, a hyperbolic sine function is utilized to provide more noticeable enhancements in terms of contrast and colors. At this point, the obtained image has better contrast and colors. Still, its brightness remains deficient and thus requires further enhancement. Hence, the cumulative distribution function of type II generalized logistic distribution (CDF-GLD-II) is utilized to provide an additional brightness enhancement. The used CDF-GLD-II function is computed as follows [30]:
$G=1-\frac{\exp \left( -\delta \dot{Y} \right)}{{{\left( 1+\exp \left( -\dot{Y} \right) \right)}^{\delta }}}$ (14)
where, G is the output the CDF-GLD-II function; δ is a tuning parameter that is used to improve the brightness, in which it fulfills (δ>0), as a greater value results in more brightness enhancement and vice versa. This function performs well in brightness enhancement, yet it limits the distribution of image intensities to a specific range. Hence, an automatic linear contrast stretching (ALCS) approach is applied to provide a full-scale stretch by reallocating the intensities to the full natural interval. The used stretching approach can be computed as follows [31]:
$R=\alpha *G-\beta $ (15)
where, R is the final output of the proposed technique. The stretching factors α and β are utilized to adjust the stretching extent, in that they are determined as follows:
$\alpha =\frac{1}{\max \left( G \right)-\min \left( G \right)}$ (16)
$\beta =\frac{\min \left( G \right)}{\max \left( G \right)-\min \left( G \right)}$ (17)
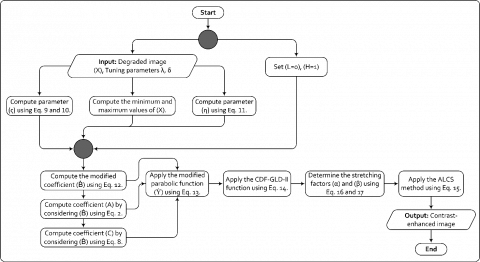
where, max and min are the uppermost and lowermost intensity values in image G. Lastly, a block diagram of the proposed ABCETP technique is given in Figure 3 to provide a better understanding regarding its implementation specifics.
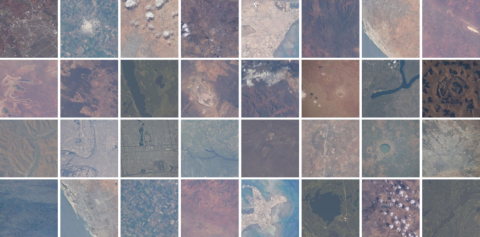
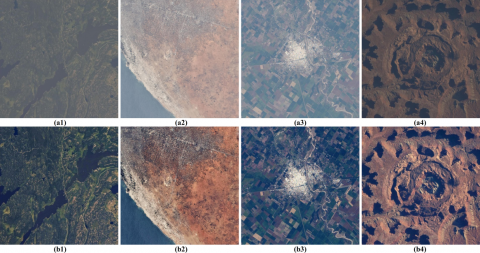
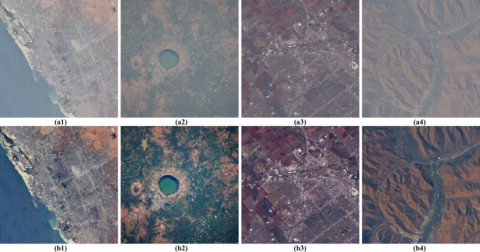
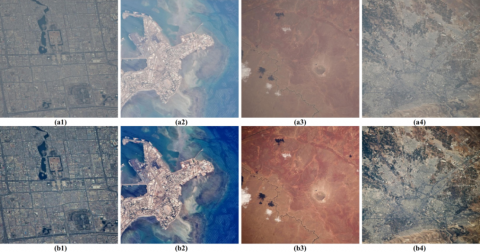
In this section of the article, descriptions regarding the used dataset, IQA metrics, and comparison methods are given. Likewise, the computer specifications along with figures’ and tables’ allocations are mentioned. Besides, the results obtained from performing many comparisons and experiments are displayed and the related discussions are stated. As for the used dataset, more than eighty images were collected from the website of the earth science and remote sensing unit, NASA Johnson space center which can be reached at https://eol.jsc.nasa.gov. This website contains various real contrast-distorted, high-resolution, and large-dimension color satellite images for different places around the globe. Samples of the collected images from the aforementioned website are displayed in Figure 4.
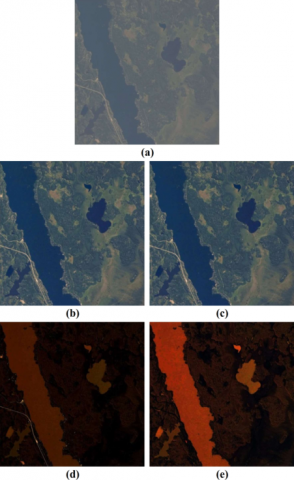
As for IQA, two specialized metrics are utilized namely, natural scene statistics (NSS) [32] and colorfulness (CFN) [33]. The NSS metric depends on the assumption that degrading the contrast changes the image’s statistical features, making it appear with an unnatural appearance. Thus, evaluating the contrast of a contrast-distorted image is done based on its unnaturalness feature by considering how much it deviated from the pre-determined NSS models that have been created based on the entropy and moment features of a huge image database. Oppositely, the CFN metric utilizes the standard deviations and the averages of two axes represented in an easy adversary color depiction. The output of both metrics is a real number that is greater than zero, in that larger values indicate improved contrast representation for NSS and better color representation for CFN. As for the comparison methods, six of such are utilized namely, LCS [12], the original BCETP [13], MSRCR [14], DWTSVD [16], RHEDCT [20], and ACSE [22]. The proposed ABCETP is developed using MATLAB 2018a with a computer that is equipped with an Intel Core I7-7700 2.8 GHz processor and 16 GB of memory. Figure 5 shows a sample of results that signify the effect of using ς and η in the proposed technique.
As seen in Figure 5, utilizing both ς and η lead to produce an image with lucid details. As for not using ς, the resulting image has a slightly less local contrast and the difference is barely visible yet identified by the NSS metric. However, when η was not used, the resulting image suffered from faulty color representation. When both ς and η were not used, faulty colors were presented with higher brightens. Thus, utilizing both ς and η is of noticeable importance to the quality of results.
Figure 4. Samples of different real contrast-distorted color dataset images
Figure 5. Testing the proposed ABCETP technique with the application of ς and η. (a) real contrast-distorted color image (NSS=2.3720); the other images are processed by ABCETP: (b) with both ς and η (NSS=2.4008); (c) without ς but with η (NSS=2.3778); (d) with ς but without η (NSS=2.0759); (e) without both ς and η (NSS=2.2716)
Figures 6 to 8 display the attained experimental results from applying the developed ABCETP technique on various natural contrast-distorted color satellite images. Figures 9 and 10 show the results of the conducted comparisons. Table 1 exhibits the recorded IQA readings and operation times. Figure 11 illustrates the graphical representations of the average IQA readings in Table 1. When viewing the results obtained in Figures 6 to 8, it can be confirmed that the developed technique yielded satisfactory results, as the brightness is adequate, the contrast is natural, the colors are adequately bright and the final quality of the results is highly acceptable. Besides, it did not induce any visual errors to the resulting images. When the contrast-distorted images are confronted with their recovered equivalents, it looks as if a coat of fog is being discarded while improving the lucidity of essential details.
This is an important achievement because a low-complexity technique is adequately developed to be suitable for processing images that are captured by modern satellite devices and produce high-quality results. Besides, it can be observed that different λ and δ values are used for each image since parameters λ, δ control the proposed technique’s enhancement abilities. Both parameters have a numerical value chosen and inputted by the user, in that they must fulfill (λ, δ>0), where higher λ value leads to more contrast enhancement, while higher δ value leads to more brightness enhancement and vice versa. The reason being, each image has different characteristics and distortion ratios. Still, results that own adequate visual qualities are obtained by the developed technique for all the recovered images.
When it comes to the outcomes of comparisons given in Table 1 and Figures 9 to 11, obvious performance variations are noticed owing to the utilization of different methods that use different working mechanisms. The LCS and BCETP have recorded nearly similar performances in terms of contrast and colors, slightly in favor of BCETP. Still, they both scored moderately according to NSS and above moderate according to CFN. However, the LCS was faster and in fact, it was the fastest method among the competitors. The results of MSRCR tend to be yellowish and have blackened areas. Thus, it scored above moderate according to NSS yet very high according to CFN with below moderate operation times.
Figure 6. Processing natural contrast-distorted color satellite images by the developed ABCETP technique. (a1-a4) low-contrast images; (b1-b4) recovered images by ABCETP with (λ,δ)={(13,8), (12,3.5), (11,4), (15,5)}, respectively
Figure 7. Processing natural contrast-distorted color satellite images by the developed ABCETP technique. (a1-a4) low-contrast images; (b1-b4) recovered images by ABCETP with (λ,δ)={(11,4), (14,9), (6,5), (11,4)}, respectively
Figure 8. Processing natural contrast-distorted color satellite images by the developed ABCETP technique. (a1-a4) low-contrast images; (b1-b4) recovered images by ABCETP with (λ,δ)={(8,6), (15,4), (6,4), (10,4)}, respectively
Figure 9. The attained results from the conducted comparisons. (a) natural contrast-distorted image; the following images are processed by: (b) LCS; (c) BCETP; (d) MSRCR; (e) DWTSVD; (f) RHEDCT; (g) ACSE; (h) Proposed ABCETP
Figure 10. The attained results from the conducted comparisons. (a) natural contrast-distorted image; the following images are processed by: (b) LCS; (c) BCETP; (d) MSRCR; (e) DWTSVD; (f) RHEDCT; (g) ACSE; (h) Proposed ABCETP
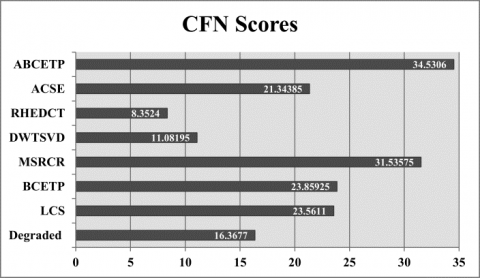
(a)
(b)
Figure 11. The graphical representations of the average IQA readings in Table 1: (a) NSS scores; (b) CFN scores
As for the DWTSVD, it did not perform well as it provided trivial contrast enhancement and the results tend to be yellowish to some extent. For those reasons, it recorded below moderate in NSS and low in CFN with moderate operation times. The RHEDCT gave an unusual performance as it well-improved the contrast but provided washed out colors, which is justified by the very high NSS scores and the extremely low scores of CFN. In terms of operation times, it was somewhat fast. The ACSE is another different case as it provided a marginal improvement in contrast and acutance which justifies the above moderate scores of NSS and the moderate scores of CFN. However, it was the slowest among the competitors as it required extremely high operation times to produce the results. To summarize, the problems of the compared methods are as follows: LCS and BCETP provided insufficient enhancement, MSRCR provided yellowish colors and blackened areas, DWTSVD provided insufficient enhancement with yellowish colors, RHEDCT provided washed-out colors, ACSE provided insufficient enhancement with extremely high operation time.
The proposed technique provided satisfactory performances in different aspects. Firstly, it provided pleasant visual quality for the processed images without any visible processing flaws with somewhat fast processing times. Secondly, it scored the highest in terms of NSS and CFN. This means that it introduced the recovered images with adequate contrast and enriched colors. The advantages of the proposed technique are as follows: it can process the input images rapidly and provide them with natural contrast and enriched colors. Despite that, the only drawback is that it is not fully automatic as the values of λ and δ must be determined manually by the user. Still, reaching high-quality with relatively fast processing is an uneasy goal to achieve when developing a legacy technique. However, this goal is met in this study as the proposed technique outperformed the competitors in many aspects. Finally, it is anticipated the ABCETP can be further adapted to cover other real-world uses and further improved to become fully-automatic.
Table 1. Operation times and quality evaluations for the performed comparisons
|
Competitors |
Figures |
NSS |
CFN |
Times |
|
Degraded |
9 |
2.4041 |
12.8901 |
N/A |
|
10 |
2.5379 |
19.8453 |
N/A |
|
|
Avg. |
2.471 |
16.3677 |
N/A |
|
|
LCS |
9 |
2.4700 |
16.6684 |
0.004884 |
|
10 |
3.0609 |
30.4538 |
0.004673 |
|
|
Avg. |
2.76545 |
23.5611 |
0.0047785 |
|
|
BCETP |
9 |
2.4481 |
17.2127 |
0.021140 |
|
10 |
3.0955 |
30.5058 |
0.021731 |
|
|
Avg. |
2.7718 |
23.85925 |
0.0214355 |
|
|
MSRCR |
9 |
2.9555 |
28.4318 |
0.759318 |
|
10 |
3.1611 |
34.6397 |
0.584112 |
|
|
Avg. |
3.0583 |
31.53575 |
0.671715 |
|
|
DWTSVD |
9 |
2.4153 |
8.7303 |
0.675873 |
|
10 |
2.5124 |
13.4336 |
0.508382 |
|
|
Avg. |
2.46385 |
11.08195 |
0.5921275 |
|
|
RHEDCT |
9 |
3.4444 |
4.6294 |
0.635408 |
|
10 |
3.3097 |
12.0754 |
0.371964 |
|
|
Avg. |
3.37705 |
8.3524 |
0.503686 |
|
|
ACSE |
9 |
2.7291 |
16.8322 |
293.0256 |
|
10 |
2.8203 |
25.8555 |
292.1656 |
|
|
Avg. |
2.7747 |
21.34385 |
292.5956 |
|
|
ABCETP |
9 |
3.4607 |
31.3923 |
0.113733 |
|
10 |
3.4433 |
37.6688 |
0.118016 |
|
|
Avg. |
3.452 |
34.5306 |
0.1158745 |
An ameliorated version of the original BCETP technique is developed in this study for contrast enhancement of satellite images. The applied modifications include the use of an amended parabolic function with an altered coefficient in addition to the inclusion of two supplementary enhancement methods. These modifications allowed the attainment of results that have improved visible traits. Besides, the developed technique is tested with a dataset that contains different high-resolution color images of poor-contrast, compared with numerous renowned methods, and assed with specialized IQA metrics. Various experiments and comparisons were made, and the obtained results revealed the confirmed ability of the ABCETP technique in processing images rapidly and efficiently. This is a true achievement as not many calculations are involved to produce results with acceptable brightness, natural contrast, and vivid colors. As future works, the proposed technique can be further improved to be fully automatic and can be further adapted to enhance images that are obtained from other imaging devices.
I would like to express my prodigious gratitude to the earth science and remote sensing unit, NASA Johnson space center for allowing the use of their images in this study. Also, I would like to thank the Computer Science Department at the University of Mosul for providing various facilitations that backed the achievement of this research.
[1] Asokan, A., Popescu, D.E., Anitha, J., Hemanth, D.J. (2020). Bat algorithm based non-linear contrast stretching for satellite image enhancement. Geosciences, 10(2): 1-12. https://doi.org/10.3390/geosciences10020078
[2] Witwit, W., Zhao, Y., Jenkins, K.W., Zhao, Y. (2017). Satellite image resolution enhancement using discrete wavelet transform and new edge-directed interpolation. Journal of Electronic Imaging, 26(2): 1-9. https://doi.org/10.1117/1.jei.26.2.023014
[3] Voronin, V. (2019). Modified local and global contrast enhancement algorithm for color satellite image. In EPJ Web of Conferences, 224: 1-5. https://doi.org/10.1051/epjconf/201922404010
[4] Lisani, J.L., Michel, J., Morel, J.M., Petro, A.B., Sbert, C. (2016). An inquiry on contrast enhancement methods for satellite images. IEEE Transactions on Geoscience and Remote Sensing, 54(12): 7044-7054. https://doi.org/10.1109/tgrs.2016.2594339
[5] Lee, S., Kim, C. (2019). Ramp distribution-based contrast enhancement techniques and over-contrast measure. IEEE Access, 7: 73004-73019. https://doi.org/10.1109/access.2019.2920015
[6] Bhandari, A.K., Soni, V., Kumar, A., Singh, G.K. (2014). Artificial bee colony-based satellite image contrast and brightness enhancement technique using DWT-SVD. International Journal of Remote Sensing, 35(5): 1601-1624. https://doi.org/10.1080/01431161.2013.876518
[7] Singh, H., Kumar, A., Balyan, L.K., Lee, H.N. (2019). Optimally sectioned and successively reconstructed histogram sub-equalization based gamma correction for satellite image enhancement. Multimedia Tools and Applications, 78(14): 20431-20463. https://doi.org/10.1007/s11042-019-7383-0
[8] Bhandari, A.K., Kumar, A., Singh, G.K., Soni, V. (2016). Dark satellite image enhancement using knee transfer function and gamma correction based on DWT–SVD. Multidimensional Systems and Signal Processing, 27(2): 453-476. https://doi.org/10.1007/s11045-014-0310-7
[9] Pyka, K. (2017). Wavelet-based local contrast enhancement for satellite, aerial and close range images. Remote Sensing, 9(1): 1-17. https://doi.org/10.3390/rs9010025
[10] Hsieh, P.W., Shao, P.C., Yang, S.Y. (2020). Adaptive variational model for contrast enhancement of low-light images. SIAM Journal on Imaging Sciences, 13(1): 1-28. https://doi.org/10.1137/19M1245499
[11] Bhandari, A.K., Kumar, A., Singh, G.K. (2015). Improved knee transfer function and gamma correction based method for contrast and brightness enhancement of satellite image. AEU-International Journal of Electronics and Communications, 69(2): 579-589. https://doi.org/10.1016/j.aeue.2014.11.012
[12] Short, N.M. (1982). The Landsat tutorial workbook: Basics of satellite remote sensing. National Aeronautics and Space Administration, Scientific and Technical Information Branch, Washington, DC, 1078: 433-437
[13] Guo, L.J. (1991). Balance contrast enhancement technique and its application in image colour composition. International Journal of Remote Sensing, 12(10): 2133-2151. https://doi.org/10.1080/01431169108955241
[14] Jobson, D.J., Rahman, Z.U., Woodell, G.A. (1997). A multiscale retinex for bridging the gap between color images and the human observation of scenes. IEEE Transactions on Image Processing, 6(7): 965-976. https://doi.org/10.1109/83.597272
[15] Munteanu, C., Lazarescu, V. (1999). Evolutionary contrast stretching and detail enhancement of satellite images. Proceedings of MENDEL’99, pp. 94-99.
[16] Demirel, H., Ozcinar, C., Anbarjafari, G. (2010). Satellite image contrast enhancement using discrete wavelet transform and singular value decomposition. IEEE Geoscience and Remote Sensing Letters, 7(2): 333-337. https://doi.org/10.1109/lgrs.2009.2034873
[17] Bhandari, A.K., Kumar, A., Padhy, P.K. (2011). Enhancement of low contrast satellite images using discrete cosine transform and singular value decomposition. International Journal of Computer and Information Engineering, 5(7): 707-713. https://doi.org/10.5281/zenodo.1331359
[18] Atta, R., Ghanbari, M. (2013). Low-contrast satellite images enhancement using discrete cosine transform pyramid and singular value decomposition. IET Image Processing, 7(5): 472-483. https://doi.org/10.1049/iet-ipr.2013.0083
[19] Bhandari, A.K., Soni, V., Kumar, A., Singh, G.K. (2014). Cuckoo search algorithm based satellite image contrast and brightness enhancement using DWT–SVD. ISA Transactions, 53(4): 1286-1296. https://doi.org/10.1016/j.isatra.2014.04.007
[20] Fu, X., Wang, J., Zeng, D., Huang, Y., Ding, X. (2015). Remote sensing image enhancement using regularized-histogram equalization and DCT. IEEE Geoscience and Remote Sensing Letters, 12(11): 2301-2305. https://doi.org/10.1109/lgrs.2015.2473164
[21] Suresh, S., Lal, S. (2017). Modified differential evolution algorithm for contrast and brightness enhancement of satellite images. Applied Soft Computing, 61: 622-641. https://doi.org/10.1016/j.asoc.2017.08.019
[22] Suresh, S., Lal, S., Reddy, C.S., Kiran, M.S. (2017). A novel adaptive cuckoo search algorithm for contrast enhancement of satellite images. IEEE Journal of Selected Topics in Applied Earth Observations and Remote Sensing, 10(8): 3665-3676. https://doi.org/10.1109/jstars.2017.2699200
[23] Trongtirakul, T., Chiracharit, W., Imberman, S., Agaian, S. (2019). Fractional contrast stretching for image enhancement of aerial and satellite images. Journal of Imaging Science and Technology, 63(6): 60411-1. https://doi.org/10.2352/j.imagingsci.technol.2019.63.6.060411
[24] Mittal, A., Muralidhar, G.S., Ghosh, J., Bovik, A.C. (2011). Blind image quality assessment without human training using latent quality factors. IEEE Signal Processing Letters, 19(2): 75-78. https://doi.org/10.1109/LSP.2011.2179293
[25] Zou, Y., Dai, X., Li, W., Sun, Y. (2015). Robust design optimisation for inductive power transfer systems from topology collection based on an evolutionary multi-objective algorithm. IET Power Electronics, 8(9): 1767-1776. https://doi.org/10.1049/iet-pel.2014.0468
[26] Wang, C., Ye, Z. (2005). Brightness preserving histogram equalization with maximum entropy: a variational perspective. IEEE Transactions on Consumer Electronics, 51(4): 1326-1334. https://doi.org/10.1109/tce.2005.1561863
[27] Kwak, Y., Li, C., MacDonald, L. (2003). Controling color of liquid‐crystal displays. Journal of the Society for Information Display, 11(2): 341-348. https://doi.org/10.1889/1.1825665
[28] Tohl, D., Li, J.S.J. (2017). Image enhancement by s-shaped curves using successive approximation for preserving brightness. IEEE Signal Processing Letters, 24(8): 1247-1251. https://doi.org/10.1109/LSP.2017.2718018
[29] Liu, N., Yan, H. (1994). Improved method for color image enhancement based on luminance and color contrast. Journal of Electronic Imaging, 3(2): 190-198. https://doi.org/10.1117/12.173323
[30] Kumar, D. (2014). On moment generating function of generalized order statistics from extended type II generalized Logistic distribution. Journal of Statistical Theory and Applications, 13(2): 135-150. https://doi.org/10.2991/jsta.2014.13.2.4
[31] Al-Ameen, Z. (2020). Contrast enhancement of medical images using statistical methods with image processing concepts. IEEE 6th International Engineering Conference (IEC2020), pp. 1-5.
[32] Fang, Y., Ma, K., Wang, Z., Lin, W., Fang, Z., Zhai, G. (2015). No-reference quality assessment of contrast-distorted images based on natural scene statistics. IEEE Signal Processing Letters, 22(7): 838-842. https://doi.org/10.1109/lsp.2014.2372333
[33] Susstrunk, S.E., Winkler, S. (2003). Color image quality on the internet. In Internet Imaging V, 5304: 118-131. https://doi.org/10.1117/12.537804