Mahesh Kumar Singh | Durgesh Nandan* | Sanjeev Kumar
© 2019 IIETA. This article is published by IIETA and is licensed under the CC BY 4.0 license (http://creativecommons.org/licenses/by/4.0/).
OPEN ACCESS
The voice signals of human are a type of acoustic signal that transfers the information about the message or word delivered in the form of speech. The speech of each person has its unique acoustic features. The statistical analysis of such features is critical to the speech recognition. Therefore, this paper aims to identify the speaker through statistical analysis of acoustic features of voice signals. First, the data collection method for speech samples was introduced, the voice signals were divided into three categories, namely, normal voice (NV), lower pitch (LP) and raised pitch (RP), and the effects of the LP and RP on speech were discussed. Then, a feature extraction method was coupled with several classifers to identify the LP and RP for speaker identification. Next, the MFCC, ΔMFCC and ΔΔMFC were adopted to extract the acoustic features. Finally, the proposed method was verified through a speaker identification experiment. The results show that our method can accurately capture the acoustic features of each speaker, and correctly differentiate between the NV, LP and RP. The research results are of great significance to speech recognition and speaker identificaiton.
acoustic feature, statistical analysis, feature extraction, SVM classifier, speaker identification
Speech communication is the basic mean of communication. Speaker identification in speech signal processing is a process to identify a particular person's voice for verification of identity. In the speaker, identification identifies the particular word or message who is speaking [1]. In speech signal processing, speech is classified into two categories as voice speech and unvoiced speech which depends on the vocal cords on speech in speech production technique [2]. Voiced speech produced when vocal cords inactive like /a/e/i/o/u/, unvoiced voice produced when vocal cords are inactive like /s/f/l/ these are produced only when vocal cords vibrate. Other classes of sounds are nasal sounds and plosive sounds. In this research work, the different speaker speaks the same string of words/sentences that deliver the same information but results are different in some dialect like length, pitch, frequency and oscillation [3].
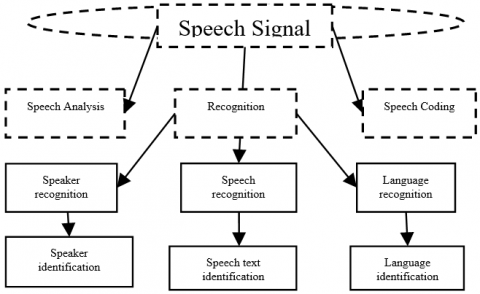
In this area of research speech signal processing that includes speech coding, speaker recognition, speech analysis and synthesis, speech enhancement, etc. The most important applications of speech identification are used in the forensic department for speaker identification in the speech recognition area as illustrated in Figure 1.
This method mostly used in forensic speaker recognition in which determining individual speaker voice that is tracing in different physical moments. In the speech signals, speech recognition in different ways as for example speech recognition, language recognition and speaker recognition [4]. Speech recognition, recognize a particular text or word as for example “my name is Mahesh” means recognize a particular text. In language recognition, recognize a particular language as an example of English/Russian [5]. In the speaker recognition process, the identification of the speaker means that a particular sentence who is speaking. The detail recognition process is shown in Figure 2.
In Figure 2, this is shown the different steps of voice recognition. This paper is consisting of the speaker identification process that is marked in dotted lines that means a particular text/sentence deliver by a particular person [6]. In this research work, a normal voice (NV) is used for reference purpose and analysis of the voice tone of a speaker by different method lowered pitch (LP) and raised pitch(RP) [7].
Calculation of acoustic analysis of different speech signals In non-electronic disguised methods there are some changes in the frequency spectrum of speech signal MFCC, ΔMFCC, and ΔΔMFCC coefficients are used to specify the frequencies spectral property of speech signal [8]. Identification of speaker and feature extraction are calculated by the MFCC, ΔMFCC, ΔΔMFCC of all types of speech signals [9]. The acoustic feature and its statistical moments, correlation coefficient, mean and are calculated for normal voice (NV) for reference purpose as well as raised pitch and lower pitch voice signal by MFCC algorithm [10]. Using this approach the mean value and the correlation coefficients are essential for identification of voice signal. In this approach, the mean value and the correlation coefficient are essential for the identification of all types of voice signals. The speaker identification task is segmented into two stages: training stage and testing stage. In the testing and training stage, speakers enroll by providing voice samples to the system [11]. A speech model is formed with the extraction of speaker-specific details from these voice samples of the speakers. In the testing stage, the system compares the speaker’s normal voice with the lowered and raised voice to make a decision. Speech samples are taken in the form of normal voice, lowered pitch and raised pitch [12]. In the feature extraction technique, statistical analysis as mean and correlation coefficient of normal voice, raised pitch and lower pitch are determined [13]. The SVM classifier algorithms used for finding an acoustic feature included the normal voice feature and the raised and lower pitch features for each class of dataset based on testing data training data [14]. The database for training and testing purposes is made by collecting the voice sample of 20 male candidates by the Audacity tool [15]. It contains the normal voice and the raised and lowered pitch of the common speech text “my name is Mahesh Singh” for a duration of 3.5 sec.
This paper segmented as section-2 described the technique of speech sample group or data collection method, which explains the effect of raised and lowered pitch on speech. In section-3, the methodology used for identifying raised and lowered pitch for speaker identification by using a feature extraction method and classifiers. Section-4 uses MFCC, ΔMFCC, ΔΔMFC for extracting the acoustic features. In section 5, explains for speaker identification, each speaker has unique acoustic feature mean and correlation coefficients, which is tested by using the classifiers and express the comparative analysis between acoustic feature and statistical parameter of normal voice, raised pitch and lower pitch as well as performances of the classifier. Finally, conclusions are drawn in Section 6.
Figure 1. Block diagram of the speech recognition process
Figure 2. Speech recognition system
The voice sample collection for the database totals 20 students is selected for this research work the age between 20 to 25 years [16]. They deliver the common text in normal voice sample ‘A’. Therefore lowered and raised pitch speech signals are used to create the second portion of data set such as; ‘B’. The common text voice sample was recorded by audacity recording tool with 32-bit quantization, 8 KHz sampling rate into .wav file and mono [17].
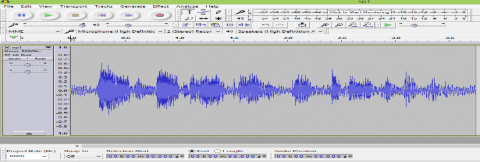
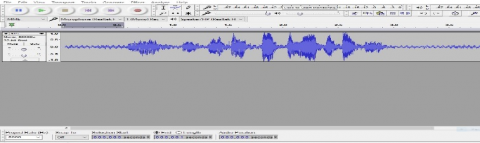
All recorded voice samples ‘A’ are inserted as input to the database system for identification purpose and speech samples of ‘B’ are used as voice samples for the training and testing purpose. A sample of voice against the speech “my name is Mahesh Singh” is shown below in Figure 3. For speaker identification taking the voice of common speaker at different physical conditions like normal voice, raised pitch speech sample shown in Figure 4 and lower pitch voice sample shown in Figure 5 for experimental purpose [18].
In all figure shows that the speech signal is a time-varying signal in which speech signal varying all instant of time. In a text-dependent speech identification system that has the information of the text that is to be delivered by a speaker. Problem statement for designing a system to the identification of a speaker in different pitch as usual shown in above Figure 4 and Figure 5. for lower pitch and raised pitch [19].
Figure 3. Normal voice sample
Figure 4. Raised pitch voice sample
Figure 5. Lowered pitch voice sample
The speaker identification system identifies the speaker particular information based on their recorded voices to the identification or verification of an unknown speaker. For identification of speaker, a lot of identification process is now used for speaker recognition field. This system used a verification tool for verification of an unknown speaker [20]. The speaker's particular information is being generated by the rapid change in a different features of the speech production technique. In Figure 6 below shows the specific block of the speaker identification system.
The speaker identification process aims to extract the features of speakers that content from the speech signals. It is used for identification, security and for confidential purposes. This technique makes speaker identification works are represented into two stages: the testing stage and training stage, as represented in Figure 7.
In the stage of training, speakers enrolled by providing a speech sample to the respective system. In the speech, signal models are formed by the feature extraction of speaker particular details that are derived from the voice samples of all speakers.
In the stage of testing, the testing system compares with the speaker's voice with the help of the speech signal model of all speakers to make a decision through SVM Classifier [21]. Acoustic feature extraction used in speaker identification is divided into statistical analysis, spectral analysis and parametric transformation [22]. The extraction of the feature of a speech signal used the Mel-cepstral coefficient, which is an alternative approach for acoustic feature extraction. Mathematical analysis of acoustic feature extraction of the speech signal and calculation of statistical moments are as follows also shown through the block diagram in Figure 8.
Figure 6. Lowered pitch voice sample
Figure 7. Two different phases of the speaker recognition system
Figure 8. Block diagram of MFCCs
By taking x(n) is a voice sample of N frames among the MFCC vector. Suppose vmn is the nth value of MFCC dimensional vector of mthh frame, Vn is the vector of the nth element. Here Vn is shown as:
$V_{n}=\{v 1 n, v 2 n, \ldots \ldots, v N n\} ;$ wheren $=1,2, \ldots \ldots L$ (1)
In this paper, two different types of acoustic feature coefficients are calculated. One of them the mean En of each MFCC feature coefficients. Vn is extracted and then the correlation coefficients
among different MFCC features Vi and Vj are calculated as given below$E_{n}=E\left(V_{n}\right) ; n=1,2, \ldots \ldots L$ (2)
$C R_{n n \prime}=\frac{\operatorname{cov}\left(v_{n} V_{n}\right)}{\sqrt{v a r\left(V_{n}\right)} \sqrt{n a r\left(V_{n^{\prime}}\right)}} ; 1 \leq n<n^{\prime} \leq L$ (3)
The resultant value of the $E_{n}$ and CRnn are used together to indicated the arthmetical moment KMFCC of MFCC vectors as described in below equation:
$K_{M P C C}=\left(E_{1}, E_{2} \ldots . . E_{L}, C R_{12}, C R_{13}, \ldots . . C R_{L-1 L}\right)$ (4)
As well as, the arithmetical coefficients of delta MFCC $\left(K_{\Delta M F C C}\right)$ and double delta MFCC $\left(K_{\Delta \Delta M F C C}\right)$ are determined. Finally, by combining $K_{M F C C}, \quad K_{\Delta M F C C}$ and $K_{\Delta \Delta M F C C}$ an statistical moment K is created, which is given as:
$K=\left[K_{M F C C}, K_{\Delta M F C C}, K_{\Delta \Delta M F C C}\right]$ (5)
The speech that is dependent on the text of speech signals has previous information concerning the text that is spoken by different speakers. This methodology based on, a text-dependent speaker identification method used [10]. It could be explained as the identical feature tendency of original voice and acoustic feature coefficients of the nonraised and lower pitch disguised voice [7].
Support Vector Machine (SVM)
SVM classification technique is based on an algorithm that is using non-linear mapping techniques to convert the normal voice training component into a larger dimension measurement. The SVM classification techniques are based on a supervised learning mechanism, that required testing and training dataset before to classification. The SVM classifier receives a series of the dataset and calculated every information as input and next it divided into two promising classes [2]. In SVM classification techniques testing and training, datasets are used to remove the fault function that is analyzed as
$\operatorname{erfc}(\mathrm{x})=\frac{1}{2}\left(\mathrm{u}^{\mathrm{t}} \mathrm{u}+\mathrm{K} \sum_{\mathrm{n}=1}^{\mathrm{N}}\left(\mu_{\mathrm{n}}\right)\right.$ (6)
$\mathrm{y}_{\mathrm{n}}\left(\mathrm{u}^{\mathrm{T}} \theta+\mathrm{a}\right) \geq 1-\mu_{\mathrm{n}}$ and $\mu_{\mathrm{n}} \geq 0, \mathrm{n}=1,2, \ldots \ldots \ldots \mathrm{N}$ (7)
where, $^{\prime} a^{\prime}$ is denoted as constant, $^{\prime} K^{\prime}$ denoted as capacity coefficients, $^{\prime} \mu^{\prime}$ denotes as handling constant, $^{\prime} u^{\prime}$ represent the vector coefficient shown in Figure 9.
Figure 9. SVM classifier detection parameter
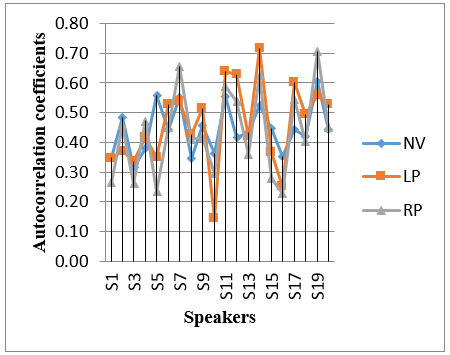
After calculating all these steps for each speaker, the acoustical feature set and its statistical moments can be obtained for each speaker by calculating mean value through the MFCCs feature extraction also calculate the statistical mean by delta and double delta MFCCs. Table-1 represents the MFCC mean value of normal voice (NV), raised pitch(RP) and lower pitch(LP) respectively. Table 1 shows that the mean values calculated from the feature extraction techniques by MFCC of 20 speakers normal voice as well as raised pitch and lower pitch speech respectively. In the table shown that every and individual speaker's voice have unique acoustical features. It helps us to the identification of an unknown speaker from known speakers. From the analysis of the mean result with the previous result, it is shown that the feature extraction from the MFCC technique is better performance from the existing result. Another acoustic feature calculation result calculated as the correlation coefficients from the MFCC acoustic analysis. The results are shown in Table 2.
The identification of the speaker from raised and lower pitch contains a training level and a testing level. The training level of the speech sample, the speech dataset, that is calculated off the normal voice as well as raised and lower pitch speech model is represented. The calculated feature vectors from the calculated statistical coefficients of the original voice dataset along with the raised and lower pitch voice used for testing and training purposes. From the lower and raised is used as the testing component to test and training features from SVM classifier in the classification of the voice whether a training voice is raised the pitch, lower pitch and normal voice identify a speaker if his voice is raised the lower pitch. The calculated database that is consists of the 60 voice samples included the original voice raised the pitch and lower pitch shown in Figure 10. Thereafter, the database is randomly divided into two adjacent parts: 20 normal voice sample segments of 20 speakers and 40 voice sample segments from the raised pitch and lower pitch. Resulting, the 40 voice samples consist of 20 raised pitch and 20 lowered pitch voices sample is considered. Out of 40 samples, 27 are identified as the normal voice for a training class and 13 samples are used for testing class. For each and every disguising methodology, the efficiency of voice classification is calculated by SVM classifiers. The results are shown below in Table 3.
Table 1. The comparative mean result with previous work [1] and our result
|
S.N. |
Speakers |
Existing Result (Mean) |
ProposedStatistical Result (Mean) |
||||
|
NV |
LP |
RP |
NV |
LP |
RP |
||
|
1 |
S1 |
0.95 |
0.86 |
0.25 |
1.00 |
0.62 |
0.69 |
|
2 |
S2 |
1.00 |
1.00 |
0.28 |
0.89 |
1.00 |
0.66 |
|
3 |
S3 |
0.99 |
0.88 |
0.44 |
1.00 |
0.45 |
0.52 |
|
4 |
S4 |
1.00 |
0.88 |
0.43 |
0.96 |
1.00 |
0.57 |
|
5 |
S5 |
1.00 |
1.00 |
0.49 |
0.98 |
0.56 |
0.59 |
|
6 |
S6 |
1.00 |
0.77 |
0.28 |
1.00 |
0.60 |
0.60 |
|
7 |
S7 |
0.88 |
0.71 |
0.05 |
0.88 |
0.57 |
0.58 |
|
8 |
S8 |
1.00 |
0.72 |
0.36 |
1.00 |
0.68 |
0.57 |
|
9 |
S9 |
1.00 |
0.73 |
0.27 |
0.96 |
1.00 |
0.89 |
|
10 |
S10 |
0.95 |
0.28 |
0.39 |
1.00 |
0.61 |
0.60 |
|
11 |
S11 |
0.68 |
0.96 |
0.49 |
0.86 |
0.57 |
0.89 |
|
12 |
S12 |
1.00 |
1.00 |
0.19 |
1.00 |
0.63 |
0.62 |
|
13 |
S13 |
1.00 |
1.00 |
1.00 |
0.98 |
0.98 |
0.58 |
|
14 |
S14 |
0.76 |
0.52 |
0.16 |
1.00 |
0.58 |
1.00 |
|
15 |
S15 |
1.00 |
0.69 |
0.16 |
1.00 |
0.68 |
0.60 |
|
16 |
S16 |
0.95 |
0.83 |
0.30 |
0.99 |
1.00 |
0.98 |
|
17 |
S17 |
1.00 |
0.80 |
0.51 |
0.92 |
0.58 |
0.60 |
|
18 |
S18 |
0.83 |
0.53 |
0.22 |
1.00 |
0.57 |
0.63 |
|
19 |
S19 |
1.00 |
1.00 |
1.00 |
1.00 |
0.58 |
0.62 |
|
20 |
S20 |
0.81 |
0.75 |
0.31 |
0.98 |
1.00 |
0.60 |
Table 2. Similarity rates of correlation coefficients of RP, LP with normal voice
|
S.N. |
Speakers |
Correlation Coefficients |
||
|
NV |
LP |
RP |
||
|
1 |
S1 |
0.35 |
0.35 |
0.27 |
|
2 |
S2 |
0.48 |
0.37 |
0.46 |
|
3 |
S3 |
0.32 |
0.33 |
0.26 |
|
4 |
S4 |
0.38 |
0.42 |
0.47 |
|
5 |
S5 |
0.56 |
0.35 |
0.23 |
|
6 |
S6 |
0.44 |
0.53 |
0.45 |
|
7 |
S7 |
0.55 |
0.54 |
0.66 |
|
8 |
S8 |
0.34 |
0.43 |
0.41 |
|
9 |
S9 |
0.46 |
0.52 |
0.42 |
|
10 |
S10 |
0.36 |
0.14 |
0.29 |
|
11 |
S11 |
0.55 |
0.64 |
0.59 |
|
12 |
S12 |
0.42 |
0.63 |
0.54 |
|
13 |
S13 |
0.43 |
0.42 |
0.36 |
|
14 |
S14 |
0.53 |
0.72 |
0.63 |
|
15 |
S15 |
0.45 |
0.37 |
0.28 |
|
16 |
S16 |
0.35 |
0.25 |
0.23 |
|
17 |
S17 |
0.44 |
0.60 |
0.54 |
|
18 |
S18 |
0.42 |
0.49 |
0.40 |
|
19 |
S19 |
0.61 |
0.56 |
0.71 |
|
20 |
S20 |
0.44 |
0.53 |
0.45 |
Figure 10. Correlation coefficients of MFCC for raised pitch, lower pitch, and normal voice
Table 3. SVM classifier detection rate
|
Classifier |
Raised Pitch |
Lower Pitch |
|
SVM Classifier |
77.70% |
59.29% |
Figure 11. SVM classifier detection rate
Figure 11 showns the classification result through the SVM classification techniques, that gives the best result. Plot the result of the raised pitch the classification result is (77.70 %) with the position of the original voice as well as lowered pitch (59.29 %) of voice identification rate. SVM has significantly higher identification rates. This result shows the SVM could be conflicting with some other evaluation relating to SVM. Here the advantage of SVM is shown the above learning algorithms as it has achieved a better accuracy result of 77.70 percent for raised pitch and 59.29 percent for lowered pitch.
In this research work is a progressive process to generate a system to find the hidden speaker’s identity at different physical changes in their voice. This will be done by using different features extraction method of speech like MFCC, delta MFCC, double delta MFCC method. Thus, our research work is to extract some important information from raised and lowered pitch speech signals to identify the speaker of normal voice and other changes of voice tone. It would be shown that the identification of a speaker even if his/her voice changes with different physical conditions. Future studies of this, it would result in the enhancement of the set of data to achieve better diversity for the purpose of training and testing of speakers. The study and analysis of the acoustic features may result in a better system having a higher accuracy rate.
[1] Zhang, C., Tan, T. (2008).Voice disguise and automatic speaker recognition. Elsevier: Science Direct., Forensic Science International, 175(2-3): 118-122. https://doi.org/10.1016/j.forsciint.2007.05.019
[2] Wu, H., Wang, Y., Huang, J. (2014). Identification of electronic disguised voices. IEEE Transactions on Information Forensics and Security, 9(3): 489-500. https://doi.org/10.1109/TIFS.2014.2301912
[3] Wu, H., Wang, Y., Huang, J. (2013). Blind detection of electronically disguised voice. EEE International Conference on Acoustics, Speech and Signal Processing (ICASSP), pp. 3016-3017. https://doi.org/10.1109/ICASSP.2013.6638211
[4] Shridhar, M., Mohankrishnan, N., Baraniecki, M. (1981). Text-independent speaker recognition using orthogonal linear Prediction. International Conference on Acoustics, Speech, and Signal Processing, pp. 197-200. https://doi.org/10.1109/ICASSP.1981.1171129
[5] Ranjan, R., Dubey, R.K. (2016). Isolated word recognition using HMM for Maithili dialect. IEEE, International Conference on Signal Processing and Communication, pp. 32-328. https://doi.org/10.1109/ICSPCom.2016.7980600
[6] Maleki, R.E., Rezaei, A., Bidgoli, B.M. (2009). Comparison of classification methods based on the type of attributes and sample size. Journal of Convergence Information Technology, 4(3): 94-102. https://doi.org/10.4156/jcit.vol4.issue3.14
[7] Grimaldi, M., Cummins, F. (2008). Speaker identification using instantaneous frequencies. IEEE Transactions on Audio, Speech, and Language Processing, 16(6): 1097-1111. https://doi.org/10.1109/TASL.2008.2001109
[8] Seresht, H.R., Ahadi, S.M., Seyedin, S. (2017). Spectro-temporal power spectrum features for noise-robust ASR. Circuits, Systems, and Signal Processing, 36(8): 3222-3242. https://doi.org/10.1007/s00034-016-0434-0
[9] Kajarekar, S.S., Bratt, H., Shriberg, E., De Leon, R. (2006). A study of intentional voice modifications for evading automatic speaker recognition. In Proc. IEEE Int. Workshop Speaker Lang. Recognit. pp. 1-6. https://doi.org/10.1109/ODYSSEY.2006.248123
[10] Reich, A., Moll, K., Curtis, J. (1976). Effects of selected vocal disguises upon Spectrographic speaker identification. Journal of the Acoustical Society of America, 60: 919-925. https://doi.org/org/10.1121/1.381173
[11] Bellet, R., Cochelin, B. (2010). Experimental study oftargeted energy transfer from an acoustic system to anonlinear membrane absorber. Journal of Sound and Vibration, 329(4): 2768 2791. https://doi.org/10.1016/j.jsv.2010.01.029
[12] Rodman, R. (1998). Speaker recognition of disguised voices: A program for research. In Proc. Consortium Speech Technol. Conjunct Conference Speaker Recognition, Man Mach, Direct. Forensic, pp. 9-22.
[13] Gonzalez-Rodriguez, J., Fierrez-Aguilar, J., Ortega-Garcia, J. (2003). Forensic identification reporting using automatic speaker recognition systems. 2003 IEEE International Conference on Acoustics, Speech, and Signal Processing, 2003. Proceedings. (ICASSP '03). https://doi.org/10.1109/ICASSP.2003.1202302
[14] Zhu, X., Beauregard, G., Wyse, L. (2007). Real-time signal estimation from modified short-time Fourier transform magnitude spectra. IEEE Transactions on Audio, Speech, and Language Processing, 15(5): 1645-1653. https://doi.org/10.1109/TASL.2007.899236
[15] Boden, H., Guo, Y., Tözün, H.B. (2006). Experimental investigation of nonlinear acoustic properties for perforates. 12th AIAA/CEAS Aeroacoustics Conference (27th AIAA Aeroacoustics Conference), AIAA, pp. 2006-2404. https://doi.org/10.2514/6.2006-2404
[16] Rudasi, L., Zahorian, S.A. (1991). Text-independent talker identification with neural networks. International Conference on Acoustics, Speech, and Signal Processing, pp. 389-392. https://doi.org/10.1109/ICASSP.1991.150358
[17] Audacity: Recording application software [online] http://audacity.sourceforge.net, accessed on June 12, 2018.
[18] Soong, F.K., Rosenberg, A.E., Rabiner, L.R., Juang, B.H. (1985). A vector quantization approach to speaker recognition. International Conference on Acoustics, Speech, and Signal Processing, pp. 387-390. https://doi.org/10.1109/ICASSP.1985.1168412
[19] Hollien, H. (1990). The Acoustics of Crime: The New Science of Forensic Phonetics. New York: Plenum Press. https://doi.org/10.1007/978-1-4899-0673-1
[20] Tan, T. (2010). The effect of voice disguise on automatic speaker recognition. IEEE Int. CISP, 8: 3538-3541. https://doi.org/10.1109/CISP.2010.5647131
[21] Kajarekar, S.S., Ferrer, L., Shriberg, E., Sonmez, K., Stolcke, A., Venkataraman, A. (2005). SRI’s 2004 NIST speaker recognition evaluation system. IEEE ICASSP, pp. 173-176. https://doi.org/10.1109/ICASSP.2005.1415078
[22] Gonzalez-Rodriguez, J., Ramos-Castro, D., Garcia-Gomar, M., Ortega-Garcia, J., (2004). On robust estimation of likelihood ratios: The ATVs-UPM system at 2003 NFI/TNO forensic evaluation. In Proc. IEEE Int. Workshop Speaker Language Recognition, pp. 1-8.