Ummadi Janardhan Reddy* | Busi Reddy Venkata Ramana Reddy| Bodi Eswara Reddy
© 2019 IIETA. This article is published by IIETA and is licensed under the CC BY 4.0 license (http://creativecommons.org/licenses/by/4.0/).
OPEN ACCESS
Location of lung disease is the most fascinating exploration zone of specialist's in beginning times. The proposed framework is intended to identify lung tumor in early stage in two phases. The proposed framework comprises of numerous means, for example, picture securing, pre-handling, binarization, thresholding, division, feature extraction, and neural system identification. At first Input lung CT pictures to the framework and afterward they went through the picture pre-preprocessing stage by utilizing some picture handling systems. In first stage, Binarization procedure is utilized to change over twofold pictures and after that contrast it with edge incentive with identifying lung tumor growth. In second stage, division is performed to portion the lung CT picture and a solid component extraction technique has been acquainted with removing some critical elements of sectioned pictures. Separated features are utilized to prepare the neural system lastly the framework. The execution of the proposed framework demonstrates acceptable outcomes and proposed technique gives 96.67 % exactness.
pre-processing, binarizotion, segmentation, feature extraction, neural network, lung cancer detection
Lung tumor is one sort of unsafe disease in the world. In consistently a larger number of individuals die as a result of lung disease than some other sorts of tumors for example, bosom, cerebrum, and prostate growths. Lung tumor growth is driving reason for death from tumor among individuals of ages in the vicinity of 45 and 70. There are numerous systems that are utilized to identify lung tumor in critical edge stages, for example, Computed Tomography (CT), Chest Radiography (x-beam), Magnetic Resonance Imaging (MRI output) and Sputum Cytology [1].
In this way, it is an incredible method required for another innovation to identify lung disease in its beginning times. The proposed strategies give a decent quality tools to identify lung tumor in beginning times.
There are two principle reasons for creating lung tumor order techniques in past works [2]. The initial one is to recognize unusual tissues from typical ones, for the most part for irregularity identification, for example, knob location. The second method is to recognize visual examples of a particular lung tumor [3].
In this manuscript, we attempt to accomplish a marginally extraordinary reason: ordering distinctive sorts of CT discoveries of lung tumors under the obliviousness of basic disease. Be that as it may, the connection between's CT discoveries and disease is confounded. On one hand, a same class of CT discoveries could be seen in the pictures relating to various tumors.
We compress Common CT Imaging Signs of Lung Diseases (CISL)s, which are represented in Figure 1 and clarify following. Notice that this scientific categorization is neither finished nor widely acknowledged at display, however these CT signs encountered and generally utilized as a part of the determination of lung tumors [4].
Figure 1. The examples of nine classifications of CISLs
Figure 2. Cancer begining state
Presently a few frameworks are proposed and still huge numbers of them are calculated outline. Simulated Neural Network based Classification and identification arrangement of lung disease [5], this framework is applied and gave poor exactness. PC helped finding in lung radiography [6] has grouped the lung tumor extraction approaches into two distinct classes; either administer based or pixel characterization based classification. Programmed discovery of lung cancer on CT images using a nearby depth extreme calculation [7], it is old model and gives poor location. Creeps can be isolated into two gatherings: depth based and display based methodologies [8]. In some methodologies consistency, availability, and position highlights were removed [9].
Lung Cancer Detection (LCD) utilizing Curve let Transform and Neural Network [10], proposes another strategy for LCD distinguishing proof where curve can remove the highlights of lung tumor CT examine pictures capably. In late year, the most recent research's work is done in the field of lung disease recognition. for example, Automatic Detection of Lung Cancer in CT images [11], Lung Cancer Detection Using BPNN and SVM [12], Size Estimation of Lung Cancer Using image Segmentation and Back Propagation [13], and Gary Coefficient Mass Estimation Based image Segmentation Technique For Lung Cancer Detection Using Gabor Filters [14]. In the wake of studying diverse research works, the goal of proposed framework is to speak to a quick and vigorous framework for recognizing Lung Cancer legitimately in beginning time and our proposed framework give more exactness than numerous other existing procedures [15].
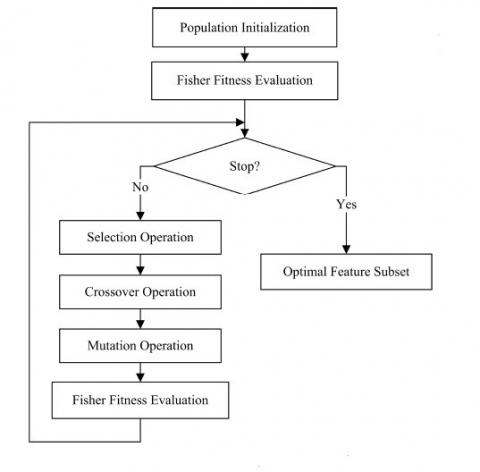
Generally, the component determination issue is to discover the best included subset in the power set of highlights. In this way, it includes two sub-issues: (1) how to assess highlight subset and (2) how to actualize it. For the track calculation, the Genetic Algorithm (GA) is a well known and great decision [16]. Each piece in the string compares to an element, where the esteem 1 shows that the component is chosen and 0 demonstrates that the element is disposed of. Not quite the same as these strategies, we allocate a weight to each component and advance the weights. It is more sensible and more exact for estimating the significance level of a component than the hard estimation of 0 or 1. After the weight development is finished, the component whose weight surpasses an edge is picked as an individual from the ideal element subset [17]. The limit is resolved adaptively as indicated by preparing information [18], as clarified in the last passage of the principal sub-area beneath.
3.1 Fitness function
A sensible goal of highlight choice for design characterization is to boost grouping exactness [19]. The Fisher paradigm measures the separation among every one of the classes and the dissimilarity inside the individuals from each class [20]. In this way it mirrors the order precision under the nonattendance of classifiers.
Let $X^{i,j}=(x_1^{i,j},x_2^{i,j},⋯,x_d^{i,j})$ be the full feature vector of the jth example of the ith class, the mean of feature vectors belonging to the ith class as
${{m}^{i}}=\frac{1}{{{n}_{i}}}\sum\limits_{j=1}^{{{n}_{i}}}{{{X}^{i,j}}}$ (1)
and training examples as
$m=\frac{\sum\limits_{i=1}^{C}{\sum\nolimits_{j=1}^{n{}_{i}}{{{X}^{i,j}}}}}{\sum\nolimits_{i=1}^{C}{{{n}_{i}}}}$ (2)
Suppose the resultant $m^i=(m_1^i,m_2^i,⋯,m_d^i)$, and the resultant W= (W1, W2,….,Wd)
Class ratio for mean is as
${{\text{S}}_{\text{W}}}=\sum\limits_{i=1}^{C}{\frac{1}{n{}_{i}}}\sum\limits_{j=1}^{n{}_{i}}{\sum\nolimits_{k=1}^{d}{{{w}_{k}}{{(\mathop{x}_{k}^{i,j}-\mathop{m}_{k}^{i})}^{2}}}}$ (3)
weighted distance among classes is
${{\text{S}}_{\text{B}}}=\sum\limits_{i=1}^{C}{\sum\nolimits_{k=1}^{d}{{{w}_{k}}{{(\mathop{m}_{k}^{i}-\mathop{m}_{k}^{{}})}^{2}}}}$ (4)
The Fisher criterion is formulated as maximizing SB and minimizing Sw. fitness function for evaluating w is calculated as
$f(w)=\frac{{{S}_{W}}}{{{S}_{B}}}$ (5)
The component subset prompting the best CAR is taken as the last determination result as the relating limit as the ideal one. This last component choice outcome is unaltered in the ensuing grouping stage, regardless of what classifier is utilized.
3.2 Hereditary optimization for feature collection
The Fitness assessment strategy has been introduced in the last sub-area. The subtle elements of different segments are given as takes after.
Our method of perceiving CISLs in (Regions of Interests) ROIs in lung CT pictures comprises of two parts: include extraction and ROI order. Then the ROI is characterized into the comparing CISL classification by using a few classifiers.
4.1 CVH highlights
CVH implies the CT histogram values. In lung CT pictures, the CT estimations of pixels are communicated in HU. We process the histogram of CT esteems over every parameter. The quantity of receptacle in histogram is dictated by tests. Actually, we acquire different CVHs with various quantities of canisters. Every CVH is tried for arrangement in k-NN classifier, and relating (Classification Accuracy Rate) CAR is computed. At that point the quantity of containers, which brings the most elevated CAR, is embraced. This decision will keep unaltered for every one of the tests.
Figure 3. Proposed method architecture
4.2 Dataset
The lung CT pictures were obtained by UCI machine Repository. The cut thickness is 5 mm, the picture determination is 512 × 512, and the pixel dividing ranges from 0.797mm to 1.5mm.
Table 1. ROIs distribution used in the proposed method
|
CISL |
S1 |
S2 |
S3 |
S4 |
S5 |
Total |
NoP |
|
GGP |
9 |
9 |
9 |
9 |
9 |
45 |
25 |
|
lobulation |
9 |
8 |
8 |
8 |
8 |
41 |
21 |
|
calcification |
10 |
109 |
9 |
9 |
9 |
47 |
20 |
|
CV |
30 |
30 |
29 |
29 |
29 |
147 |
75 |
|
spiculation |
6 |
6 |
6 |
6 |
5 |
29 |
18 |
|
PI |
16 |
16 |
16 |
16 |
16 |
80 |
26 |
|
AB |
5 |
5 |
5 |
4 |
4 |
23 |
22 |
|
BMP |
17 |
16 |
16 |
16 |
16 |
81 |
29 |
|
OP |
4 |
4 |
4 |
3 |
3 |
18 |
16 |
|
Total |
106 |
104 |
102 |
100 |
99 |
511 |
252 |
4.3 Feature extraction
After the division is played out, the sectioned lung part is utilized for include extraction. A component is a critical snippet of data extricated from a picture which gives more point by point comprehension of the picture. The highlights like geometric and force related factual highlights are extracted.
Area: The region is gotten by the summing up of zones of pixel in picture that is enrolled as 1 in the twofold picture acquired [12].
A=n{1}
Here n speaks to the check of count of the example inside the wavy sections.
Perimeter: The border extent is the quantity of pixels in limit of the question. Edge P is estimated as the whole of the separations between each back to back limit point [13]. Scientifically,
$P=|s_n s_1 |+∑_{i=1}^{n-1}|s_i s_{i+1}|$
where, s={s1,… ,s n} is an arrangement of the limit focuses.
Peculiarity: The unconventionality is the proportion of the distance between the foci of the circle and its real pivot length. The esteem is in the vicinity of 0 and 1.
Entropy: the factual computation of arbitrariness that can be utilized to portray the surface of the info picture.
Entropy = p(i, j)log p(i, j)
where, p is the quantity of dim level co-event networks in GLCM.
Contrast: Calculates the nearby varieties in the GLCM. It computes power differentiate among pixel and neighbor pixel for entire picture. Differentiation is 0 for a consistent picture.
Complexity =p(i-j)/ p(i, j)
Association: Computes the joint likelihood event of the predetermined pixel sets.
$Correlation=(∑_{i=0}^{G-1}∑_{i=0}^{G-1}(i-μ_1)(j-μ_j)p(i,j))/(σ_i σ_j )$
4.4 Methods for classification
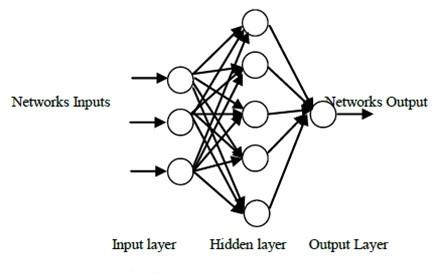
Grouping is the last advancement of assurance of ailment phases to have lung disease knob or not of patient lung. Counterfeit neural system (CNS) is the grouping strategies utilized as a part of picture handling techniques.
Figure 4. Architecture of FNN
To prepare the Fuzzy neural system removed highlights are utilized. The proposed framework is composed with the end goal that it can identify which lung is influenced left lung or right lung particularly. In positive examples (dangerous Left lung) are prepared by just 0, 1 and negative examples (Non malignant Left lung) by something else. In positive examples (dangerous Right lung) are prepared by just 1, 0 and negative examples (Non destructive Right lung) by something else. The framework utilized 20 kinds of lung CT pictures to prepare up the system with the goal that the framework identifies the lung disease precisely. The framework characterizes the destructive and non malignant CT check pictures subsequent to preparing stage and indicated what lung is influenced (Right lung or Left lung). Lastly the framework is tried any positive and negative examples and it gives capable outcomes.
The aftereffect of the proposed framework is performing by two ways: Binarization Technique and Fuzzy Neural Network
1) Binarization Technique: It give 99 % (approx.) remedy result for this framework.
2) Neural Network: The exploratory consequences of the framework are given Table 2.
Table 2. Disease identification rate
5.1 Compare to the existing system
The proposed framework presents a parallel thresholding technique, solid component extraction technique and contrast with other existing framework and accomplish better execution for Lung Cancer Detection (LCD) framework. The proposed framework gives more exact outcome look at than other existing framework appeared in the accompanying Table 3.
The shrouded layers exhibit 20 layers. Exchange work is utilized log-sigmoid which is more appropriate than other exchange work for this examination. The methods contain four pictures for organize 1, stage2, stage3 and arrange 4. The removed highlights for prepare pictures portray in Table.4.
Table 3. Existing system comparison
|
Lung Cancer Detection System |
Accuracy (%) |
|
Lung Cancer Detection using Curvelet Transform and Neural Netword |
90 % |
|
Automatic Detection of Lung Cancer in CT Images |
96 % |
|
Early Detection and Predicition of Lung Cancer Survival using Neural Network Classifier |
96.04 % |
|
Gray Coefficient Mass Estimation Based Image Segmentation Technique for Lung Cancer Detection Using Gabor Filters |
83 % |
|
Identifying Lung Cancer Using Image Processing Techniques |
80 % |
|
Proposed System |
96.67 % |
Table 4. Neural network training
|
|
Stage1 |
Stage2 |
Stage3 |
Stage4 |
|
Area |
206 |
341 |
491 |
608 |
|
Perimeter |
54.2843 |
77.5980 |
94.5269 |
109.0122 |
|
Eccentricity |
0.7270 |
0.6897 |
0.7909 |
0.9225 |
|
Entropy |
0.0092379 |
0.014346 |
0.01967 |
0.023641 |
|
Contrast |
0.005 |
0.0101 |
0.0131 |
0.0165 |
|
Correlation |
0.9271 |
0.9207 |
0.9286 |
0.9275 |
|
Energy |
0.9983 |
0.9972 |
0.9960 |
0.9950 |
|
Homggeneity |
0.9999 |
0.9998 |
0.9998 |
0.9997 |
Figure 5. Displaying of result
Lung tumor is one sort of unsafe disease, so it is important to recognize at beginning times. Be that as it may, the location of lung tumor is most troublesome undertaking. Numerous methods are utilized for the recognition of lung disease however they have a few impediments. In our proposed strategy pursue approaches in which initial step is parallel thresholding, and then feature extraction, and after that these highlights are utilized to prepare up the fuzzy neural system and test the neural system with machine learning approaches. The proposed framework effectively identifies the lung disease from CT scan images. Toward the end of the framework it can be stated that the framework accomplishes its coveted desire. The proposed framework test 150 kinds of lung CT pictures and gets the outcome where general achievement rate of the framework is 96.67 % which meet the desire of framework. In future this strategy can be utilized as a part of the discovery of mind tumor, bosom growth and so on. The death rate of lung tumor is the most extreme among every other sort of growth. In this paper, picture preprocessing and picture division are executed to acquire the diagnosis result. By utilizing these means, the tumor parts are detected and a few highlights are extricated. The extricated highlights are figured for arrangement of disease stages. This strategy facilitates the radiologists and specialists by giving more data and taking right choice for lung tumor persistent in brief time with exactness. In this manner, this strategy isn't costly and few tedious.
[1] Non-Small Cell Lung Cancer. (2013). [online available], http://www.katemacintyrefoundation.org, Adapted from National Cancer Institute (NCI) and Patients Living with Cancer (PLWC), 2007, accessed on 13 July. https://doi.org/10.1109/HPCSim.2016.7568393
[2] Anatomy of lung picture and beginning of cancer. (2013) [online available], www.allreferhealth.com, accessed on 4 June. https://doi.org/10.1016/j.csi.2016.02.002
[3] Amutha A, Wahidabanu RSD. (2012). A novel method for lung tumor diagnosis and segmentation using level set- active contour modelling. European Journal of Scientific Research 90(2): 175-187. https://doi.org/https://doi.org/10.1145/3075564.3078884
[4] Mokhled S, Al-Tarawneh. (2012). Lung cancer detection using image processing techniques. Journal of Practices and Technologies (20): 147-158. https://doi.org/10.1504/IJNDC.2017.083642.
[5] Sudha V, Jayashree P. (2012). Lung nodule detection in CT images using thresholding and morphological operations. International Journal of Emerging Science and Engineering (IJESE) 1(2). https://doi.org/10.1504/IJIT.2018.090859.
[6] Pratt WK. (1991). Digital image processing. New York, John Wiley & Sons, Inc. 634. https://doi.org/10.1504/IJICA.2016.078727.
[7] Haralick RM. (1979). Statistical and structural approaches to texture. Proceedings of the IEEE 67: 786-804. https://doi.org/10.1504/IJIDS.2016.075789.
[8] Haralick RM, Shapiro LG. (1992). Computer and Robot Vision. Addison-Wesley 1: 459. https://doi.org/10.1504/IJICT.2016.079962.
[9] Mark HB, Martin TH, Demuth HB. (2014). Neural Network Toolbox™ User‟s Guide. Ra Matlab, MathWorks, Inc. https://doi.org/10.1504/IJFCM.2017.089439.
[10] Bhat G, Biradar VG, Nalini HS. (2012). Artificial neural network based cancer cell classification (ANN - C3). Computer Engineering and Intelligent Systems 3(2): https://doi.org/10.1504/IJACT.2012.045589.
[11] Lin D, Van C. (2002): Lung nodules identification rules extraction with neural fuzzy network. IEEE, Neural Information Processing 4(3): 248-260. https://doi.org/10.1504/IJAIP.2018.090789
[12] Zhao B, Gamsu G, Ginsberg MS, Jiang L, Schwartz LH. (2003). Automatic detection of small lung nodules on CT utilizing a local density maximum algorithm. Journal of applied clinical medical physics 4. https://doi.org/10.1120/jacmp.v4i3.2522
[13] Kaur G, Singh H. (2014). Lung cancer detection using BPNN and SVM. International Journal of Latest Scientific Research and Technology. 1(2): 95-98.
[14] Sharma N, Sheenam. (2014). Size estimation of lung cancer using image segmentation and back propagation. International Journal for Research in Technological Studies 1(9): 14-17. https://doi.org/10.1504/IJAHUC.2017.085129.
[15] Battista G, Sassi C, Zompatori M, Palmarini D, Canini R. (2003). Ground-glass opacity: interpretation of high resolution CT findings. LaRadiologiaMedica 106: 425-442.
[16] Yang ZG, Song S, Talcashima S. (2001). High-resolution CT analysis of small lung adenocarcinoma revealed on screening helical CT. Am. J.Roentgenol 176(6): 1399-1407. https://doi.org/10.1186/s13677-015-0037-5.
[17] Nuzhnaya T, Megalooikonomou V, Ling H, Kohn M, Steiner R. (2011). Classification of texture patterns in CT lung imaging. Proc Spie 7963(1): 108-108. https://doi.org/10.1117/12.877889
[18] Mehrdad JG, Lauge S, Saher BS, Kamel MS, Bruijne DM. (2011). Multiple classifier system in Texton-based approach for the classification of CT images of lung. Medical Computer Vision 6533: 153-163. https://doi.org/ 10.1007/978-3-642-18421-5_15
[19] Nithya R, Santhi B. (2011): Mammogram classification using maximum difference feature selection method. Journal of Theoretical and AppliedInformation Technology 33(2): 197-204,.
[20] Li S, Liu XB, Yang A, Pang KP, Zhou CW, Zhao XM, Zhao YF. (2013). A novel approach of computer-aided detection of focal ground-glass opacity in 2D lung CT images. SPIE - The International Society for Optical Engineering 8670-8677. https://doi.org/10.1117/12.200359