Hussain F. Jaafar*![]() | Mahmoud Shaker
| Mahmoud Shaker![]() | Hayder Mahdi Abdulridha
| Hayder Mahdi Abdulridha![]() | Akram Jaddoa Khalaf
| Akram Jaddoa Khalaf![]()
© 2024 The authors. This article is published by IIETA and is licensed under the CC BY 4.0 license (http://creativecommons.org/licenses/by/4.0/).
OPEN ACCESS
Detection and grading of diabetic retinopathy in the at-risk population (diabetics) is crucial for providing timely treatment thereby preventing visual loss. On the basis of the most common systems, such as the National Health Service's (NHS) Program, the Scottish Grading Scheme (SGS), and the Early Treatment Diabetic Retinopathy System (ETDRS), we establish a novel automated diabetic retinopathy grading system. Medical criteria based on information from all these systems are used to grade the severity of diabetic retinopathy by calculating numbers and sizes of detected abnormalities throughout specified fields around the fovea (center of vision). The main purpose of this work is to develop a new automated diabetic retinopathy grading system based on medical systems, namely NHS program, SGS, ETDRS, and EyePACS protocol. The proposed system achieved overall success rate of 98.8% for a set of 50 images from Messidor Database and 98.4% when we use the set of 80 images from DIARETDB1. The results of the proposed system have been compared with the other existing systems in the literature and shows higher values of the overall success rate. These results assure that this system could be used for a computer-aided mass detection and grading of diabetic retinopathy as part of an automatic, fast, and accurate screening regime.
retinal image processing, diabetic retinopathy, grading of diabetic retinopathy, fovea coordinate system, Scottish grading scheme, Early Treatment Diabetic Retinopathy System
The main reason for blindness among working people in the United States and the European Union is diabetic retinopathy (DR). In order to assess the lesion severity and then to allow doctors taking appropriate decision depending on the severity grade, the grading of distinct retinal lesions due to DR is of utmost relevance. Ophthalmologists typically undertake this labor-intensive and time-consuming procedure manually from retinal fundus photos.
Computer-assisted lesion grading from retinal fundus images will provide prompt, precise, and consistent diagnosis. The major goal of this study is to provide an automated system for grading the severity of discovered abnormalities as a component of a medical screening program.
Plans must be put in place as part of a screening program to ensure that patients with ungradable photographs receive an ophthalmologist examination. A disease that will not be improved with treatment in either eye means that certain patients with ungradable images might not be candidates for treatment.
The patient gets graded for their entire condition in two stages: per the NHS Program [1], and depending on two status grades. According to arbitration level, these two status grades are: no retinopathy or proliferative diabetic retinopathy. Annual rescreening, local arbitration judgment, referral to eye clinic and level grading are the next steps. Ophthalmologists use the Scottish Grading Scheme (SGS) [2], where diabetic maculopathy (DM) is divided into three categories (M0, M1, and M2), while the DR is divided into five grades (R0, ..., R4).
According to the lesion type and location, with respect to the fovea and optic disk (OD), many grading systems have been developed by numerous working groups discussing the DR grading. It should be emphasized that there aren't many distinctions between these systems, and they have all based their models on clinical modification to the Early Treatment Diabetic Retinopathy Study (ETDRS) [3]. Intraregional microvasculature abnormalities (IRMA), soft exudates (SEs), hard exudates (HEs), red lesions (RLS), microaneurysms (MAs), hemorrhages (HRs), new vessels on the disc (NVD), new vessels elsewhere (NVE), and venous beading (VB) are the most common types of discrete lesions. The presence and severity level of these common DR lesions are assessed in the grading protocol of the EyePACS [4]. The severity levels of the retinal lesions are processed by this protocol's algorithm as: Overall retinopathy severity level and severity level of macular edema.
In evaluating images from 335 actual screening encounters, Grzybowski et al. [5] compared the accuracy and consistency of three retinal specialists without any additional training in DR grading. They also compared their results to those of IDx-DR, a DR screening tool that has been confirmed using US food and drug administration. Before evaluating DR screening photos, they advised intensive training and verification for any possible DR graders.
Raumviboonsuk et al. [6] have used deep learning algorithms to detect DR with specialist-level accuracy. A total of 25,326 diabetic patients' gradable retinal pictures from Thailand's community-based, national DR screening program were examined for the presence of referable diabetic macular edema (DME). Deep learning considerably decreased the false negative rate by 23% across various DR severity levels for determining referable disease, albeit at the expense of higher false positives in about 2%. Deep learning techniques could be a useful tool for DR screening.
The importance of identifying severity levels and the existence of DR were examined by Wang et al. [7]. By analyzing inter-grader variability, the advantage of the observation in the DR grading process is first examined. The performance of DR severity prediction, utilizing various annotation techniques, is then examined using logistic regression. The practicality of assessing DR features is examined in light of the comparative results. The accuracy and kappa values for the severity of DR at the upper limit are 95.6% and 0.962, respectively. In practical applications for DR grading and severity prediction, accuracy of 91.2% and kappa of 0.905 are possible when cosine similarity of DR feature prediction of DR reaches 0.823.
The Diabetic Macular Oedema Severity Scale, the International Clinical DR and the UK's National Screening Committee standards were used to assess the proposed grading system by Al-Turk et al. [8] against photographs. Large datasets gathered from three distinct countries were subjected to external review. On a DR referable level, sensitivity (91.2–94.2.0%) did not significantly differ amongst DR grading methods, and all picture sets had excellent specificity values above 93%.
Six allied medical personnel (AMP) were utilized by Thapa et al. [9] to grade fundus pictures of diabetic patients in two separated training periods, i.e. three and six months. The intra-rater and inter-rater agreement are evaluated using the kappa coefficient. It was found that grading any retinal abnormalities in half of the AMPs at three and six months was practically flawless. The average inter-rater agreement at the next evaluation after three months was reasonable for the HEs k=0.35, and temperate for the other different abnormalities and they got k=0.60, k=0.48, and k=0.38.
Overall severity level of retinopathy could be determined by detection and grading of DR in International Clinical Diabetic Retinopathy Disease Severity Scale (ICDRS) [10] and the procedure that is described in the ETDRS. The EyePACS severity levels describe DR grades in three non-proliferative DR (i.e. mild, moderate, and severe) and one proliferative DR. The surrogate lesion of HEs, which is typically connected to nearby retinal thickness and is indicative of the existence of macular edema, is used to grade macular edema. From our research, we learned that the majority of screening programs, such as the NHS project in the UK are following the most recent grading scheme that provides the Scottish screening program for DR, as described in the study [2]. This scheme is based on the foveal coordinate system (FCS), which was defined by the ETDRS research group.
Red lesions (RLs), which are frequently the first outward indications of DR, are the main focus of DR screening while hard and soft exudates have also been shown to be beneficial. The grading of DR is much more difficult and complicated than the detection stage, requiring the detection of additional types of lesions, such as IRMA, NVD, NVE, and VB with a greater variety of scales and shapes, according to the ICDRS.
Most current grading systems are based on classification of retinal lesions which track the presence and sizes of abnormalities irrespective of their locations with reference to the macular center, i.e. the fovea (center of vision). According to the ETDRS, location of retinal lesions is important when grading retinopathy and maculopathy. Hence, our grading model endeavors to address the limitations of current works by computing numbers and sizes of retinal lesions and track their spatial distribution over the FCS fields.
The results reported by many studies suggest that automated grading of DR can reduce the workload and then the cost of DR grading image. The work described in Li et al. [11] proved that the cost of automated-based DR grading is much less than that of ophthalmologist screening. A comparison in numbers shows that the cost of ophthalmologist screening was higher, where the incremental cost was approximately 2,070.19 US dollars, and the effect was worse.
In this work we have endeavored to develop a new automated diabetic retinopathy grading system. The medical systems, such as NHS program, ETDRS, SGS, EyePACS protocol, and ICDRS are used as the basis for our system design. Medical criteria based on information from all these systems are used to grade the severity of DR by calculating numbers and sizes of detected abnormalities throughout the fields of the proposed system. In the proposed model, the retina is sub-divided into ten fields in accordance to the description and information of the ETDRS, where the fovea is used as the center of the proposed FCS model.
The novelty of our proposed system is attributed to the precise interpreting and modeling the medical information of the ETDRS and hence to achieve superior performance compared to the recent related works.
This paper is arranged as follows: Different types of retinal lesions and a literature of some related works are presented in Section 2. The proposed fovea coordinate system is described in Sec. 3. Section 4 introduces important details about the grades of retinopathy and maculopathy in accordance to the medical systems. Results and discussions are presented in Section 5, and the conclusions are presented in Section 6.
Automated grading of DR requires the detection of all types of abnormalities, namely, SEs, HEs, RLs, MAs, HRs, IRMA, NVD, NVE, and VB. For the detection of HEs we modified and used the proposed method that is explained in details in Jaafar et al. [12] to achieve better performance results. In this method, two-step for HEs segmentation was adopted and it was built based on the foundation of coarse and fine HEs segmentation. To create the local variation image through coarse segmentation, the standard deviation for each abnormal region was calculated.
Next, an automatic threshold was applied and after that morphological dilation with a small structuring element was used to make sure that all bright objects with distinct boundaries are present in the coarse HEs result. Then, using a classification process based on a few chosen features, actual HEs were identified and fake items were excluded. For refining the coarse HEs results, region-based segmentation was investigated, i.e. split-and-merge and pure-splitting segmentation and the performance results showed that the second one is more efficient for the detection of HEs.
In the SEs detection, the method proposed by Kavitha et al. [13] was employed, where the histogram information of the color image was used to detect HEs and SEs from the retinal image. Then the HEs image detected in the study [12] is subtracted from the resulting image of this method leaving it with only SEs. Detection of RLs (Both MAs and HRs) were detected using the method proposed by Niemeijer et al. [14]. This method is based on classification of pixels to distinguish the pixels of vasculature and RLs from those of the background. To distinguish RLs from the connected vasculature, a k-nearest neighbour classifier has been used. In spite of the large number of spurious candidates, this system is adjusted to attain maximum sensitivity.
Qomariah et al. [15] have developed a novel approach for segmentation of microaneurysms. This approach is based on deep learning network that could modify UNet by the mean of residual units with modified identify mapping (MResUNet). The experimental results for the design of MResUNet show sensitivity of 61.96% and 85.87% at the datasets of IDRID and DIARETDB1 respectively. The performance of this approach is still lower than those of the existing related works.
Automated method for grading of VB has been investigated by Gregson et al. [16]. In this approach, the rough silhouette of the vein is extracted by thresholding followed by morphological closing and thinning to find vein centerlines. Then each centerline is partitioned into fixed-length segments and their diameters are measured as a function of distance along each segment with the aid of the local centerline orientations. A VB index is calculated from the distortion of vein diameter components.
Abnormalities related to IRMA, NVE, and NVD are detected based on vasculature information, i.e. on existing features. Thus, their abnormalities could not be graded with one stage test because the detection result of any of these is based on a comparison of two-stage tests to find out new vessels on the disc or elsewhere.
A description of the spatial locations of identified lesions, in addition to their sizes and quantities, can offer a more accurate assessment of clinical risk. In order to determine the severity grade of lesions without arduous and time-consuming techniques, ophthalmologists typically employ a polar coordinate system that uses the fovea or OD as the center of this system.
All photoreceptive cells, namely rods and cones are located at the center of macula which is named a fovea, the fovea is then considered as the center of vision [3]. Consequently, we use it as the center of our proposed FCS model to determine the severity of lesions on the eye vision.
The idea of FCS is inspired from traditional polar coordinate system, where each pixel within the regions of detected lesion is determined in terms of angle and distance. Consequently, all pixels of lesions could be easily located and calculated with respect to the ten fields of FCS based on the prior information of FCS.
In the proposed FCS model, the retina is segmented to ten fields in accordance to the description and information of the ETDRS, as illustrated in Figure 1. Three circles with radii DD/3, 1DD and 2DD (where DD is the diameter of the OD) are employed as the center of the fovea. Each of the two larger circles is divided into four fields using four coordinates. Since the OD center is situated at a distance of 2DD from the fovea the FCS outer circle crosses the OD.
Following to the lesion detection, the distributions of lesion blots are estimated over the FCS fields to determine the extent of visual damage, with the degree of injury increasing as the lesions get closer to the center. The total area of lesions distributed among the FCS fields serves as the results of this step and will then be assessed for an appropriate clinical outcome and then a clinician decision.
Figure 1. Proposed foveal coordinate system
We utilized the SGS's retinopathy and maculopathy grading data to develop our automated grading system because of its popularity and acceptability. According to the SGS, the severity grade of all types of lesions can be determined by its existing features, i.e. the grading of DR is feature-based. This system categorizes retinopathy into five stages depending on types and locations of different lesions and where they are located in relation to the fovea center, while diabetic maculopathy (DM) is split into three grades based on the kind of lesion present and where it is located in relation to the fovea center. According to the SGS, the grades of retinopathy and maculopathy can be summarized as shown in Tables 1 and 2.
To assign retinopathy grades from the schedule of retinopathy, automated grading can be used to determine the existence and location of several eye conditions. These conditions are; VB which is a fluctuation in the diameter of the blood vessels and RLs which are caused by blood leakage from tiny blood vessels.
According to this scheme (SGS), it is important to note that the HEs with all sizes and any distribution cannot be a reason for more than R1, while the RLs and abnormal blood vessels can be the cause of DR up to proliferative retinopathy (R4) depending on their sizes and spatial distribution throughout the FCS. Moreover, any of the RLs and the HEs can be the reason for all stages of DM depending on the size and proximity to the fovea.
In this scheme, the grades ‘observable’ and ‘referable’ are replaced in other protocols, e.g. EyePACS by 'moderate' and 'severe' respectively. Our proposed system for DR severity assessment is based on DR severity principles described in the SGS and image division into different sensitive fields explained in the ETDRS. First and foremost, the relationships between various diseases, their numbers, spatial distributions, and the relevant medical action are approximated and summarized in order to translate medical concepts of SGS into numerical information, as indicated in Table 3. To automatically grade the severity of DR and DM caused by different eye diseases, the following steps are proposed:
In implementing the detection methods, all types of abnormalities are detected and calculated in terms of pixels. The step 2 involved calculating the lesion distribution in terms of area to prevent an issue brought on by variations in picture resolution for different datasets.
In this work, we have attempted to computationally apply the hypothesis that the severity grade of retinal lesions depends on their spatial distribution over the FCS fields in addition to their numbers and sizes. Two set of 130 photos were used to test our grading system after system preparation (a set of 50 images from the Messidor Dataset and a set of 80 images from the DIARETDB1).
The performance of the proposed system was assessed using detection results of HEs and RLs with respect to the sensitivity (SE), specificity (SP), and accuracy (ACC). These results were assessed quantitatively by comparing the binary results of the proposed method with those of the expert hand-labeled images. In pixel-based calculations, the overall success rate for SE, SP, and ACC was 98.8% with the set of Messidor Dataset, while it was 98.4 with the set of DIARETDB1.
A comparison against some recent related works is illustrated in the Table 4. The information of the performance measures, in this table, shows that the SE, SP and ACC for dection of HEs achieved by the proposed method are better than those achieved by the existing related works. The superior performance of lesion detection resulted from the proposed method is vital to ensure better grading results compared to the existing grading systems.
Following the discovery of HEs and RLs, the distributions of both HEs and RLs in the FCS fields, severity of DR and DM, and the best course of treatment are calculated for the outcomes, i.e. the results of the proposed technique and the hand-labeled are identical. The retinopathy grade R5 was not investigated in our automated grading because it relates to manual grading. Manual grading is used when the retina clarity is insufficient and an alternate manual screening is then made.
Table 1. Diabetic retinopathy grades, description, features, and medical report [2]
|
Retinopathy |
Description |
Features |
Medical Report |
|
R0 |
No DR |
No existence of any type of lesions |
Rescreening after 1 year |
|
R1 (mild) |
Mild DR |
Existence of very few blots of any lesion type anywhere throughout the FCS fields |
Rescreening after 6 months |
|
R2 (observable) |
Observable DR |
Existence of many vitreous RLs spots distributed in the outer FCS fields |
Rescreening after 6 months or referring to ophthalmology |
|
R3 (referable) |
Referable DR |
Existence of any of these abnormalities: • Many RLs pots in both outer and inner fields of FCS • Venous beading |
Keeping under surveillance |
|
R4 (proliferative) |
Proliferative DR |
Existence of any of these abnormalities: • Active new vessels • Vitreous RLs • IRMA |
Medical intervention, such as Laser treatment |
Table 2. Diabetic maculopathy grades, description, features, and medical report [2]
|
Maculopathy |
Description |
Features |
Medical Report |
|
M0 |
No DM |
No existence of any type of lesions |
Rescreening after 1 year |
|
M1 |
Observable DM |
Existence of any type of lesions located in the outer fields of FCS |
Rescreening after 6 months or referring to ophthalmology |
|
M2 |
Referable DM |
Existence of any of the following lesions in the inner fields and center of the FCS: • Any blot of RLs • Any blot of HEs |
Keeping under surveillance |
Table 3. Decisions of medical reports for various retinopathy-maculopathy grades [2]
|
Retinopathy |
Maculopathy |
Medical Report |
|
R0 |
M0 |
Rescreening after 1 year |
|
R1 |
M0 |
Rescreening after 6 months |
|
R1 |
M1 |
Rescreeninf after 6 months or referring to ophthalmology |
|
R2 or R3 |
M1 |
Refering to ophthalmology or keeping under surveillance |
|
R1, R2 or R3 |
M2 |
Keeping under surveillance |
|
R4 |
Any |
Medical treatment |
Table 4. Comparison between the proposed method and previous related works with respect to performances of detection of HEs
|
Author |
Datasets |
Performance |
|
SE% SP% ACC% |
||
|
Fraz et al. (2017) [17] |
DIABRETDB1, Messidor and e-Ophtha |
92.4 81.2 87 |
|
Long et al (2019) [18] |
DIABRETDB1 |
97.5 97.8 97.7 |
|
Verma and Yadav (2019) [19] |
DIABRETDB1 |
95 96 97 |
|
Al-Sariera et al. (2020) [20] |
DIABRETDB1 |
86.9 94.8 93 |
|
Kaur et al. (2023) [21] |
DIABRETDB1, and Messidor |
95.3 98.6 98 |
|
Proposed Method |
DIABRETDB1 |
97.4 98.5 98. 6 |
|
Proposed Method |
Messidor |
97.8 98.9 98.8 |
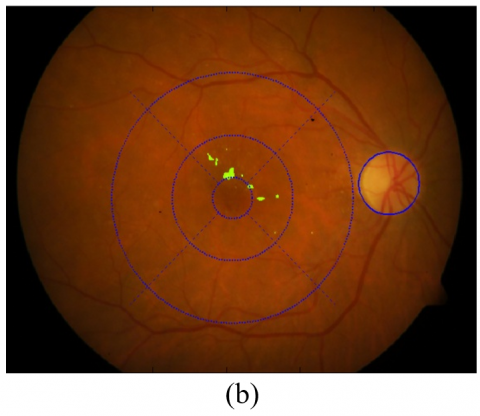
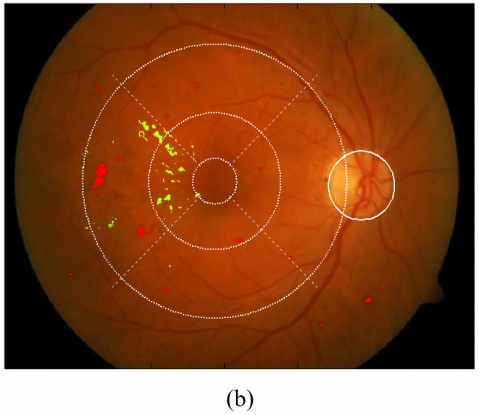
In Figure 2, Figure 3, and Table 5 we demonstrate two examples of retinal images with their detection and grading results by the proposed system for the HEs and RLs to highlight the significance of the grading process. By looking at both detection results, we can easily notice that the number and size of lesions in example 1 appear greater than those in example 2. Anyhow, a closer look to the grading reports (in Table 5) reveals that although the lesions of example 1 are larger and more than those of example 2, the lesions of example 2 are more detrimental to the eye seeing and more urgently to treatment. The reason of this contrast is that the lesions in example 2 are very close to the fovea.
Figure 4 displays two images with their grading findings, and it shows that the total sizes of HEs and RLs in the second retina are clearly bigger than those of the first retina and are located similarly close to the fovea. Anyhow, the severity grades and medical reports based on the SGS are the same for both images as illustrated in Tables 6 and 7. These tables show spatial distributions of HEs and RLs on the FCS fields and the medical reports for both images. These medical reports emphasize that the severity grade of lesions in a retina is influenced by their spatial distributions in the fields of FCS as well as their sizes and numbers.
Figure 2. Example 1, (a) original color retinal image 1, (b) detected RLs and HEs overlaid on the original color image with the fields of FCS
Figure 3. Example 2, (a) original color retinal image 2, (b) detected RLs and HEs overlaid on the original color image with the fields of FCS
Table 5. A comparison between two grading results for two retinal images with respect to their DR and DM grades
|
Example |
Retinopathy |
Maculopathy |
Medical Report |
|
1 |
R1 |
M1 |
Referring to ophthalmology |
|
2 |
R1 |
M2 |
Keeping under surveillance |
These medical reports of the example in Figure 4 (shown in Tables 6 and 7) demonstrate that the proposed grading model can effectively translate medical grading expertise. Therefore, this model can offer very efficient and fast approach to compute the severity grade of DR lesions with very low complexity burden.
To emphasize the feasibility of the proposed system, five samples of retinal images were used in this work to demonstrate comparisons between the proposed system results and the expert hand-labeled results (ground truth). In Figure 5 the results of RLs and HEs are superimposed on the original images by both the proposed method and the hand-labeled approach. The detection results of HEs and RLs to these samples are calculated with respect to the FCS to grade both DR and DM. Table 8 shows the DR and DM grading results and the appropriate medical reports for both the proposed method and the ground truth. A comparison between DR grades, DM grades, and the medical reports of both proposed system and ground truth results shows similarity in their outcomes for the 5 samples.
To ensure precise performance results in the detection of HEs and RLs, our proposed method has adopted pixel-based calculations in determining the performance measures. However, resolutions of various datasets are mostly different and hence, to avoid problems in grading of detected lesions due to variant datasets, we calculated the distribution of both lesion types in terms of area. The typical retinal diameter (22 mm) given in medical publications such as, Wilkinson et al. [22], the retinal area cannot be used since it assumes a flat disc shape while the retina is concave. To remedy this problem, the area of localized OD and its relation with retinal area to compute the real area of the retina because the OD area is relatively small in comparison to retinal size and they have similar ratios for different retinas. After removing the dark surrounding backdrop, the ratio between the number of pixels in the lesion blots and the number of pixels in the retina can be used to compute the real areas of the blots.
Additionally, blots with an area smaller than 0.05 mm2 are ignored and omitted from the grading process in order to prevent imprecise grading caused by extremely small false positives in the detection operations. In medical decision of SGS, two optional medical reports are adopted as:
Figure 4. Grading of DR and DM, (a) original image of example 1, (b) detected lesions and FCS overlaid on the original image 1, (c) original image of example 2, (d) detected lesions with FCS overlaid on the original image 2
Figure 5. Five examples for detection and grading of HEs and RLs, (a) five color images, (b) achieved RLs and HEs overlaid on the color images with FCS, (c) expert hand-labelled results of RLs and HEs overlaid on the original images indicating distribution of lesions on the fields of FCS.
Table 6. Spatial distribution of both Hard Exudates and red lesions, grading of DR and DM, and the medical decision for the image of example 1 (the numbers under FCS fields mean the area of lesions in mm2)
|
Lesion Type |
Center |
Inner Fields |
Outer Fields |
Far Temporal |
DR |
DM |
Report |
|
Hard Exudates |
0.0663 |
0.9529 |
0.3879 |
0.0564 |
1 |
2 |
Keeping under surveillance |
|
Red Lesions |
0 |
0.2651 |
0.7903 |
0.0850 |
2 |
2 |
Table 7. Spatial distribution of both Hard Exudates and red lesions, grading of DR and DM, and the medical decision for the image of example 2 (the numbers under the FCS fields mean the area of lesions in mm2)
|
Lesion type |
Center |
Inner Fields |
Outer Fields |
Far Temporal |
DR |
DM |
Report |
|
Hard Exudates |
0.0760 |
1.1198 |
2.8348 |
0.1974 |
1 |
2 |
Keeping under surveillance |
|
Red lesions |
0 |
0.1900 |
0.3775 |
0.9955 |
2 |
2 |
Table 8. Grading outcome by the proposed system using both results of the proposed methods for HEs and RLs and their ground truth images (for the images in Figure 5)
|
Image |
Proposed Method |
Medical Report |
Ground Truth |
Medical Report |
|
DR DM |
DR DM |
|||
|
1 |
R2 M2 |
Kept under surveillance |
R2 M2 |
Kept under surveillance |
|
2 |
R1 M1 |
Refer to ophthalmology |
R1 M1 |
Refer to ophthalmology |
|
3 |
R1 M2 |
Kept under surveillance |
R1 M2 |
Kept under surveillance |
|
4 |
R2 M2 |
Kept under surveillance |
R2 M2 |
Kept under surveillance |
|
5 |
R1 M2 |
Kept under surveillance |
R1 M2 |
Kept under surveillance |
In this study, we aimed to computationally implement and demonstrate that the severity grade of lesions in the retina does not depend only on the numbers and sizes of lesions’ blots, but also on how they are distributed spatially over the FCS fields. Due to differences in danger grade on the vision between different lesions, automated grading of DR and DM, which is based on accurate calculations it terms of pixels, outperforms the manual grading process, which is based on human experience.
The presented detection and grading results, when cited by an expert, demonstrate that the proposed detection and grading system offers effective screening programs to safely reduce the manual grading burden. The ability of this approach to effectively translate medical grading expertise and the outcomes of earlier lesion detection studies into computer-aided DR and DM grading is credited with its uniqueness.
The fact that this model was tested using only two types of lesions is a drawback, as more lesions linked to DR and DM should be included for a thorough performance evaluation. This limition could be fixed by investigation more types of retinal lesions, such as NVD, NVE, and VB.
The authors would like to thank the Center of Mathematical Morphology, Mines Paris Tech. and the University of Kuopio-Finland for their cooperation in providing retinal databases, namely the Messidor and the DIARETDB1.
[1] PHE. (2018). NHS diabetic eye screening programme overview of patient pathway, grading pathway, surveillance pathways and referral pathways. https://assets.publishing.service.gov.uk/government/uploads/system/uploads/attachment_data/file/805605/NHS_Diabetic_Eye_Screening_Programme_Pathway_Standards.pdf.
[2] Zachariah, S., Wykes, W., Yorston, D. (2015). Grading diabetic retinopathy (DR) using the Scottish grading protocol. Community Eye Health, 28(92): 72-73.
[3] Grading diabetic retinopathy from stereoscopic color fundus photographs--an extension of the modified Airlie House classification. ETDRS report number 10. Early Treatment Diabetic Retinopathy Study Research Group. (1991). Ophthalmology, 98(5): 786-806. https://pubmed.ncbi.nlm.nih.gov/2062513/.
[4] Cuadros, J., Bresnick, G. (2009). EyePACS: An adaptable telemedicine system for diabetic retinopathy screening. Journal of Diabetes Science and Technology, 3(3): 509-516.https://doi.org/10.1177/193229680900300315
[5] Grzybowski, A., Brona, P., Krzywicki, T., Gaca-Wysocka, M., Berlińska, A., Święch, A. (2022). Variability of grading DR screening images among non-trained retina specialists. Journal of Clinical Medicine, 11(11): 1-12. https://doi.org/10.3390/jcm11113125
[6] Raumviboonsuk, P., Krause, J., Chotcomwongse, P., Sayres, R., Raman, R., Widner, K., Campana, B.J., Phene, S., Hemarat, K., Tadarati, T. (2019). Deep learning vs. human graders for classifying severity levels of diabetic retinopathy in a real-world nationwide screening program. Digital Medicine, 25: 1-9. https://doi.org/10.48550/arXiv.1810.08290
[7] Wang, J., Bai, Y., Xia, B. (2019). Feasibility of diagnosing both severity and features of diabetic retinopathy in fundus photography. IEEE Access, 7: 102589-102597. https://doi.org/10.1109/ACCESS.2019.2930941.
[8] Al-Turk, L., Wawrzynski, J., Wang, S., Krause, P., Saleh, G.M., Alsawadi, H., Alshamrani, A.Z., Peto, T., Bastawrous, A., Li, J., Tang, H.L. (2022). Automated feature-based grading and progression analysis of diabetic retinopathy. Eye, 36(3): 524-532. https://doi.org/10.1038/s41433-021-01415-2
[9] Thapa, R., Bajimaya, S., Pradhan, E., Sharma, S., Kshetri, B., Paudyal, G. (2020). Agreement on grading retinal findings of patients with diabetes using fundus photographs by allied medical personnel when compared to an ophthalmologist at a diabetic retinopathy screening program in Nepal. Clinical Ophthalmology, 21(14): 2731-2737. https://doi.org/10.2147/OPTH.S269002
[10] American Academy of Ophthalmology. International clinical diabetic retinopathy disease severity scale. https://web.archive.org/web/20200110213754id_/http://www.icoph.org:80/dynamic/attachments/resources/diabetic-retinopathy-detail.pdf.
[11] Li, H., Li, G., Li, N., Liu, C., Yuan, Z., Gao, Q., Hao, S., Fan, S., Yang, J. (2023). Cost-effectiveness analysis of artificial intelligence-based diabetic retinopathy screening in rural China based on the Markov model. PLoS One, 18(11). https://doi.org/10.1371/journal.pone.0291390
[12] Jaafar, H.F., Nandi, A.K., Al-Nuaimy, W. (2011). Decision support system for the detection and grading of hard exudates from color fundus photographs. Journal of Biomedical Optics, 16(11), 116001. https://doi.org/10.1117/1.3643719
[13] Kavitha, S., Duraiswamy, K. (2011). Automatic detection of hard and soft exudates in fundus images using color histogram thresholding. European Journal of Scientific Research, 43, 493-504.
[14] Niemeijer, M., van Ginneken, B., Staal, J., Suttorp-Schulten, M.S., Abramoff, M.D. (2005). Automatic detection of red lesions in digital color fundus photographs. IEEE Transactions on Medical Imaging, 24(5): 584-592. https://doi.org/10.1109/TMI.2005.843738
[15] Qomariah, D.U.N., Tjandrasa, H., Fatichah, C. (2021). Segmentation of microaneurysms for early detection of diabetic retinopathy using MResUNet. International Journal of Intelligent Engineering and Systems, 14(3): 359-373. https://doi.org/10.22266/ijies2021.0630.30
[16] Gregson, P.H., Shen, Z., Scott, R.C., Kozousek, V. (1995). Automated grading of venous beading. Computer Methods and Programs in Biomedicine, 28(4): 291-304.https://doi.org/10.1006/cbmr.1995.1020
[17] Fraz, M.M., Jahangir, W., Zahid, S., Hamayun, M.M., Barman, S.A. (2017). Multiscale segmentation of exudates in retinal images using contextual cues and ensemble classification. Biomedical Signal Processing and Control, 35: 50-62. https://doi.org/10.1016/j.bspc.2017.02.012
[18] Long, S., Huang, X., Chen, Z., Pardhan, S., Zheng, D. (2019). Automatic detection of hard exudates in color retinal images using dynamic threshold and SVM classification: Algorithm development and evaluation. BioMed Research International, 2019: 1-13. https://doi.org/10.1155/2019/3926930
[19] Verma, S.B., Yadav, A.K. (2019). Detection of hard exudates in retinopathy images. ADCAIJ: Advances in Distributed Computing and Artificial Intelligence Journal, 8(4): 41-48. https://doi.org/10.14201/ADCAIJ2019844148
[20] Al-Sariera, T.M., Rangarajan, L., Amarnath, R. (2020). Detection and classification of hard exudates in retinal images. Journal of Intelligent & Fuzzy Systems, 38: 1943-1949. https://doi.org/10.3233/JIFS-190492
[21] Kaur, J., Mittal, D., Malebary, S., Nayak, S.R., Kumar, D., Kumar, M., Gagandeep, S.S. (2023). Automated detection and segmentation of exudates for the screening of background retinopathy. Journal Healthcare Engineering, 2023. https://doi.org/10.1155/2023/4537253
[22] Wilkinson, C.P., Ferris, F.L., Klein, R.E., Lee, P.P., Agardh, C.D., Davis, M., Dills, D., Kampik, A., Pararajasegaram, R., Verdaguer, J.T. (2003). Proposed international clinical diabetic retinopathy and diabetic macular edema disease severity scales. Ophthalmology, 110(9): 1677-1682. https://doi.org/10.1016/S0161-6420(03)00475-5