Nurul Chamidah*![]() | Didit Widiyanto
| Didit Widiyanto![]() | Henki Bayu Seta
| Henki Bayu Seta![]() | Azwa Abdul Aziz
| Azwa Abdul Aziz![]()
© 2024 The authors. This article is published by IIETA and is licensed under the CC BY 4.0 license (http://creativecommons.org/licenses/by/4.0/).
OPEN ACCESS
Aspect-based sentiment analysis aims to classify sentiment polarity in opinionated texts based on its associated aspect. However, imbalanced data is a significant challenge that can lead to a decline in classification performance. In machine learning, strategies such as oversampling and undersampling can be implemented to rectify this imbalance. The primary objective of this study is to investigate the impact of data balancing techniques, including oversampling and undersampling, on aspect-based sentiment analysis to enhance classification performance. To achieve this objective, SMOTE, random oversampling, and random undersampling are employed in logistic regression for multi-label classification in aspect-based sentiment analysis. The data for this study was obtained from Google Reviews submitted by individuals who visited the beach in Indramayu. Subsequently, this data was annotated based on tourism-related factors and the sentiments expressed by users. Following this, the data underwent a preprocessing stage and was divided into separate training and test datasets. The training dataset accounted for 60% of the data, while the remaining portion was allocated for testing purposes. During the model training process, data balancing was achieved by implementing oversampling and undersampling techniques and utilizing Logistic Regression with Stochastic Gradient Descent Optimization as the model learning method. The resultant model was subsequently employed to test the test dataset. The evaluation results indicate that oversampling techniques led to a considerable improvement in performance compared to the absence of data balancing. These findings provide a comparison between balancing techniques in sentiment analysis models in tourism that suffer from an imbalanced dataset. Consequently, the oversampling technique can be considered in developing aspect-based sentiment analysis models within the tourism industry.
aspect-based sentiment analysis, imbalance data, Indramayu, logistic regression, oversampling, sentiment analysis, undersampling
Tourism represents a potential source of income for a region. One such region that has made strides in developing its tourism sector is Indramayu Regency. Indramayu Regency is located on the north coast of Java Island, which has 11 sub-districts with 36 villages directly adjacent to the Java Sea, with a coastline length of 147 km. Indramayu is situated in the northern region of Java Island [1]. This geographical location has facilitated the development of numerous beach tours, which have become a significant tourist attraction in the local area and the majority of attractions in Indramayu. This study focuses on the natural attractions of nine beaches in Indramayu, namely Tiris Indramayu Beach, Balongan Indah Beach, Legenda Tirtamaya Beach, Plentong Ujunggebang Beach, Tambak Indah Beach Tourism, Karang Song Beach, Junti Beach, Glayem Beach, and Panjiwa Sumber Mas Beach.
These tourist destinations can be easily accessed through applications such as Google Maps. As the number of tourist attractions continues to grow, the competition is expected to intensify. Consequently, it will be necessary to implement various strategies to attract visitors and ensure the long-term viability of this industry. One crucial factor influencing visitors' decision to visit a tourist attraction is the reviews provided by other visitors who have already been there. These reviews serve as a valuable reference. The reviews available on Google Reviews can also be taken into consideration when determining the most suitable tourist attraction. In addition to serving as a source of information for visitors, these reviews can also be evaluated by the managers of the tourism objects to identify potential areas for improvement that could enhance visitor satisfaction.
Reviewing a large number of visitor reviews can be a time-consuming task. Therefore, a technique is needed to collect and analyze these reviews on a large scale. Sentiment Analysis is one such technique that can be employed to address this challenge. Sentiment analysis involves the computational study of opinions, sentiments, and emotions expressed in text to determine whether the sentiment is positive or negative [2].
The purpose of sentiment analysis is to assist users in understanding the sentiment expressed in order to facilitate informed decision-making about an object. This study aims to determine the sentiments expressed in visitor reviews of tourist destinations in Indramayu through Google Reviews. The sentiment classification of these reviews will assess the accuracy of the multi-label classification method based on aspects and related sentiments.
Machine learning techniques can be used to classify sentiment, such as Naïve Bayes [3], and Support Vector Machine (SVM) [4] to classify sentiment opinion. Logistic regression has also been used to classify customer reviews [5-7]. Previous studies have also explored the application of deep learning algorithms to perform sentiment analysis of reviews, including application usage reviews and reviews of specific locations [8-10]. However, such methods require large amounts of data. With a limited amount of data, conventional machine learning remains an attractive option.
The issue of data imbalance is a significant challenge in machine learning. An imbalanced dataset may result in a classifier being unable to accurately classify classes with a limited number of instances. To address the problem of imbalance in sentiment analysis, Ogul et al. employed various balancing techniques, including oversampling and undersampling, on English and Turkish texts [11]. Furthermore, the application of balancing methods has been shown to yield positive outcomes in the sentiment classification of application reviews using machine learning algorithms, with an improvement in accuracy of up to 13% observed in Indonesian text [12].
This study differs from previous research [11, 12], which focuses on a single-label case sentiment analysis and aims to predict positive, negative, and neutral polarity. Instead, this study performs multi-label classification sentiment analysis based on its aspect in Indonesian text using logistic regression as a classifier. This approach has been demonstrated to yield effective results in sentiment analysis, as evidenced by previous studies [13, 14]. Furthermore, the impact of oversampling and undersampling methods on aspect-based sentiment analysis datasets with imbalanced data has been evaluated in the context of Indramayu Tourism.
The work is organized as follows: Section 2 presents the related works on balancing methods, section 3 describes the methodology used to classify aspect-based sentiment analysis, section 4 presents the results and discussion, and finally, section 5 concludes the study.
The practice of sharing experiences or reviews about products or services through social media has become increasingly prevalent. Other individuals subsequently utilized this review as a factor in their purchasing decisions. This phenomenon also extends to the selection of travel destinations. This phenomenon also occurs when tourists select a destination for their vacation or a place to stay. The tourism sector is significantly influenced by the decision-making process based on visitor reviews from social media. Young people today tend to consult online reviews, such as those found on travel blogs, forums, and review sites, before determining a tourist destination [15]. In addition to being useful for consumers, this product review can also be the key to developing products or services. From the review, potential aspects can be identified that can be developed or need to be improved to satisfy consumers in the future better [16].
The information derived from review texts is expected to provide an understanding of the customer experience, not merely from ratings, which can be inconsistent and less able to show which aspects are advantages and which need to be improved concerning goods and services. Given the vast quantity of information available online, the time required to read all the reviews is considerable. Consequently, a sentiment analysis system capable of analyzing the reviews is necessary.
Sentiment analysis is currently developed mainly using dictionary-based and machine learning methods [17]. As dictionary-based methods require knowledge-based resources, languages with low dictionary resources rely on machine learning-based methods in sentiment analysis. Logistic regression has been employed to classify sentiment in Arabic [5-7] and Indonesian [13], with encouraging results. SVM and Naive Bayes have also been employed as classifiers to predict sentiment polarity [3, 4, 12]. However, one of the challenges in machine learning arises when dealing with class imbalance. Imbalanced data often produces unsatisfactory results in classification [18], particularly when one class occupies the majority of the sample size. The imbalanced nature of the dataset poses a challenge for machine learning models. These models are more likely to learn from the class with more significant sample representation in the dataset, mainly when the degree of imbalance is high. The result of such models is often high accuracy in classifying data to its majority class. However, if the model is analyzed further, the samples of the minority class are mostly assigned to the class with the majority sample.
One solution to address this issue is data balancing. Oversampling and undersampling are frequently employed as a means of addressing the issue of imbalanced data in machine learning. In the case of undersampling, a random selection of samples from the majority class is used to balance the number of samples in the minority class [19]. In contrast, oversampling involves replicating and adding samples from the minority class to the dataset, thereby ensuring a balanced distribution of samples across the different classes [20].
The development of oversampling techniques that do not only duplicate samples was carried out in study of Chawla et al. by introducing SMOTE [21]. The methodology involves a mixture of undersampling the majority class as well as oversampling the minority class by using synthetic examples of the latter. The paper presents evidence that this methodology is capable of producing superior classifier performance compared to methods that only under-sample the majority class or vary the loss rates in the class priors in Naive Bayes. The methodology is evaluated using Area Under Curve (AUC) and Receiver Operating Characteristic (ROC), and is shown to produce better classifier performance than alternative resampling approaches.
SMOTE is often used in imbalanced data cases. In the health field, works by Ijaz et al. [22] propose a Hybrid Prediction Model (HPM) designed to forecast the probability of type 2 diabetes and hypertension at an incipient stage using input risk factors from individuals. The model incorporates DBSCAN-based outlier detection, SMOTE, and Random Forest algorithms to achieve heightened precision in predictions. The model surpasses other models in predicting diabetes and hypertension. In their study, Feng et al. [23] examine the stability of SMOTE-based oversampling techniques within the context of software defect prediction. It posits a sequence of stable SMOTE-based oversampling techniques to advance the stability of SMOTE techniques.
A study by Özdemir at al. [24] classifies imbalanced hyperspectral images, which involves the utilization of deep learning techniques in tandem with SMOTE balancing methods. The study assesses the performance of various metrics to gauge the effectiveness of different balancing methods and multiclass classification approaches. Ultimately, the paper finds that the proposed SMOTE-based balancing method, combined with deep learning techniques, markedly enhances the classification accuracy of imbalanced hyperspectral images. Hybrid ensemble classifier that integrates SMOTE oversampling, random search hyper-parameters optimization, and gradient boosting tree effectively identifies rock discontinuity traces trace with high accuracy [25].
Another balancing technique, random undersampling, is also used in detecting web attacks in the CSE-CIC-IDS2018 dataset [26]. The investigation encompasses a total of eight random undersampling ratios and seven distinct classifiers employed for the detection of web attacks. Before applying any random undersampling, the classifiers utilized in the experiment encountered difficulties in achieving satisfactory classification performance, thereby highlighting the issue of class imbalance in web attacks. With the gradual increase in random undersampling, there was a general improvement in the classification performance aimed at addressing the problem of class imbalance. Expert system for the automated identification of obstructive sleep apnea through the utilization of a single-lead ECG and the technique of random undersampling boosting yields superior results in terms of sensitivity, specificity, and accuracy when compared to the currently available detection algorithms [27].
Karthikeyan and Kathirvalavakumar [28] propose a technique for addressing imbalanced datasets in classification through the utilization of undersampling approach. Specifically, the method under consideration employs an incremental clustering technique, wherein the representatives of the clusters are ascertained as the average of instances of the respective cluster. This proposed undersampling technique outperforms existing approaches that employ K-Means and Leader algorithm. The outcomes yielded through the proposed algorithm are characterized by higher accuracy and reduced misclassification rate in both major and minor classes, thereby establishing the efficacy of the proposed method.
Random oversampling also widely used, such as identifying mobile malware, which effectively mitigates the issue of imbalanced network traffic information [29]. The proposed method entails creating new instances of malicious activity by synthesizing signatures obtained from clustered malicious network traffic datasets. These newly generated instances are then combined with those obtained through random oversampling, resulting in a more enriched minority class dataset. Moreo et al. [30] proposed technique serves as a viable means to enhance the precision of classification algorithms in the realm of imbalanced text classification issues. It can be seamlessly employed in various domains of binary text classification where the negative instances vastly outnumber the positive instances pertaining to the class of interest. The approach facilitates the generation of synthetic training examples for the minority class, thereby optimizing the classifier's performance.
This research not only examines the sentiment expressed in reviews but also attempts to predict aspects that contain sentiment. Furthermore, this research compares data balancing techniques employed in aspect-based sentiment analysis, including SMOTE, random oversampling, and random oversampling compared to no balancing techniques.
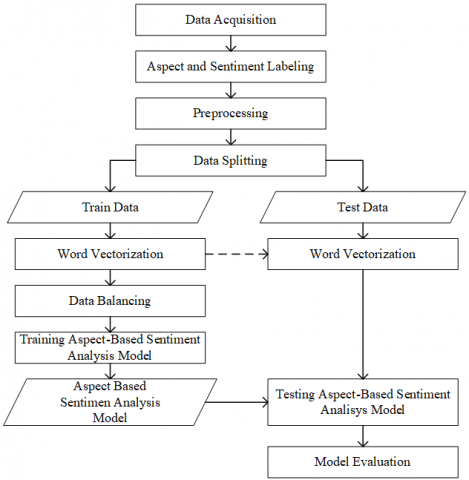
Figure 1 shows the research methodology used in this study. There are seven main steps: data acquisition, annotation (labeling), preprocessing, data splitting, vectorization, classification, and evaluation.
Figure 1. Methodology
3.1 Data acquisition
The dataset was taken from Google Maps on nine beaches in Indramayu, namely Tiris Indramayu Beach, Balongan Indah Beach, Legenda Tirtamaya Beach, Plentong Ujunggebang Beach, Tambak Indah Beach Tourism, Karang Song Beach, Junti Beach, Glayem Beach, Panjiwa Beach Sumber Mas and obtained 1677 rows of data. The criteria for data collection are reviews that have text (review ratings without text are not taken). Table 1 shows an example of a review taken from Google Maps review.
Table 1. Dataset sample
|
Review |
|
Akses lokasi hanya bisa motor, Banyak pohon jd adem, ada beberapa spot foto yg bagus jg. Tiket masuk murah. Access to the location can only be motorbikes, lots of trees are cool, there are some good photo spots too. Cheap admission. |
|
jalannya perlu diperbaiki dan kebersihan pantai perlu dijaga the road needs to be repaired and the cleanliness of the beach needs to be maintained |
|
pantai tiris merupakan salah satu tempat wisata baru di indramayu, pantainya lumayan bagus, tapi sayang akhir-akhir ini banyak sampah berserakan dan pengelola sepertinya tidak peduli dan akses menuju kesana juga cukup sulit, semoga pengelola akan memperbaikinya dengan cepat Tiris beach is one of the new tourist attractions in Indramayu, the beach is pretty good, but it's a shame that lately there's been a lot of trash scattered around and the manager doesn't seem to care and access to it is also quite difficult, hopefully the manager will fix it quickly |
The data was collected and then annotated by three individuals in accordance with specific guidelines, with the objective of ensuring uniformity in annotation across different annotators. The final label for each review was determined through majority voting. The guidelines typically involve two distinct stages of annotation: one for identifying aspects and another for determining sentiments. Aspect labels encompass a range of categories, including cleanliness, facilities, accessibility, attractiveness, image, price, and human resources. Sentiment labels are further categorized as either positive or negative sentiment polarity. Each sentence review can be labeled to more than one aspect such as text sample 1 in Table 1. The sentence review mentioned accessibility, attractiveness, and price, which can be labeled as 1 and other aspects as 0. Samples of aspect labeling from Table 1 can be seen in Table 2.
Table 2. Multi aspect labeling
|
Review |
Cleanliness |
Facility |
Accessibility |
Attractiveness |
Image |
Price |
Human Resource |
|
Akses lokasi ... Access to the location … |
0 |
0 |
1 |
1 |
1 |
1 |
0 |
|
jalannya perlu diperbaiki … the road needs to be repaired … |
1 |
0 |
1 |
0 |
0 |
0 |
0 |
|
pantai tiris … Tiris beach … |
1 |
0 |
1 |
0 |
1 |
0 |
-1 |
Table 3. Sentiment labeling
|
Review |
Cleanliness |
Facility |
Accessibility |
Attractiveness |
Image |
Price |
Human Resource |
|
Akses lokasi ... Access to the location … |
- |
- |
Neg |
Pos |
Pos |
Pos |
- |
|
jalannya perlu diperbaiki … the road needs to be repaired … |
Neg |
- |
Neg |
- |
|
- |
- |
|
pantai tiris … Tiris beach … |
Neg |
- |
Neg |
- |
Pos |
- |
Neg |
The sentiment of each aspect is annotated as 1, then analyzed further, whether it has positive or negative sentiment. If there is no discussion about a specific aspect, then its sentiments remain null. Examples of sentiment labeling can be seen in Table 3. The first sample shows an associated sentiment for accessibility, which is negative because the beach can only be accessed by motorcycle. The second example shows a negative in cleanliness because the user mentioned that the cleanliness of the beach needs to be maintained.
Table 4. Positive and negative sentiment distribution
|
Aspect |
Positive |
Negative |
Total |
|
Cleanliness |
137 (44,33%) |
172 (55,66%) |
309 |
|
Facilities |
67 (44,97%) |
82 (55,03%) |
149 |
|
Accessibility |
39 (28,26%) |
99 (71,74%) |
138 |
|
Attractiveness |
731 (87,34%) |
106 (12,66%) |
837 |
|
Images |
465 (96,67%) |
16 (3,33%) |
481 |
|
Price |
152 (84,92%) |
27 (15,08%) |
179 |
|
Human Resources |
20 (33,33%) |
40 (66,67%) |
60 |
After completing the annotation process, the acquisition of labeled data is quite limited. In addition, the quantity of labeled data is relatively small compared to the overall dataset. Furthermore, there exists an imbalance in the labels assigned to sentiments on various aspects. This disparity can be observed in Table 4, where the distribution of positive and negative sentiment labels for each aspect predominantly exhibits an uneven distribution. For instance, in the aspects of accessibility, attractiveness, image, price, and human resources, one class represents only one-third or less of the total dataset pertaining to that specific aspect.
3.3 Preprocessing
Data preprocessing is a process for preparing raw data before being processed by the system by removing inappropriate data or changing the data into a form that is easier for the system to process [31]. In sentiment analysis, this preprocessing stage is crucial, especially for social media, which mostly contains informal and unstructured words or sentences and has a lot of noise. Data preprocessing is a very important part of this research, as it prepares raw data before being processed by the system by removing inappropriate data to reduce noise. It is hoped that it will produce a good classification model later.
The data used at this stage is raw data in the form of reviews from previously labeled social media, but most of the review data contains non-standard and unstructured words or sentences and has large noise. The preprocessing carried out in this study was case folding, stopword removal, stemming, and word normalization. The result of this stage is data that is ready for the vectorization and classification process.
3.3.1 Case folding
Case folding is the initial stage in data preprocessing. At this stage, all letters in a document or sentence become lowercase. In this case folding process, all letters in each review data will be converted to lowercase letters to ensure that all letters are in lowercase is due to the fact that capital and lowercase words are stored as separate entities in computer language [32]. This process guarantees that the term "term" is recognized as being equivalent to "Term".
3.3.2 Punctuation removal
This stage aims to remove some data that does not have useful features for sentiment analysis. In this process, each data review will be cleaned by removing punctuation. In this study, terms will be extracted and split by space. Therefore, punctuation needs to be removed.
3.3.3 Normalization
In this language normalization process, any review data containing non-standard words, such as misspellings and abbreviations will be changed or converted into standard words or words that are in accordance with the Big Indonesian Dictionary (KBBI). This stage is carried out by matching each word in the review data with the dictionary; this dictionary is built by evaluating each review manually by taking non-standard words and then adding standard words to the dictionary. The dictionary that has been built is then used to replace non-standard words, such as abbreviations, typos, etc., with standard words. Normalization reduces vocabulary which can contribute to reducing noise and standardization of texts [33, 34].
3.3.4 Stemming
Stemming is the utilization of heuristic algorithms in eliminating morphological affixes from words, thereby retaining solely the word stem [35] which leads to a reduction in vocabulary size. This technique aims to get the base words or stem of words by removing their affixes, either prefixes, suffixes, or prefixes and suffixes. This stemming is done to eliminate word variations due to affixes that form passive forms, active forms, endings and so on and only take the base form.
3.3.5 Stop words removal
Stop words are common words that are considered to provide little or no information or value in document analysis [36, 37]. The process of eliminating stop words is employed to remove words that lack semantic significance and frequently appear. In this study, the Sastrawi library's compilation of stop words is employed to filter out stop words.
3.4 Data splitting
The data utilized in this study has been divided into two distinct subsets, the train data 60%, and the test data 40%. The division was undertaken to ensure that the data employed for training and testing purposes was distinct, thereby resulting in more objective testing outcomes. Table 5 presents the results of data splitting based on aspect labels. The total number of training samples is 1,006, while the number of testing samples is 671.
For each aspect, two classes define whether an aspect is present or not present for each text review. Such as cleanliness, 194 of 1,006 samples in the training set that used as training for aspect models, and sentiment models are trained using aspect present labels that consists of positive and negative sentiments.
3.5 Text vectorization
Text representation in this study is done by converting text to vector using Term Frequency – Inverse Document Frequency (TF.IDF). In the field of information retrieval, term weights are primarily utilized to denote the term usefulness in the retrieval process. TF.IDF is a quantitative measure that combines the two variables TF and IDF. In this context, TF offers a direct assessment of the likelihood of occurrence of a term, which is standardized by the overall frequency in the document or the collection of documents, contingent upon the extent of the calculation. Conversely, IDF can be interpreted as the quantification of information level in traditional information theory [38]. The TF.IDF values for each term are calculated using the training data. The testing data vector is obtained by transforming the text with the TF.IDF term vector from the previous training data.
Table 5. Data splitting
|
Aspect |
Training |
Testing |
||
|
Present |
Not-present |
Present |
Not-present |
|
|
Cleanliness |
194 |
812 |
115 |
556 |
|
Facilities |
92 |
914 |
57 |
614 |
|
Accessibility |
83 |
923 |
55 |
616 |
|
Attractiveness |
490 |
516 |
347 |
324 |
|
Images |
290 |
716 |
191 |
480 |
|
Price |
121 |
885 |
58 |
613 |
|
Human Resources |
36 |
970 |
24 |
647 |
3.6 Data balancing
In the training phase, data balancing is performed to ensure equitable learning from data by the model. However, data balancing is not employed in testing data. We utilize various techniques such as Random Over Sampling (ROS), SMOTE, and Random Under Sampling (RUS) to achieve data balance. In this experimental study, a comparative analysis of these techniques is conducted.
Undersampling involves selecting a subset of points from the majority class while discarding the rest. On the other hand, oversampling entails replicating some of the points from the minority class to increase its cardinality. Alternatively, synthetic data generation involves crafting novel data points from the minority class, an approach exemplified by the SMOTE method [21], to augment its cardinality.
3.7 Logistic regression using stochastic gradient descent
TF-IDF vector as feature vector (x) are combined linearly using weights (coefficient values) to predict an output value (y). The output of logistic regression is binary values, 0 or 1 that are generated from the sigmoid function using threshold 0.5. Sigmoid function can be seen in Eq. (1).
$sigmoid(z)=\frac{1}{1+\exp (-z)}$ (1)
Error during training process is measured using the log loss function, as seen in Eq. (2).
$LogLoss =-\frac{1}{n} \sum_{i=0}^n\left[y_i \log \left(\hat{y}_i\right)+\left(1-y_i\right) \log \left(1-\hat{y}_i\right)\right]$ (2)
The weight update is achieved through stochastic gradient descent, which aims to minimize the loss function. This entails updating the weight by either decreasing or increasing it. The decision to update the weight is based on the prediction error. When the difference between the prediction and class is positive, the weight is updated to be smaller. Conversely, if the difference is negative, the weight is increased. Eq. (3) and Eq. (4) are utilized to compute the gradient for weight update in stochastic gradient descent, where dw is used to update weights, and db to update biases. In this update weights, we use λ 0.0001.
$d w^{(t)}=x_n\left(y_n-\sigma\left(\left(w^{(t)}\right)^{\mathrm{T}} x_n+b^t\right)\right)-\frac{\lambda}{N} w^{(t)}$ (3)
$d b^{(t)}=y_n-\sigma\left(\left(w^{(t)}\right)^{\mathrm{T}} x_n+b^t\right)_n$ (4)
So, new weights are defined by the sum of old weights and the multiplication of the learning rate and its updated weights. In this study, we use a learning rate of 0.1. Equation for new weights and biases can be seen in Eq. (5) and Eq. (6).
$w^{(t+1)}=w^{(t)}+\left(\eta \cdot d w^{(t)}\right)$ (5)
$b^{t+1}=b^t+\left(\eta \cdot d b^{(t)}\right)$ (6)
3.8 Aspect-based sentiment analysis model
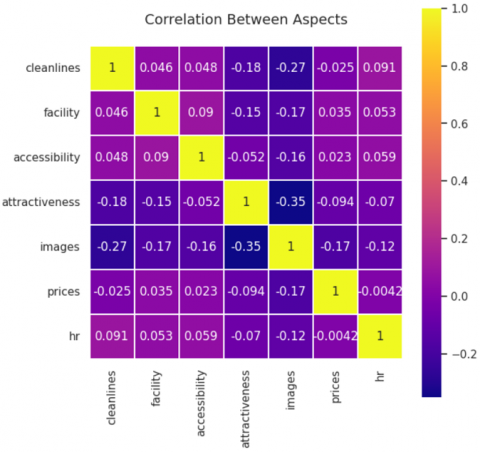
A binary relevance model is used to perform multi-label classification for aspect and sentiment. In binary relevance, a group of single-label binary classifiers undergoes training, with each classifier being assigned to a specific class. The classifiers in question predict the membership or non-membership of their respective classes, with the final multi-label output being determined by the union of all predicted classes. This approach used the assumption that there is no correlation between aspect labels. Figure 2 shows the correlation between aspect labels. The highest correlation between different aspect labels are images and attractiveness with -0.35, which can be interpreted as a low negative correlation, and the other correlation is considered very low. Thus, in this study, we assume there is no correlation between labels and the use of binary relevance.
Figure 2. Correlation between aspect labels
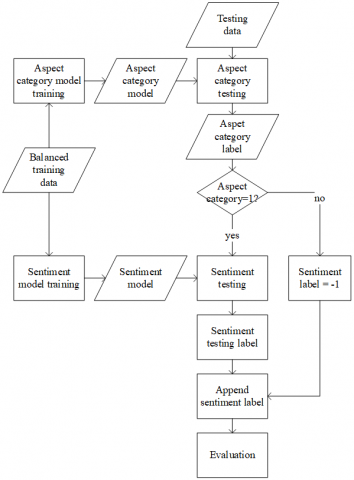
Figure 3 shows the classification process in aspect-based sentiment analysis. The training data in the form of TF.IDF vectors is used to build a Logistic Regression model with Stochastic Gradient Descent (SGD) to update the weights. In the aspect-based sentiment analysis model, the model consists of two steps. The first step is to build the aspect model, then the second step builds a model for sentiment classification which is done separately with the same data. Each category and sentiment has its own logistic regression model, so there are eight aspect models and eight sentiment models. For the sentiment model, the training data used is training data with not-null labels.
The aspect category and sentiment models that have been built using training data are then tested with testing data. Testing is done hierarchically, where the testing data is tested with the aspect model, if the aspect is detected (has a label of 1), then the data will be tested using related aspect’s sentiment models into positive (1) or negative (0) sentiment. If the aspect category is 0, then the sentiment on that aspect is given a dummy value of -1. The output of these sentiment labels is then used for evaluation.
Figure 3. Classification process
3.9 Model evaluation
In order to conduct a comparative analysis and assessment of the models, we employed precision, recall, and F1 score as the evaluation metrics. Precision provides insight into the veracity of the model, while recall signifies the comprehensiveness of the model. The calculation of precision and recall involves TP, TN, FP, and FN, which correspond to true positive, true negative, false positive, and false negative, respectively. TP denotes the correct classification of the positive sentiments, TN signifies the correct classification of the negative sentiments, FP represents the incorrectly classified values of the positive sentiments or has negative real class sentiments, and FN denotes the incorrectly classified samples of the negative sentiment or has a positive real class. The F1 score, the harmonic mean of precision and recall, is deemed a more significant evaluation parameter, particularly in imbalanced datasets. These evaluation parameters fall within the range of 0 to 1, where 1 denotes the highest value and 0 denotes the lowest value. Precision, Recall, and F1-Score are defined in Eqs. (7)-(9).
Precision $=\frac{T P}{T P+F P}$ (7)
Recall $=\frac{T P}{T P+F N}$ (8)
$F 1-$ Score $=2 \frac{\text { Precision } \cdot \text { Recall }}{\text { Precision }+ \text { Recall }}$ (9)
In this section, we discuss the result of our four distinct sets of experiment scenarios. Our objective is to assess and contrast the performances of aspect-based sentiment analysis on an imbalanced dataset and a balanced dataset, utilizing the techniques of Synthetic Minority Oversampling Technique (SMOTE), Random Over Sampling (ROS), and Random Under Sampling (RUS). The machine learning models employed in this empirical study encompass the utilization of Logistic Regression, with Stochastic Gradient Descent as weights optimizer using learning rate of 0.1 and epoch of 500. In order to mitigate any potential overfitting issues, the training and testing data have been partitioned into a 60-40% ratio, respectively.
Table 6. Comparison of balancing method on aspect-based sentiment analysis
|
Aspect |
Balancing Method |
Precision (%) |
Recall (%) |
F1-Score (%) |
|
Cleanliness |
w/o balancing |
95 |
69 |
80 |
|
SMOTE |
95 |
73 |
83 |
|
|
ROS |
95 |
73 |
83 |
|
|
RUS |
80 |
79 |
80 |
|
|
Facilities |
w/o balancing |
47 |
32 |
38 |
|
SMOTE |
37 |
44 |
40 |
|
|
ROS |
32 |
44 |
37 |
|
|
RUS |
15 |
52 |
23 |
|
|
Accessibility |
w/o balancing |
22 |
29 |
25 |
|
SMOTE |
15 |
29 |
20 |
|
|
ROS |
15 |
29 |
20 |
|
|
RUS |
7 |
43 |
12 |
|
|
Attractiveness |
w/o balancing |
64 |
66 |
65 |
|
SMOTE |
66 |
65 |
65 |
|
|
ROS |
65 |
63 |
64 |
|
|
RUS |
59 |
64 |
61 |
|
|
Images |
w/o balancing |
56 |
60 |
58 |
|
SMOTE |
48 |
77 |
59 |
|
|
ROS |
45 |
78 |
57 |
|
|
RUS |
41 |
46 |
43 |
|
|
Price |
w/o balancing |
70 |
65 |
67 |
|
SMOTE |
34 |
75 |
47 |
|
|
ROS |
39 |
71 |
50 |
|
|
RUS |
55 |
67 |
60 |
|
|
Human Resources |
w/o balancing |
100 |
18 |
31 |
|
SMOTE |
60 |
27 |
37 |
|
|
ROS |
60 |
27 |
38 |
|
|
RUS |
5 |
55 |
9 |
Table 6 presents a comparison of the various balancing methods employed in aspect-based sentiment analysis. The highest F1-score of 83 for cleanliness is achieved using SMOTE and ROS, exceeding without balancing and RUS. As for facility and image aspects, the best F1-score was achieved using the SMOTE balancing method with scores of 40 and 59, respectively. In contrast, undersampling has negative impact on model performance. The application of the balancing technique has been observed to result in a decline in accessibility and price aspects performance. In the attractiveness aspect, the SMOTE method did not result in an improvement in the F1-score, whereas other methods tended to result in a decrease in performance. The human resources aspect exhibited the most favorable performance when employing random oversampling, with a slight discrepancy observed between this approach and SMOTE, which differed by 1%.
Table 7. Comparison of balancing method on aspect classification
|
Aspect |
Balancing Method |
Precision (%) |
Recall (%) |
F1-Score (%) |
|
Cleanliness |
w/o balancing |
98 |
89 |
93 |
|
SMOTE |
96 |
94 |
95 |
|
|
ROS |
96 |
95 |
95 |
|
|
RUS |
85 |
97 |
91 |
|
|
Facilities |
w/o balancing |
53 |
44 |
48 |
|
SMOTE |
48 |
63 |
55 |
|
|
ROS |
47 |
67 |
55 |
|
|
RUS |
26 |
82 |
40 |
|
|
Accessibility |
w/o balancing |
80 |
64 |
71 |
|
SMOTE |
72 |
71 |
72 |
|
|
ROS |
71 |
71 |
71 |
|
|
RUS |
49 |
87 |
63 |
|
|
Attractiveness |
w/o balancing |
70 |
69 |
70 |
|
SMOTE |
68 |
77 |
72 |
|
|
ROS |
69 |
74 |
71 |
|
|
RUS |
59 |
94 |
73 |
|
|
Images |
w/o balancing |
57 |
59 |
58 |
|
SMOTE |
49 |
77 |
60 |
|
|
ROS |
46 |
80 |
58 |
|
|
RUS |
41 |
83 |
55 |
|
|
Price |
w/o balancing |
70 |
69 |
70 |
|
SMOTE |
36 |
81 |
50 |
|
|
ROS |
41 |
78 |
54 |
|
|
RUS |
44 |
90 |
59 |
|
|
Human Resources |
w/o balancing |
82 |
38 |
51 |
|
SMOTE |
72 |
54 |
62 |
|
|
ROS |
72 |
54 |
62 |
|
|
RUS |
11 |
88 |
20 |
The preceding results indicate that the oversampling method tends to decrease precision on nearly all aspects of sentiment, except for the attractiveness and cleanliness aspects, which exhibit slight improvements in precision or stability following oversampling. Conversely, the undersampling method was found to result in a reduction in precision across all sentiment aspects.
The balancing method demonstrated an improvement in recall for the following aspects: cleanliness, facilities, images, prices, and human resources. In the accessibility aspect, oversampling did not result in an improvement in recall, whereas undersampling led to a significant increase in recall from 29 to 43, although a decline in precision accompanied this. In addition, the undersampling method has been observed to improve recall in the human resources aspect, although this has been accompanied by a reduction in precision. This phenomenon is suspected to be the result of a limited number of positive sentiments.
Since two models, the aspect model and the sentiment model, are combined sequentially in the sentiment aspect analysis scenario, we analyze if each model is separated under the assumption that the aspect model and the sentiment model each stand alone to find out the performance of multi-label classification when the two models are not combined.
Table 8. Comparison of balancing method on sentiment classification
|
Aspect |
Balancing Method |
Precision (%) |
Recall (%) |
F1-Score (%) |
|
Cleanliness |
w/o balancing |
93 |
77 |
84 |
|
SMOTE |
93 |
77 |
84 |
|
|
ROS |
91 |
77 |
83 |
|
|
RUS |
86 |
83 |
84 |
|
|
Facilities |
w/o balancing |
72 |
72 |
72 |
|
SMOTE |
72 |
72 |
72 |
|
|
ROS |
73 |
76 |
75 |
|
|
RUS |
70 |
76 |
73 |
|
|
Accessibility |
w/o balancing |
62 |
71 |
67 |
|
SMOTE |
56 |
71 |
63 |
|
|
ROS |
62 |
71 |
67 |
|
|
RUS |
55 |
86 |
67 |
|
|
Attractiveness |
w/o balancing |
90 |
95 |
92 |
|
SMOTE |
93 |
84 |
88 |
|
|
ROS |
92 |
86 |
89 |
|
|
RUS |
95 |
67 |
79 |
|
|
Images |
w/o balancing |
96 |
100 |
98 |
|
SMOTE |
97 |
96 |
96 |
|
|
ROS |
97 |
96 |
96 |
|
|
RUS |
99 |
52 |
69 |
|
|
Price |
w/o balancing |
96 |
96 |
96 |
|
SMOTE |
98 |
94 |
96 |
|
|
ROS |
98 |
92 |
95 |
|
|
RUS |
100 |
69 |
81 |
|
|
Human Resources |
w/o balancing |
100 |
36 |
53 |
|
SMOTE |
100 |
36 |
53 |
|
|
ROS |
100 |
36 |
53 |
|
|
RUS |
54 |
64 |
58 |
The performance of the aspect model using the same testing data without combining aspects and sentiment can be seen in Table 7. Oversampling method in Aspect detection tends to improve overall F1-Score except for price that downgrades performance. Conversely, undersampling decreased the f1-score except for the attractiveness aspect that surpass without balancing the dataset and also oversampling SMOTE and Random Over Sampling (ROS). For precision and recall, balancing techniques generally increase recall and decrease precision. This shows that oversampling increases aspect detection or true positives with an increase in recall but also has the side effect of increasing false positives as indicated by a decrease in precision.
The performance of the standalone sentiment model can be observed in Table 8. It is noteworthy that the overall performance of the balancing method is nearly identical to that of the original data set without balancing. However, it is noteworthy that in certain aspects, the balancing technique has a detrimental effect on performance. This is particularly evident in the attractiveness and image aspects, where the balancing technique has a significant negative impact on recall without a commensurate increase in precision, resulting in a decline in the F1-score. Conversely, in the price aspect, undersampling has a pronounced negative effect on performance, with a notable reduction in recall. In contrast, undersampling has a beneficial effect on recall and a detrimental effect on precision in human resources, cleanliness, facilities, and accessibility aspects.
The aspect model and sentiment model demonstrate superior performance compared to the combination of the two models. This indicates that the decline in performance is observed in samples that are correctly identified by the aspect model but not necessarily successfully classified by the sentiment model. Additionally, there are instances where models that are correctly classified by the sentiment model fail to be recognized as actual aspects when classified by the aspect model. Given that aspect models precede sentiment models, if an aspect is not detected, it will never reach the sentiment model. This results in the sequential combination of the two models exhibiting a lower performance than the aspect model.
In this investigation, logistic regression is employed as a classifier, given the limited quantity of samples. Sophisticated models such as deep learning or its advanced model, transformers-based models, require a large number of samples. However, an imbalanced dataset may result in logistic regression leading to overfitting, wherein the model excels in predicting the majority class but performs inadequately in predicting the minority class. This can lead to high efficacy during training but diminished effectiveness during testing.
The results of investigating balancing techniques in sentiment analysis indicate that oversampling has the tendency to enhance the detection accuracy of minority classes while slightly diminishing the accuracy of majority classes. Undersampling, on the other hand, is inclined to lower the predictive performance. Within the scope of this particular investigation, the diminished sample size resulting from undersampling leads to a deterioration in predictive performance.
In aspect-based sentiment analysis, particularly in the context of binary relevance, where predictions are made at two distinct levels—first at the aspect level and then at the sentiment level—the performance of sentiment prediction is not only reliant on the sentiment model but also impacted by the accuracy of aspect prediction. This is due to the fact that the aspect prediction serves as a precursor to sentiment analysis.
By using aspect-based sentiment analysis, reviews can be completed at a lower cost and in less time. The tourism industry can benefit from aspect-based sentiment analysis by gaining insights into user satisfaction and dissatisfaction with specific aspects. This information can be used to enhance services and gain a competitive advantage. The results of this study can support the development of aspect-based sentiment analysis models on limited and imbalanced datasets.
The comparison of balancing methods in this study indicates that the oversampling method can enhance the overall performance of aspect-based sentiment analysis in the tourism sector with limited and imbalanced data. Consequently, the balancing method in aspect-based sentiment analysis on Indramayu tourism has a positive impact on the F1-Score, increasing it by 1-6% on the aspects of cleanliness, facilities, images, and human resources when oversampling SMOTE is employed in comparison to the scenario without balancing. The results of the random oversampling method indicate a positive impact on the cleanliness and human resources aspects, with an improvement of 3-7% in the F1-Score. Conversely, the random undersampling method has been observed to result in a decline in the F1-Score for the aspect-based sentiment analysis.
The logistic regression method with SGD is an appropriate approach for this aspect-based sentiment analysis study in tourism, where the amount of data is limited in each aspect and the data exhibits an imbalanced class problem. Logistic regression models that are sensitive to imbalance problems can be mitigated by employing oversampling balancing techniques, which can enhance sentiment detection performance on each aspect.
Evaluation results show that Logistic Regression with SGD is affected by the aspect model and sentiment model that is used sequentially. Where stand alone models, aspect models only or sentiments model only performs better than the combination of these two models. The oversampling method can improve aspect detection in aspect models, but in sentiment models balancing method tends to not affecting performance.
This research has limitations that can be addressed in future studies. Suggestions for future research on the dataset include the following: as the review progresses, the number of dataset samples for research can be expanded, and methods can be developed in terms of both the automatic extraction of aspect entities and the use of deep learning methods as classification algorithms and language models such as BERT for text vectorization.
This work is supported by the Universitas Pembangunan Nasional Veteran Jakarta (Grant numbers: 291/UN.61.0/HK.07/LIT.RIKIN/2022).
[1] Kabupaten Indramayu Dalam Angka 2024. https://indramayukab.bps.go.id/publication/2024/02/28/eac236cc254229b0738e9fb5/kabupaten-indramayu-dalam-angka-2024.html
[2] Farhadloo, M., Rolland, E. (2016). Fundamentals of sentiment analysis and its applications. Studies in Computational Intelligence, 639: 1-24. https://doi.org/10.1007/978-3-319-30319-2_1/COVER
[3] Martiti, Juliane, C. (2021). Implementation of Naive Bayes algorithm on sentiment analysis application. In Proceedings of the 2nd International Seminar of Science and Applied Technology (ISSAT 2021), pp. 193-200. https://doi.org/10.2991/AER.K.211106.030
[4] Jamil, M., Hadiyanto, H., Sanjaya, R. (2024). Sentiment analysis: Classifying public comments on YouTube in disaster management simulation in Indonesia using naïve bayes and support vector machine. Ingenierie des Systemes d’Information, 29(2), 437-446. https://doi.org/10.18280/ISI.290205
[5] Hicham, N., Karim, S., Habbat, N. (2022). An efficient approach for improving customer Sentiment Analysis in the Arabic language using an Ensemble machine learning technique. In Proceedings of the 2022 5th International Conference on Advanced Communication Technologies and Networking (CommNet 2022), Marrakech, Morocco. https://doi.org/10.1109/COMMNET56067.2022.9993924
[6] Jihad, K.H., Baker, M.R., Farhat, M., Frikha, M. (2023). Machine learning-based social media text analysis: Impact of the rising fuel prices on electric vehicles. In Lecture Notes in Networks and Systems, pp. 625-635. https://doi.org/10.1007/978-3-031-27409-1_57
[7] Al Omari, M. (2022). OCLAR: Logistic regression optimisation for Arabic customers’ reviews. International Journal of Business Intelligence and Data Mining, 20(3): 251-273. https://doi.org/10.1504/IJBIDM.2022.122177
[8] Habimana, O., Li, Y., Li, R., Gu, X., Yu, G. (2019). Sentiment analysis using deep learning approaches: An overview. Science China Information Sciences, 63(1): 1-36. https://doi.org/10.1007/S11432-018-9941-6
[9] Ramadhani, A.M., Goo, H.S. (2017). Twitter sentiment analysis using deep learning methods. In Proceedings of the 2017 7th International Annual Engineering Seminar (InAES 2017), Yogyakarta, Indonesia. https://doi.org/10.1109/INAES.2017.8068556
[10] Yadav, A., Vishwakarma, D.K. (2019). Sentiment analysis using deep learning architectures: A review. Artificial Intelligence Review, 53(6): 4335-4385. https://doi.org/10.1007/S10462-019-09794-5
[11] Ogul, H.A., Guran, A. (2019). Imbalanced dataset problem in sentiment analysis. In UBMK 2019 - Proceedings, 4th International Conference on Computer Science and Engineering, Samsun, Turkey, pp. 313-317. https://doi.org/10.1109/UBMK.2019.8907041
[12] Fikri, M., Sarno, R. (2019). A comparative study of sentiment analysis using SVM and SentiWordNet. Indonesian Journal of Electrical Engineering and Computer Science, 13(3): 902-909. https://doi.org/10.11591/IJEECS.V13.I3.PP902-909
[13] Bahtiar, S.A.H., Dewa, C.K., Luthfi, A. (2023). Comparison of Naïve Bayes and Logistic Regression in sentiment analysis on marketplace reviews using rating-based labeling. Journal of Information Systems and Informatics, 5(3): 915-927. https://doi.org/10.51519/JOURNALISI.V5I3.539
[14] Dhanalakshmi, P., Kumar, G.A., Satwik, B.S., Sreeranga, K., Sai, A.T., Jashwanth, G. (2023). Sentiment analysis using VADER and Logistic Regression techniques. In Proceedings of the 2023 International Conference on Intelligent Systems for Communication, IoT and Security (ICISCoIS 2023), Coimbatore, India, pp. 139-144. https://doi.org/10.1109/ICISCOIS56541.2023.10100565
[15] Hernández-Méndez, J., Muñoz-Leiva, F., Sánchez-Fernández, J. (2015). The influence of e-word-of-mouth on travel decision-making: Consumer profiles. Current Issues in Tourism, 18(11): 1001-1021. https://doi.org/10.1080/13683500.2013.802764
[16] Chakrabortty, K., Lee, Y.U., Chung, H., Park, J.Y. (2024). Online review analysis from a customer behavior observation perspective for product development. Sustainability, 16(9): 3550. https://doi.org/10.3390/SU16093550
[17] Zheng, X., Chen, W., Zhou, H., Li, Z., Zhang, T., Yuan, Q. (2022). Emoji-integrated polyseme probabilistic analysis model: Sentiment analysis of short review texts on library service quality. Traitement du Signal, 39(1): 313-322. https://doi.org/10.18280/TS.390133
[18] George, S., Srividhya, V. (2022). Performance evaluation of sentiment analysis on balanced and imbalanced dataset using ensemble approach. Indian Journal of Science and Technology, 15(17): 790-797. https://doi.org/10.17485/IJST/V15I17.2339
[19] Xiao, Z., Wang, L., Du, J.Y. (2019). Improving the performance of sentiment classification on imbalanced datasets with transfer learning. IEEE Access, 7: 28281-28290. https://doi.org/10.1109/ACCESS.2019.2892094
[20] Sapra, T., Shubhama, Meena, S. (2023). A Novel approach to handle imbalanced dataset in machine learning. In 2023 IEEE 8th International Conference for Convergence in Technology (I2CT 2023), Lonavla, India. https://doi.org/10.1109/I2CT57861.2023.10126309
[21] Chawla, N.V., Bowyer, K.W., Hall, L.O., Kegelmeyer, W.P. (2011). SMOTE: Synthetic minority over-sampling technique. Journal of Artificial Intelligence Research, 16: 321-357. https://doi.org/10.1613/jair.953
[22] Ijaz, M.F., Alfian, G., Syafrudin, M., Rhee, J. (2018). Hybrid prediction model for type 2 diabetes and hypertension using DBSCAN-based outlier detection, synthetic minority over sampling technique (SMOTE), and random forest. Applied Sciences, 8(8): 1325. https://doi.org/10.3390/APP8081325
[23] Feng, S., Keung, J., Yu, X., Xiao, Y., Zhang, M. (2021). Investigation on the stability of SMOTE-based oversampling techniques in software defect prediction. Information and Software Technology, 139: 106662. https://doi.org/10.1016/J.INFSOF.2021.106662
[24] Özdemir, A., Polat, K., Alhudhaif, A. (2021). Classification of imbalanced hyperspectral images using SMOTE-based deep learning methods. Expert Systems with Applications, 178: 114986. https://doi.org/10.1016/J.ESWA.2021.114986
[25] Chen, J., Huang, H., Cohn, A. G., Zhang, D., Zhou, M. (2021). Machine learning-based classification of rock discontinuity trace: SMOTE oversampling integrated with GBT ensemble learning. International Journal of Mining Science and Technology. https://doi.org/10.1016/j.ijmst.2021.08.004
[26] Zuech, R., Hancock, J., Khoshgoftaar, T.M. (2021). Detecting web attacks using random undersampling and ensemble learners. Journal of Big Data, 8(1): 1-20. https://doi.org/10.1186/S40537-021-00460-8/TABLES/20
[27] Hassan, A.R., Haque, M.A. (2017). An expert system for automated identification of obstructive sleep apnea from single-lead ECG using random under sampling boosting. Neurocomputing, 235: 122-130. https://doi.org/10.1016/J.NEUCOM.2016.12.062
[28] Karthikeyan, S., Kathirvalavakumar, T. (2022). Modified leader algorithm for under-sampling the imbalanced dataset for classification. In Lecture Notes in Networks and Systems, pp. 107-118. https://doi.org/10.1007/978-981-16-2422-3_9
[29] Pang, Y., Chen, Z., Peng, L., Ma, K., Zhao, C., Ji, K. (2019). A signature-based assistant random oversampling method for malware detection. In Proceedings of the 2019 18th IEEE International Conference on Trust, Security and Privacy in Computing and Communications/13th IEEE International Conference on Big Data Science and Engineering (TrustCom/BigDataSE 2019), Rotorua, New Zealand, pp. 256-263. https://doi.org/10.1109/TRUSTCOM/BIGDATASE.2019.00042
[30] Moreo, A., Esuli, A., Sebastiani, F. (2016). Distributional random oversampling for imbalanced text classification. In Proceedings of the 39th International ACM SIGIR Conference on Research and Development in Information Retrieval (SIGIR 2016), pp. 805-808. https://doi.org/10.1145/2911451.2914722
[31] Hickman, L., Thapa, S., Tay, L., Cao, M., Srinivasan, P. (2022). Text preprocessing for text mining in organizational research: Review and recommendations. Organizational Research Methods, 25(1): 114-146. https://doi.org/10.1177/1094428120971683
[32] George, G., Osinga, E., Lavie, D., Scott, B. (2016). Big data and data science methods for management research. Academy of Management Journal, 59(5): 1493-1507. https://doi.org/10.5465/AMJ.2016.4005
[33] Kobayashi, V.B., Mol, S.T., Berkers, H.A., Kismihók, G., Den Hartog, D.N. (2018). Text mining in organizational research. Organizational Research Methods, 21(3): 733-765. https://doi.org/10.1177/1094428117722619
[34] Kern, M.L., Park, G., Eichstaedt, J.C., Schwartz, H.A., Sap, M., Smith, L.K., Ungar, L.H. (2016). Gaining insights from social media language: Methodologies and challenges. Psychological Methods, 21(4): 507-525. https://doi.org/10.1037/MET0000091
[35] Bird, S., Klein, E., Loper, E. (2009). Natural Language Processing with Python: Analyzing Text with the Natural Language Toolkit. O’Reilly Media, Inc.
[36] Banks, G.C., Woznyj, H.M., Wesslen, R.S., Ross, R.L. (2018). A Review of best practice recommendations for text analysis in R (and a User-Friendly App). Journal of Business and Psychology, 33(4): 445-459. https://doi.org/10.1007/S10869-017-9528-3
[37] Pennebaker, J.W., Francis, M.E., Booth, R.J. (2001). Linguistic Inquiry and Word Count: LIWC 2001. Mahwah: Lawrence Erlbaum Associates. https://liwc.app/static/documents/LIWC2001%20Manual%20-%20Operation%2C%20Development%2C%20and%20Psychometrics.pdf.
[38] Aizawa, A. (2003). An information-theoretic perspective of TF–IDF measures. Information Processing & Management, 39(1): 45-65. https://doi.org/10.1016/S0306-4573(02)00021-3