K.S. Lakshmi*![]() | Divya James
| Divya James![]() | Jerin Varghese
| Jerin Varghese![]()
© 2024 The authors. This article is published by IIETA and is licensed under the CC BY 4.0 license (http://creativecommons.org/licenses/by/4.0/).
OPEN ACCESS
The liver is our largest internal organ and controls all bodily metabolic processes, including transforming dietary nutrients into compounds that may be used by the body, storing those substances, and then providing them to the cells as needed. Ailments of the liver are among the most devastating disorders in many countries. The prevalence of liver disease has progressively risen due to excessive alcoholism, exposure to dangerous gases, eating foods laced with poison, and drug use. The majority of people worldwide experience mild to severe liver disorders as a result of bad lifestyle choices. Liver diseases continue to post a significant global health challenge, and the need for improved detection methods is crucial. Here, we propose a hybrid model to predict liver maladies utilizing machine learning & deep learning modes. Researchers study datasets of patients with liver disorders in order to help in the creation of classification models for forecasting liver illness. Making use of such datasets can ease the burden on medical practitioners and speed up the diagnosing process. An ensemble stacking model is used in the first phase with ML algorithms such as Naïve Bayes, Decision Tree, KNN & SVM. A logistic regression model functions as meta learner for predicting liver diseases utilizing clinical data. In the second phase, ensemble stacking model is used with VGG 16, ResNet and Inception V3 as the base learners and logistic regression as meta learner for the analysis of image dataset. Combining multiple models, especially using ensemble methods, often enhances predictive performance by leveraging the strengths of individual models.
Naïve Bayes, decision tree, KNN, SVM, VGG 19, ResNet, Inception V3
The liver maintains a healthy blood sugar level in the body and eliminates toxins from the body. Despite the ability of the body's organs to recover on their own, excessive alcohol use, exposure to polluted air, and water pollution harm the liver and increase the likelihood of liver failure. The likelihood of liver failure can be decreased by detecting liver disease as early as possible. Early stages of liver illnesses can be predicted utilizing health parameters. Nowadays, liver disorders can be detected using both deep learning and ML techniques. These automated technologies can aid doctors and even patients in providing more precise prognoses for various liver diseases. As a result of progress in medical technology, various automated systems were developed.
Liver illnesses are a major worldwide health burden causing a wide range of ailments and affecting its functions. Serious health effects from liver illnesses include cirrhosis, liver failure, and hepatocellular cancer. Comprehending the extent of this burden and the significance of timely identification is crucial for effective public health initiatives and enhanced patient results. Early liver disease detection enables prompt medical management, lifestyle changes, and intervention. The type of liver illness suspected, the intensity of symptoms, and the patient's medical history all influence the detection method selection.
The disease known as liver failure occurs when the liver is unable to carry out vital tasks that are required to keep the body's metabolic processes and general health functioning. Health parameters obtained from medical imaging studies, such as liver size, presence of lesions, and degree of fibrosis, are important for assessing the structural integrity of the liver. Physiological Parameters such as liver stiffness provide information about the elasticity of liver tissue. Overall health indicators like BMI, BP, and glucose levels, may influence the risk and progression of liver diseases.
Machine learning prediction models have emerged as a valuable tool for identifying liver diseases at an early stage. Machine learning (ML) uses statistical and mathematical modes to analyse small data samples to formulate general conclusions. In order to learn from experience, Arthur Samuel introduced ML and pattern recognition algorithms in 1959, which was the first-time significant advancement was acknowledged. The primary purpose is to gain knowledge and make predictions or decisions. ML has enabled fast and efficient completion of several previously laborious tasks. Thanks to the exponential growth of computerization, ML can evaluate intricate patterns within big datasets and uncover subtle associations that older analytical approaches may find difficult to detect, ML is particularly well-suited for the prediction of liver illnesses. It is possible to train Convolutional Neural Networks (CNNs) to identify anomalies, tumors, or lesions in liver pictures. This can help with the early diagnosis of diseases such as hepatocellular carcinoma.
Deep learning ML methods instruct the computer to imbibe by performing what humans do and the computer model executes classification tasks directly from any image or text. Higher accuracy is achieved, at times surpassing human performance. An extensive collection of labelled data and multi-layered neural network architecture help in training. The Input, output, convolution, pooling, and fully connected layers are all included. Large amounts of labelled data are necessary for deep learning which demands immense processing power. This is ably supported by parallel architecture of high-performance GPUs and in combination with clusters or cloud computing, it reduces training time for deep learning network.
Although both deep learning and conventional machine learning are subsets of artificial intelligence, their methods for feature representation, model building, and data analysis are different. Deep learning has demonstrated impressive results in medical data analysis tasks like prognosis prediction, illness diagnosis, and medical picture analysis, where precise predictions depend on intricate patterns in the data.
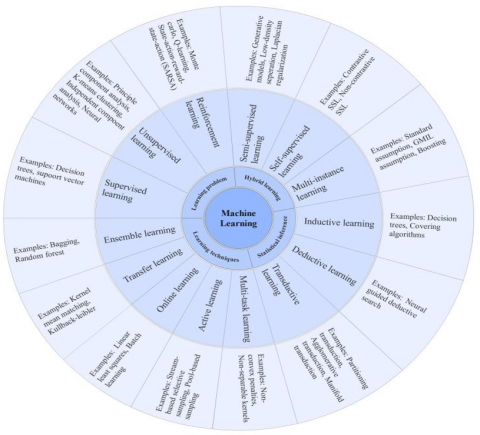
This proposed model blends in deep learning and ML techniques to predict liver diseases from clinical text data and image data. Figure 1 shows the various classes of algorithms used [1].
Figure 1. Various classes of machine learning algorithms
Clinical Decision Support Systems (CDSS) [1] is vital in assisting both physicians and patients by facilitating timely diagnoses and guiding them towards appropriate treatments to mitigate the impact of diseases. Tanwar and Rahman [2] conducted a detailed study which offers a comprehensive review of the advancements in the utilization of AI for prediction and detection of a liver disease. Additionally, it summarizes the limitations observed in these studies, concluding with potential avenues for future research in this domain. These systems make use of a wide array of data mining and ML algorithms for achieving desired results. The section herewith encompasses research conducted over the past six years concerning the application of AI in diagnosing liver diseases. Numerous studies have made use of the Indian Liver Patient Dataset (ILPD) sourced from UCI machine repository [3], including references [4-16]. The ILPD dataset comprises 583 records encompassing 11 attributes, wherein class 1 represents 416 liver patients, and class 2 has 167 non-liver patients. Here, 80% of datasets were utilized for model training while balance 20% was reserved for testing purposes. Classification tasks were executed utilizing 10-fold cross-validation. When it comes to improving diagnostic precision, promoting early diagnosis, and bolstering customized medicine in the treatment of liver disease, clinical decision support systems are quite beneficial. But in order to fully realize their potential and guarantee their appropriate application in clinical practice, issues like data quality, interoperability, and ethical considerations need to be properly addressed.
Additionally, researchers have employed the BUPA dataset, also obtained from UCI machine repository [3], as highlighted in references [17-19]. This dataset comprises 345 instances featuring 7 attributes, with an extra attribute indicating disease and its severity. Researchers have incorporated primary data obtained from medical institutions in their studies. In a comparative analysis of various classifiers utilizing ILPD conducted with Rapid Miner & IBM SPSS Modeler tools, several interesting findings emerged [4]. SVM (Support Vector Machine) demonstrated the highest accuracy, reaching 72.54% in Rapid Miner, while C5.0 exhibited the highest accuracy at 87.91% in SPSS Software.
Another study [6] pitted the Naive Bayes (NB) and SVM algorithms against each other on ILPD dataset. The results favored SVM, indicating superior classification accuracy compared to NB. Furthermore, a novel hybrid model called Neuro SVM was introduced, combining the strengths of SVM and Artificial Neural Networks (ANN). The hybrid model classified ILPD with an impressive accuracy rate of above 90% [7]. In a different approach, CT scans from 80 patients were utilized to extract significant features from the region of interest (ROI) using Sequential Forward Selection Search (SFSS) and Genetic Algorithm (GA). These features were subsequently employed for classification using Probabilistic Neural Network (PNN), Linear Vector Quantization (LVQ) Neural Network, and Back Propagation Neural Network (BPNN). PNN outperformed LVQ and BPNN [20]. Additionally, a study focused on assessing fibrosis in those affected with chronic liver disease by comparing Shear Wave Elastography (SWE) measurements with biopsy scores. The empirical results indicated a correlation between SWE estimates of liver stiffness and fibrosis severity, suggesting the potential use of SWE to differentiate those with varying degrees of fibrosis [21]. The ILPD dataset's unique features and the trade-offs between computing efficiency, interpretability, and the capacity to identify complicated relationships in the data are taken into consideration while choosing between Naive Bayes and Support Vector Machines for diagnosis. Integrating the advantages of both algorithms could provide a strong method to improve overall performance in the identification of liver disease.
In an innovative approach, a Neuro-Fuzzy inference system was employed, achieving 79.83% accuracy after classifying data from ILPD. Noteworthy factors contributing to this classification success included total bilirubin (TB), direct bilirubin (DB), alkaline phosphatase (Alkphos), and serum glutamic-oxaloacetic transaminase (Sgot) [8]. Another machine learning model was developed for predicting progression of liver fibrosis using Decision Tree (DT) classifier, based on records from 100 patients with Hepatitis C (HCV). Data pre-processing was conducted, and its characteristics were selected through ANOVA and BOX plot testing. This model attained 93.7% accuracy in predicting liver fibrosis stages [22]. The ability of Neuro-Fuzzy Inference Systems to handle uncertainties using fuzzy logic, adapt and learn from data, and provide interpretable decision-making is what makes them revolutionary. Improvements in model architectures, rule generation, learning algorithms, and the fusion of NFIS with other cutting-edge technologies, such deep learning or reinforcement learning, can all lead to novel contributions.
In a study conducted by Tian et al. [23], 139 research papers related to liver research were analyzed based on deep learning. They conducted an analysis of the interplay between data modality, liver-related topics and research, employing a Sankey diagram. Within this context, CT scans, liver tumors, and the LiTS dataset emerged as the predominant choices for data modality, topic of interest, and application, respectively. Additionally, they presented deep learning techniques applied to each liver-related topic, along with insights into the associations and prevailing trends within these methods. Among the various deep learning methods, U-Net, CNN, and Transformer stood out as most frequently utilized. A majority of these techniques were primarily employed for tasks related to medical image segmentation. Notably, U-Net featured as the most commonly combined deep learning method, often paired with the Transformer. Furthermore, the Transformer's evolution within the field of computer vision has ignited immense research in exploring its applicability in liver-related studies. Using 165 patients, the study suggests [24] a novel machine learning method for identifying HCC. There were ten popular machine learning algorithms used. Normalization procedure was used in the preprocessing stage. Stratified 5-fold cross-validation combined with the genetic algorithm was used twice: once for feature selection and once for parameter optimization.
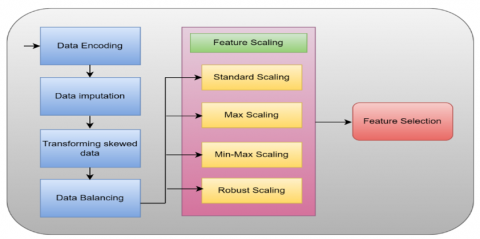
Before training various models, various preprocessing steps were applied on the dataset. To transform categorical data into numerical values, data encoding was used. Within the dataset, there exists a categorical feature, namely 'gender’ that encompasses two distinct classes, 'female' encoded as 0 and 'male,' as 1. In this model, multivariate feature imputation is utilized to deal with missing values, utilizing the IterativeImputer class from sklearn library. This technique employs the regressor for predicting and replacing absent values, rendering it extremely effective.
To assess whether data exhibits skewness, distribution curves can be plotted. Skewed data impacts performance by influencing model assumption or complicating analyses of feature importance. Here, 'log1p' transformation was employed for dealing with skewness of data. This particular transformation effectively mitigates skewness, helping to balance the distribution curve. Feature scaling was done to standardize independent features within the dataset to a specific range. It plays a crucial role in managing data with widely varying values. When a dataset isn't scaled, machine learning models may inadvertently assign higher importance to larger values and lower importance to smaller values, irrespective of their actual significance. Hence, various feature scaling methods like Min-max normalization, Maximum absolute scaling and Standardization were used. For selecting features, univariate selection techniques like Chi-squared test and F-test were done.
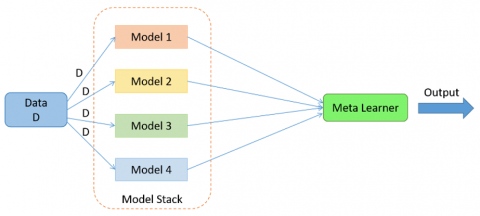
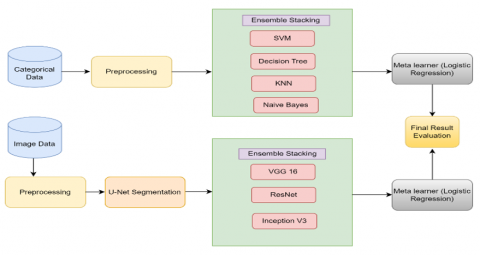
An ensemble stacking model given in Figure 2 is used in the analysis phase of clinical data. Ensemble learning involves the amalgamation of predictions derived from multi ML models applied to the same dataset, employing bagging and boosting etc. Stacking solves the query of selecting a model from multiple proficient machine learning models, each excelling in addressing a problem but in distinct ways. In contrast to bagging, stacking involves using diverse models, such as different types of algorithms (not limited to a single type, like decision trees), and these models are fitted on the same dataset rather than on samples of training dataset. Unlike boosting, where a sequence of models corrects the predictions of earlier ones, stacking employs a single model to learn the optimal way of combining predictions from diverse contributing models on the same dataset. The structure of a stacking model comprises 2 or more base models, commonly denoted as level-0 models, and a meta-model, which integrates those predictions generated by the base model. The training process of the meta-model or level-1 model involves utilizing predictions from base models on out-of-sample data. Specifically, data not employed in training is input into the models to generate predictions. The resulting predictions, and corresponding expected output, constitute dataset input and output pairs for training this meta-model. These outputs can take various forms depending on the nature of the task. For regression tasks, the outputs may be real values, while for classification tasks, they could be probability values, values resembling probabilities, or class labels. The most popular mode to create the training dataset involves k-fold cross-validation of base models, in which meta-model's training dataset is derived from the out-of-fold predictions. Input elements of training data, may also added into the training data, thus providing more context and helping to determine the optimal way to combine its predictions. While base models can be trained on the original training dataset, meta-model can be trained independently once training dataset has been prepared. When several ML models exhibit skills on a dataset but differ in how they demonstrate their skill, stacking becomes appropriate. Base models are frequently intricate and varied. Because of this, it's usually a good idea to use varied models having diverse assumptions about solving the predictive modelling task.
Figure 2. Ensembled stacking model
In this work we have used Naïve Bayes classifier, decision tree classifier, SVM and KNN as weak learners which constituted the model stack. Naive Bayes classifiers are relatively simple and easy to implement. They are efficient in terms of training time. They require less training data to estimate classification parameters. They perform well in high-dimensional spaces, such as text classification problems with myriad features. Naive Bayes is known to be robust to irrelevant features within the data and handles categorical and numerical data. Due to these advantages, Naïve Bayes classifier is chosen in the base model. Decision trees are easy to interpret. They do not require feature scaling and handle numerical and categorical data without the need for one-hot encoding or similar transformation. Decision trees are generally robust to outliers in the data and also, they can model nonlinear relationships as well. Hence the decision tree is chosen in the base model. SVMs are less prone to overfitting, especially in high-dimensional spaces. They can model complex, nonlinear decision boundaries by using kernel functions. SVMs can perform well with small to medium-sized datasets and can handle imbalanced datasets also. Due to these reasons, SVM is included in the base model. KNN is effective in capturing local patterns in the data. It can perform well when the decision boundaries are complex and not easily represented by a simple mathematical model. KNN is relatively robust to outliers. KNN makes no assumption about the underlying data distribution. It is a non-parametric algorithm, and so does not rely on assumptions regarding data shape. Since KNN does not involve a training phase, the time spent on model development is minimal. Due to these advantages, KNN is also included in the base model.
Usually, the meta-model offers a seamless interpretation of the predictions. Because of this, linear models like logistic regression are used for classification tasks (predicting class label) and linear regression for regression tasks (predicting numeric value) and are frequently employed as the meta-model. Since we are having a classification task, Logistic regression is used as the meta learner in our project.
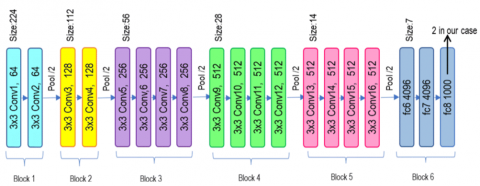
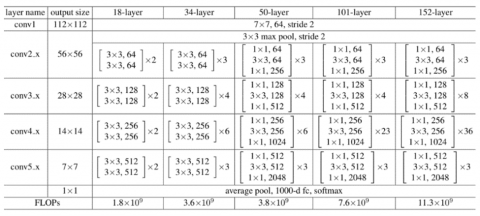
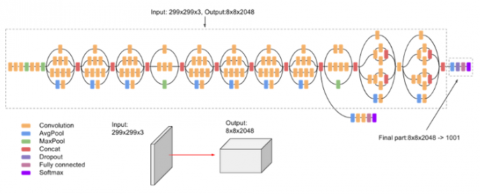
In the second phase, the image dataset was analyzed. Three CNN models (VGG 19, ResNet and Inception V3) were employed as weak learners in the model stack. Architecture of VGG19 is given in Figure 3. There are 16 convolution layers in VGG-19, organized in 5 blocks. One Maxpool layer follows each block to reduce input image size by 2 and increase filters in convolution layers number by 2. Last three dense layers in block 6 have the following dimensions: 4096, 4096, and 1000, in that order. The input images are categorized into 1000 distinct groups by VGG. The dimension of fc8 is set to two in this study because there are two output classes. Architecture of ResNet 50 is given in Figure 4. It consists of a 7x7 kernel convolution with 64 additional kernels having 2 stride size. It has a maximum pooling layer with a stride size of 2. There are 9 additional layers: one with 1×1,64 kernels, another with 3×3,64, and a third with 1×1,256 kernels. There are 3 repetitions of these layers. There are 12 more layers with 4 iterations of 1×1,128, 3×3,128, and 1×1,512 kernels. There are 18 more layers with 2 cores (3×3,256 and 1×1,1024) and 1×1,256 cores were iterated six times. There are nine additional layers with three iterations of 1×1,512, 3×3,512, and 1×1,2048 cores. Average pooling is used first, and softmax activation function creates a fully connected layer with 1000 nodes. Architecture of Inception V3 is given in Figure 5. It has 48 layers. Compared to Inception V1 and Inception V2, it shows better performance.
Figure 3. Architecture of VGG 19
Figure 4. Architecture of ResNet 50
Figure 5. Architecture of inception V3
Figure 6. System architecture
Figure 7. Preprocessing clinical text data
Logistic regression was used as the meta learner. The final result was evaluated on the basis of accuracy, precision, recall and F1-score.
The detailed architecture is shown in Figure 6. The first phase processes clinical data and dataset is taken from UCI Repository. For preprocessing clinical dataset, the model recommended by Md et al. [25] is used. The diagram is depicted in Figure 7.
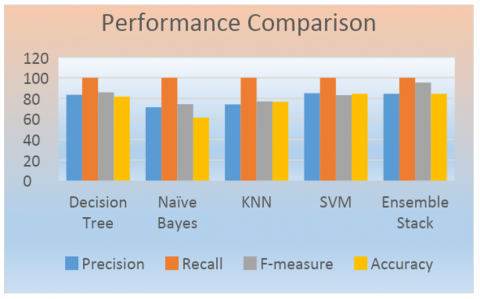
The model predicts liver diseases using different ML classifiers like KNN, Naïve Baye’s, SVM, and Decision Tree classifiers. Each performance along with stacked ensemble model is given in Table 1 and graphical representation is shown in Figure 8. The given accuracies show that this stacked model shows optimum performance in comparison with other classification models. To support the claim of superior performance, a statistical significance test is conducted. The null hypothesis and alternate hypothesis are formulated as follows:
H₀: Performance of classifiers are equal.
H₁: Performance of classifiers are different.
Two tests are used in our comparison: Friedman and Nemenyi tests. The first test is Friedman, and if H0 is rejected, we will use Nemenyi test to determine which classifier is optimal. In this case, there are five classifiers: Naïve Bayes, KNN, SVM, Decision tree and Ensemble stacked model. Friedman test is conducted by choosing the 4 parameters: Precision, Recall, Accuracy and F-measure. The Q-value is obtained as 7.85. The table value obtained is 3.25. Since this value is less than the observed value, Ho is rejected. So Nemenyi test is conducted. We must determine the difference between each classifier's mean rankings (average row in the ranking table) when performing the Nemenyi test (comparing pairs of classifiers). This difference indicates a significant difference between the two classifiers if it is larger than or equal to a CD (critic distance). Ensemble stack model and SVM found a difference that was greater than CD, indicating a significant difference between them and the superiority of ensemble stack over SVM is thus established.
Figure 8. Performance comparison of ML models
Table 1. Performance comparison of ML models
|
Classifier |
Precision |
Recall |
F-Measure |
Accuracy |
|
Decision Tree |
83.4 |
100 |
85.8 |
81.79 |
|
Naïve Bayes |
71.3 |
100 |
74.3 |
61.28 |
|
KNN |
74.1 |
100 |
77.1 |
76.67 |
|
SVM |
85.1 |
100 |
83.1 |
84.35 |
|
Ensemble Stack |
84.35 |
100 |
95.29 |
84.35 |
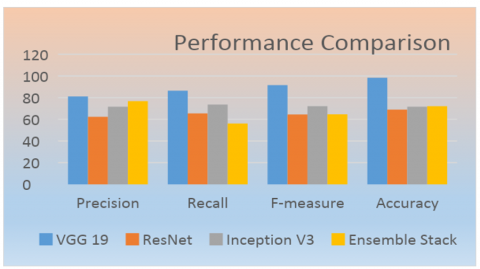
Table 2. Performance comparison of DL models
|
Classifier |
Precision |
Recall |
F-Measure |
Accuracy |
|
VGG 19 |
81.0 |
86.3 |
91.5 |
98.3 |
|
ResNet |
62.3 |
65.5 |
64.4 |
68.9 |
|
Ensemble Stack |
76.67 |
56.15 |
64.54 |
72.02 |
|
Inception V3 |
71.6 |
73.6 |
72.0 |
71.6 |
Performances of deep learning model and stacked ensemble model are given in Table 2 & graphical representation is shown in Figure 9. The given accuracies show that the VGG 19 shows optimum performance in comparison with other classification models.
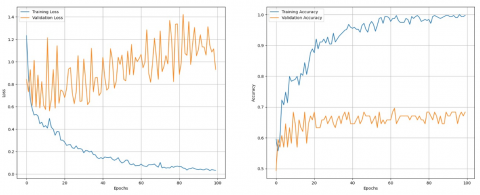
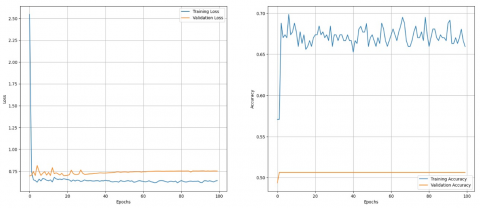
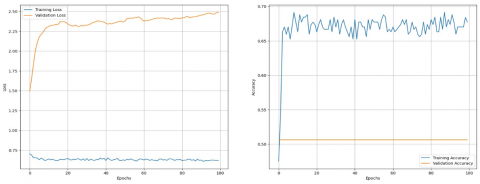
The graphs of training & validation loss and training & validation accuracy of models VGG 19, ResNet50 and Inception V3 are depicted in Figures 10, 11 and 12 respectively. A statistical significance test is conducted in this case also. The null hypothesis and alternate hypothesis are formulated as follows:
H₀: Performance of classifiers are equal.
H₁: Performance of classifiers are different.
Figure 9. Performance comparison of ML models
The Friedman test is conducted, and the Q-value is obtained as 9.3. Table value is obtained as 3.4. Since observed value is greater than table value, the hypothesis Ho is rejected. So Nemenyi test is conducted. We must determine the difference between each classifier's mean rankings (average row in the ranking table) when performing the Nemenyi test (comparing pairs of classifiers). This difference indicates a significant difference between the two classifiers if it is larger than or equal to a CD (critic distance). VGG 19 and Ensemble stack model found a difference that was greater than CD, indicating a significant difference between them and the superiority of VGG 19 over ensembled stack is thus established.
Liver disease is increasingly prevalent these days due to sedentary lifestyles, especially in metropolitan cities. Every year, millions of people succumb to liver disease. Analyses of clinical data, genetic records, & patient medical images often employ ML and deep learning modes. Studies validate potentiality of data mining and ML tools in medicine, which can extract hidden key predictive parameters from medical data sets, to enable early disease diagnosis and prediction. Feature extraction increases the classifier's accuracy and effectiveness. Statistical significance test like Friedman test followed by Nemenyi test was conducted. Ensemble stacked model is found to be superior to SVM and shows better performance compared to individual ML algorithms for clinical text data. Significance tests even prove that VGG19 gives better performance compared to ResNet50 and Inception V3 and even the ensembled stack model. This model can be used as a hybrid model for processing both clinical text data and image data. This hybrid model outperforms better than other models. As a future scope, upon obtaining both clinical data and image data from a single patient, the model can be used for early liver disease prediction.
Figure 10. Performance of VGG 19
Figure 11. Performance of ResNet 50
Figure 12. Performance of Inception V3
[1] Ahsan, M.M., Luna, S.A., Siddique, Z. (2022). Machine-learning-based disease diagnosis: A comprehensive review. Healthcare (Basel), 10(3): 541. https://doi.org/10.3390/healthcare10030541
[2] Tanwar, N., Rahman, K.F. (2021). Machine Learning in liver disease diagnosis: Current progress and future opportunities. IOP Conference Series: Materials Science and Engineering, 1st International Conference on Computational Research and Data Analytics (ICCRDA 2020), Rajpura, India. https://doi.org/10.1088/1757-899X/1022/1/012029
[3] Dua, D., Graff, C. (2019). UCI Machine Learning Repository. http://archive.ics.uci.edu/ml.
[4] Abdar M. (2015). A survey and compare the performance of IBM SPSS modeler and rapid miner software for predicting liver disease by using various data mining algorithms. Medicine, Computer Science Cumhuriyet Science Journal. https://doi.org/10.17776/CSJ.96023
[5] Abdar, M., Zomorodi-Moghadam, M., Das, R., Ting, I.H. (2017). Performance analysis of classification algorithms on early detection of liver disease. Expert Systems with Applications, 67: 239-251. https://doi.org/10.1016/j.eswa.2016.08.065
[6] Vijayarani, S., Dhayanand, S. (2015). Liver disease prediction using SVM and Naive Bayes Algorithms. International Journal of Science, Engineering and Technology Research (IJSETR), 4: 816-820.
[7] Nagaraj, K., Sridhar, A. (2015). NeuroSVM: A graphical user interface for identification of liver patients. https://doi.org/10.48550/arXiv.1502.05534
[8] Farokhzad, M.R., Ebrahimi, L. (2016). A novel adaptive neuro fuzzy inference system for the diagnosis of liver disease. International Journal of Academic Research in Computer Engineering, 1(1): 61-66.
[9] Hassoon, M., Kouhi, M.S., Zomorodi-Moghadam, M., Abdar, M. (2017). Rule optimization of boosted c5.0 classification using genetic algorithm for liver disease prediction. 2017 International Conference on Computer and Applications (ICCA), 299-305. https://doi.org/10.1109/COMAPP.2017.8079783
[10] Pasha, M., Fatima, M. (2017). Comparative analysis of meta learning algorithms for liver disease detection. Journal of Software, 12(12): 923-933. https://doi.org/10.17706/jsw.12.12.923-933
[11] Priya, M., Laura, P., Tamilselvi, P. (2018). Performance analysis of liver disease prediction using machine learning algorithms. International Research Journal of Engineering and Technology (IRJET), 5(1). https://www.irjet.net/archives/V5/i1/IRJET-V5I1570.pdf
[12] Ramaiah, M., Baranwal, P., Shastri, S.B., Vanitha, M., Vanmathi, C. (2019). Analytical comparison of machine learning techniques for liver dataset. In 2019 Innovations in Power and Advanced Computing Technologies (i-PACT), Vellore, India, pp. 1-5. https://doi.org/10.1109/i-PACT44901.2019.8960009
[13] Rahman, A.K.M.S., Javed Mehedi Shamrat, F.M., Tasnim, Z., Roy, J., Hossain, S.A. (2019). A comparative study on liver disease prediction using supervised machine learning algorithms. International Journal of Scientific & Technology Research, 8(11).
[14] Musleh, M., Alajrami, E., Khalil, A.J., Abu-Nasser, B.S., Barhoom, A.M., Abu Naser, S.S. (2019). Predicting liver patients using artificial neural network.
[15] Abdalrada, A.S., Yahya, O.H., Alaidi, A.H.M., Hussein, N.A., Alrikabi, H.T., Al-Quraishi, T. (2019). A predictive model for liver disease progression based on logistic regression algorithm. Periodicals of Engineering and Natural Sciences (PEN), 7: 1255-1264. https://doi.org/10.21533/PEN.V7I3.667
[16] Arbain, A.N., Balakrishnan, B.Y.P. (2019). A comparison of data mining algorithms for liver disease prediction on imbalanced data. International Journal of Data Science and Advanced Analytics, 1(1): 1-11. https://ijdsaa.com/index.php/welcome/article/view/2.
[17] Singh, A.K. (2019). A comparative study on disease classification using machine learning algorithms. SSRN Electronic Journal, 114: 1-10. http://doi.org/10.2139/ssrn.3350251
[18] Haque, M.R., Islam, M.M., Iqbal, H., Reza, M.S., Hasan, M.K. (2018). Performance evaluation of random forests and artificial neural networks for the classification of liver disorder. In International Conference on Computers, Communications, and Chemical, Material and Electronic Engineering (IC4ME2), Rajshahi, Bangladesh, pp. 1-5. https://doi.org/10.1109/IC4ME2.2018.8465658
[19] Arshad, I., Dutta, C., Choudhury, T., Thakral, A. (2018). Liver disease detection due to excessive alcoholism using data mining techniques. In 2018 International Conference on Advanced Computing, Communication and Engineering (ICACCE), Paris, France, pp. 163-168. https://doi.org/10.1109/ICACCE.2018.8441721
[20] Mala, K., Sadasivam, V., Alagappan, S. (2015). Neural network-based texture analysis of CT images for fatty and cirrhosis liver classification. Applied Soft Computing Journal, 32: 80-86. https://doi.org/10.1016/j.asoc.2015.02.034
[21] Samir, A.E., Dhyani, M., Vij, A., Bhan, A.K., Halpern, E.F., Méndez-Navarro, J., Corey, K.E., Chung, R. T. (2015). Shear-Wave elastography for the estimation of liver fibrosis in chronic liver disease: Determining accuracy and ideal site for measurement. Radiology, 274: 888-896. https://doi.org/10.1148/radiol.14140839
[22] Ayeldeen, H., Shaker, O., Ayeldeen, G., Anwar, K.M. (2016). Prediction of liver fibrosis stages by machine learning model: A decision tree approach. In 2015 IEEE World Conference on Complex Systems (WCCS 2015), Marrakech, Morocco. https://doi.org/10.1109/ICoCS.2015.7483212
[23] Tian, Y.J., Liu, M.H., Sun, Y., Fu, S. (2023). When liver disease diagnosis encounters deep learning: Analysis, challenges, and prospects. iLIVER, 2(1): 73-87. https://doi.org/10.1016/j.iliver.2023.02.002
[24] Książek, W., Abdar, M., Acharya, U.R., Pławiak, P. (2019). A novel machine learning approach for early detection of hepatocellular carcinoma patients. Cognitive Systems Research, 54: 116-127. https://doi.org/10.1016/j.cogsys.2018.12.001
[25] Md, A.Q., Kulkarni, S., Joshua, C.J., Vaichole, T., Mohan, S., Iwendi, C. (2023). Enhanced preprocessing approach using ensemble machine learning algorithms for detecting liver disease. Biomedicines, 11(2): 581. https://doi.org/10.3390/biomedicines11020581