Govindharaj Iyyanar*![]() | Karthick Gunasekaran
| Karthick Gunasekaran![]() | Michael George
| Michael George![]()
© 2024 The authors. This article is published by IIETA and is licensed under the CC BY 4.0 license (http://creativecommons.org/licenses/by/4.0/).
OPEN ACCESS
Glaucoma is an incapacitating eye disease that can result in total vision loss if left untreated, making early treatment through screening more likely to prevent irreversible visual impairment and delay. Unfortunately, however, due to complex testing procedures and healthcare professional shortages often resulting in delays- contributing to an increasing global incidence of blindness. Also, with an estimated 76 million people affected by glaucoma worldwide, recent statistics highlight the need of addressing this prevalent condition. To combat these challenges and enhance manual methods further it is urgently required that a reliable framework be created for early detection of lesions on Optic Cup and Optic Disc with characteristics overlapping with variations in eye colour making accurate diagnosis even more challenging. At present, we present an automated system for the detection of Glaucoma. The model we present begins by pre-processing retinal images using advanced techniques like histogram equalization and Contrast Limited Adaptive Histogram Equalization (CLAHE), designed to improve image quality and analysis. Next U-Shape Network technique (UNet++) used for discs and cups segmentation separately; this segmentation technique offers accurate identification. Segmented optic disc and optic cup images are then utilized in our glaucoma diagnosis stage. We employ Capsule Network, a deep learning technique renowned for recognizing complex patterns, to detect glaucoma and it handles of complicated spatial relationships in an effective manner, solving such restrictions that are present in CNN. Comprehensive performance evaluation metrics were devised and 5-fold Cross validation was performed to verify our method, which demonstrated its superiority over existing methods with an overall accuracy rate of 97.89%. This high rate of precision highlights how automated framework can detect early signs of glaucoma for early intervention as well as reduce risks such as irreversible loss of vision for patients.
histogram equalization (HE), contrast limited adaptive histogram equalization (CLAHE), U-shape network (UNet++), capsule network (CapsNet)
Glaucoma, an eye disorder caused by an abnormal balance of fluid in the eye, occurs when there is an imbalance of fluid within it and this results in increased intraocular pressure that damages nerve cells responsible for vision [1]. Glaucoma progression can cause various symptoms including eye pain, severe migraines, vision issues or permanent vision loss; but rest assured this form of sight loss can be effectively treated through medical or surgical means [2]. Early in glaucoma's progression, medical procedures and methods have proven themselves successful at curing it [3-5]. Unfortunately, current techniques can take long to produce satisfactory results due to a shortage of ophthalmologists at hospitals; manual detection processes also depend heavily on expertise and knowledge of examiners which could result in misclassifications or inaccurate diagnoses [6]. The direct analysis of 3D Optical Coherence Tomography (OCT) volumes enables deep learning models (DL) to learn spatial structural information and discover new bio-markers that relevant to glaucoma [7].
Implementing a technique that accurately and efficiently detects glaucoma is of utmost importance, and one such effective approach is the Discrete Wavelet Transform (DWT) [8]. Dynamic Time Warspinning (DTW), though widely employed, has limited applicability due to its non-adaptive nature and non-dyadic scaling; methods using Dyadic DTW cannot compensate for constant time-frequency cover variance shifts or signal independence while also suffering with various frequency issues. Empirical Wavelet Transform (EWT), often used early-stage diagnosis is limited by computational complexity and mode mixing issues that limit its usefulness as early-stage detection tools [9]. For determining the vertical diameter of Optic Cup and Optic Disc, a ratio of both the features is utilised also that leads for effective screening tests. When colour changes between an optical cup and optic rim are large, blood vessels become dense within the visual field and division of disc and optic cup becomes complex and time consuming; manual segmenting may also prove time consuming [10]. Automated segmentation techniques are used to address these difficulties. These approaches utilize active contour-based and thresholding algorithms to detect glaucoma. Thresholding techniques can generate binary images based on single or multichannel images; however, thresholding may prove challenging when segmenting fundus images due to low contrast levels.
Contour-based techniques use a series of points to define the edges of an optic disc or cup, thus reducing energy function but being susceptible to being captured by local minima resulting in suboptimal outcomes [11]. Initializing this method of detection is key for optimal performance of detection. Glaucoma is an eye disease caused by fluid imbalance. This results in increased pressure within the eye and nerve cell damage. Manual detection may be difficult due to limited ophthalmologists; automated techniques like the DWT, optic cup and disk segmentation and the DWT provide more accurate and efficient diagnosis; however, certain limitations must be overcome such as low contrast images and computational complexity for increased effectiveness of such techniques [12, 13].
Recent years have seen an increased usage of deep learning techniques to segment optic disc and cup images, which drastically reduce computation time. Convolutional networks were used successfully for disc and cup segmentation within optical systems, using RIMONE dataset as its model proving successful results with high scoring disc segmentation demonstrating its efficacy [14, 15].
Fundus images have been segmented using a convolutional neural networks technique based on ensemble learning to detect glaucoma. This two-step technique extracts ROI (Region-of-Interest) from fundus images before segmenting retinal optical discs within them. M-Net combined with polarization has proven highly efficient at increasing efficiency. Prior to testing or training using M-Net, the disc-centered area undergoes polarization in order to optimize subsequent stages [16]. However, while most deep learning techniques only concentrate on extracting discs, taking both cup and disc segmentation into account during extraction can significantly improve initial-stage detection accuracy.
Recently a deep learning-based glaucoma detector that incorporates both cup and disc segmentation has been developed [17], which encompasses of UNet++ and ResNet for effective detection and classification of glaucoma with high accuracy. Such advanced deep learning architectures are an integral part of diagnosing glaucoma. The renowned contributions of deep learning techniques in diagnosing glaucoma are given below.
Finally, Capusle Network (CapsNet) is adapted for an effective classification of glaucoma.
AG-CNN, or Attention-Based Convolutional Neural Network is used [18], as a deep learning technique to detect Glaucoma. The AG-CNN was expanded to incorporate three subnetworks, an attention-efficient network, glaucoma classification network and localization of pathological areas. A manual training session identified salient areas for segmenting of glaucoma. Attention maps were calculated in the detection subnet, using an AG-CNN technique to increase detection performance with high performance; its performance was then compared against that of other CNN techniques that focus on attention. AG-CNN results were compared with other current glaucoma segmentation techniques.
A fully automated framework based on fundus images in 2021 is developed by Song et. al. [19]. CNN method took into account various theories such as DOE, analysis of function loss, and some other various approaches for enhancing the fundus image flash efficacy. Their model outshone other automatic glaucoma diagnosis approaches. Parashar, Agrawal and al. decided on using the basic CNN technique in order to compare ResNet152 and GoogLeNet deep CNNs, with clear mathematical notations and intuitive graphs making results easily memorable for others.
Parashar and Agrawal [20] reported on an effective method for detecting glaucoma disease at three stages, namely early, healthy, and advanced stages, using 2-D Compact Variational Modification Decomposition (2-D C-VMD). For this approach, images were first disassembled into Variation Modes before applying 2-D C-VMD on them. After extracting features, those features were utilized to enhance glaucoma detection technique and dimension reduction was accomplished using Linear Discriminant Analysis method. Glaucoma was classified using Multiclass Least Squares- Support Vector Machine (MCLS-SVM). Classifiers from this algorithm have been utilized to complete classification. Furthermore, two public databases were tested as an accurate way of detecting glaucoma. Results and performance from tests and implementation were then compared with other techniques, and it was discovered that the implemented method produced better results than state-of-the-art approaches.
A novel Glaucoma Classifier was developed [21] using 2-D Tensor Empirical Wavelet Transform (2D-TEWT). The initial step involved applying 2D-T EWT before subdividing images into Sub-Band Images for further processing. Second, SBIs were analysed in order to extract certain features such as chip histograms, moment invariants and texture-based "Grey Level Co-Occurrence Matrix" (GLCM). Robust features were prioritized over less robust ones through student's algorithm ranking. MC-LS was used by the student to classify glaucoma diseases. Results demonstrated high performance when compared with state-of-the-art techniques, while its proposed model provided good accuracy compared with these approaches by using tenfold cross validation.
Islam et al. [22] conducted a 2022 study on the automatic classification of glaucoma using deep learning methods. Their team employed MobileNet and GoogLeNet deep learning algorithms; EfficientNet was used to crop optic disc and cup images with outstanding results based on various evaluation metrices. U-net segmented fundus images in high resolution datasets by segmenting blood vessels using U-net technology and stored these in another dataset as stored images; their proposed model outperformed other techniques in segmenting eye fundus images in order to detect glaucoma earlier.
Devecioglu et al. [23] used Self-Organized Operational Neural Networks techniques for early glaucoma detection using eye fundus pictures. They evaluated this model's performance against that of standard CNN methods using three benchmark datasets to demonstrate its suitability in biomedical applications; their proposed method demonstrated impressive segmentation results for segmenting glaucoma and retinal diseases with low error rates and reduced computation time. Masot et al. In 2020, Civit-Masot et al. [24] conducted research using testing and training subsystems to develop an approach for detecting glaucoma. Their first subsystem used machine-learning to detect discs or cups independently while their second used well-trained CNN techniques to segment imagesfrom optic funduses - in combination, both results were combined for improved glaucoma detection; their model proved superior to other existing models for detecting related retinal diseases while offering valuable solutions for optopathologists wanting to modify retinal information associated with disease.
Yu et al. [25] used U-Net technology to develop a tool capable of segmenting glaucoma macular disease. They integrated it with ResNet-34 pre-trained technique by adding encoder- and decoder layers, without using pre-training or fine-tuning with RIM-ONE datasets and DRISHTI GS datasets but achieved comparable results to state-of-the-art techniques such as pre-training or fine-tuning techniques; their approach produced comparable results without pre-training or fine-tuning techniques; their approach produced comparable results as state-of-the-art techniques without pre-training or fine-tuning; by combining U-Net with ResNet, this combination offered advantages like faster processing and training without starting from scratch which helped ensure accuracy during segmentation for glaucoma segmentation.
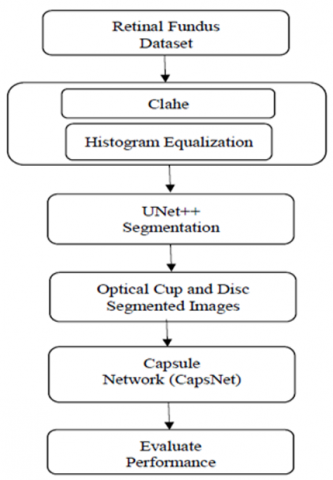
Manual Glaucoma Diagnosis can be both time consuming and costly; most existing automated Glaucoma diagnostic techniques either do not perform adequately, or lack statistical robustness tests. Hence, our proposed work developed an improved deep learning glaucoma detection model, which was clearly explained in the following sections in Figure 1.
Figure 1. Proposed workflow
3.1 Retinal fundus image pre-processing
Pre-processing images is used to improve their quality, with any noise removed and images cleaned up for detection processes. Pre-processing reduces training times as a result. In preprocessing, image resizing, image cropping, and Rotation, horizontal and vertical folding, affine transformation. Then, we have adopted Histogram Equalization (HE) technique and Contrast Limited Adaptive Histogram Equalization (CLAHE) which paving as suitable pre-processing tools for retinal fundus images for pre-processing purposes.
Image Resizing: The technique of resizing images to a uniform size simplifies the process of standardized the input dimensions, which in turn makes it simpler for the model to process them. Utilizing libraries such as PIL is one way to accomplish this.
Image Cropping: It is possible to increase the effectiveness of the model and reduce noise by removing sections of the image that are not significant or by concentrating on particular regions of interest (ROI).
Rotation: There is a probability of 0.5 that this operation will be used for randomized rotation of the image that is being input.
Horizontal and Vertical Folding: When applied to the input image, a randomly selected horizontal or vertical folding operation is carried out with a chance of 0.5, and the outcomes is taken for future processing.
Affine Transformation: A random value in the interval [-A, A] is included in the vertical and horizontal positions of these three points in order to generate three points in the new position, where A is the affine shift factor. When this is done, the first step is to choose three random points from the original image that is going to be processed.
3.1.1 Histogram Equalization (HE)
Histogram Equalization (HE) is an image enhancement method which ensures all grey levels have an equal opportunity of occurring, improving image quality by adjusting brightness and contrast in low-contrast pictures [26]. Dark images typically feature histograms that lean toward darker areas due to an imbalanced distribution of image data; by redistributing Gray levels in these darker regions more evenly distributed histogram can result in clearer images with improved visibility thereby aiding clarity enhancing within digital images comprising intensity levels from 0 through 1, they provide greater clarity of images which improve clarity with regards to clarity as compared with analog histograms based on continuous functions which measure data distribution between intensity levels from 0 through 1.
$g\left(t_j\right)=m_j$ (1)
From Eq. (1), the value of intensity and range of pixels is given as tj and mj respectively. Histograms are often normalized based on the number of pixels present in an image, for instance an M×N image would produce a normalized histogram that corresponds with the probability that tj exists as shown by Eq. (2).
$q\left(t_j\right)=\frac{m_j}{M * N}$ (2)
3.1.2 Contrast Limited Adaptive Histogram Equalization (CLAHE)
Adaptive Histogram Equalization (AHE), has been developed as an enhanced version of Histogram Equalization. AHE works on small patches or regions within an image to increase local contrast enhancement. AHE enhances local edges and contrast by adapting to specific distributions of pixel intensities in each region, without depending on global image information [27]. However, AHE may amplify noise within images. Contrast Limited Adaptive Histogram Equalization, or CLAHE, has been developed as a solution to this issue. CLAHE utilizes similar principles as AHE but includes an enhancement threshold parameter which limits how much is enhanced per region. CLAHE produces more natural images than those enhanced using traditional histogram equality (HE). HE can sometimes oversaturate certain regions in an X-ray image; CLAHE addresses this by performing its conversion process in HSV space. CLAHE preserves hue and saturation of value components similar to human color perception. To redistribute gray levels evenly within cropped pixels, its histogram of original image is cropped before each pixel's value is reduced by an amount user-selectable by CLAHE; finally, the image is converted from HSV color space into RGB space for display [28].
3.2 UNet++ segmentation
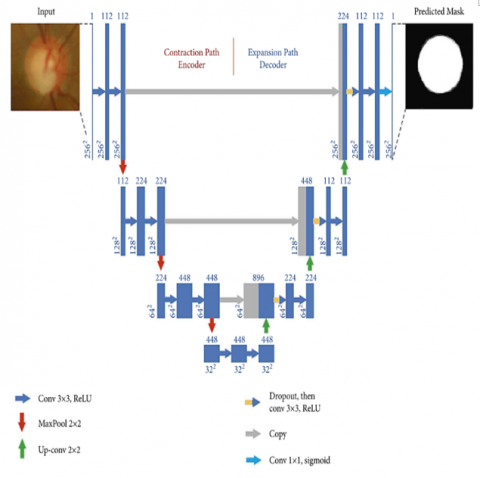
Due to its unique architecture, which improves feature extraction and skip connections, UNet++ has earned a broad following in image segmentation. This has led to increased segmentation performance, which has led to the achievement of this popularity. Deep supervision and layered skip routes are introduced into the model, which makes it possible to gather multi-scale contextual information. This information is essential for correct segmentation of objects that vary in size and shape. When it comes to segmentation tasks, UNet++ is a preferred choice in relation to other deep learning segmentation approaches because of its versatility and its capacity to handle complex structures.
UNet++ utilizes g(tj) and q(tj) to perform image segmentation, specifically targeting disc and optic cup segmentation. Image segmentation, or the practice of separating images into foreground and background layers, is an essential task in computer vision. UNet++, a network model built upon deep learning, is especially adept at segmenting medical images. The model uses deep learning to process retinal fundus images as input images before producing mask images that highlight optic cups; furthermore, this deep learning method is used to segment and crop optical disc images [29].
Pre-processing the ground truth image to convert it to PNG format is essential for accurate segmentation with UNet++; its two paths: contracting on the left and expansive on the right - are utilized with convolutional layers using filter banks and 3×3 padding convolutions to segment each layer. Then, 3-blocks of convolutions appear in both expanding and contracting paths, each using 2×2 convolutional layer pools for contracting paths and 2×2 layers of upsampling for expansive paths respectively. Two additional convolutional layers connect contracting and expanding paths; these ultimately form one 1x1 output layer each time [30].
In this model, there are various filter configurations for expanding and contracting paths. Contracting path has 112, 224, 448 filter configurations while path of expansion has given in the filter such as 224, 122, 122 in total with the convolutional layer also having 448 filters. UNet++ model excels in segmenting medical images, particularly retinal fundus images or the segmentation of an Optic Cup and Optic Disc.
Figure 2. UNet++ architecture for segmentation of Optic Cup and Optic Disc
3.2.1 Optic Cup and Optic Disc Segmentation
UNet++ -based optic disc and cup segmentation uses pre-processed images g(tj) and q(tj) as input; UNet++'s powerful segmentation technique delivers faster results, lower computational complexity and is particularly helpful when segmenting retinal images. UNet++ segments the disc along the boundary between its surface and retina using multilevel image segmentation techniques; its output of optical disc segmentation consists of g(tj) and q(tj).
Segmenting of optic cups is vital in providing information about optic nerve cells. Since optic cups have an elliptic shape, a closed operation was employed for their boundary operation to concave angles and allow segmentation of slicker regions. UNet++ Model uses erosion, dilation and pixel point fusion operations to separate retinal images before loss function calculation through circular structure elements - these operations produce output such as g(tj) and q(tj). In Figure 2 represents UNet++ architecture used for Optic Disc and Optic Cup Segmentation respectively.
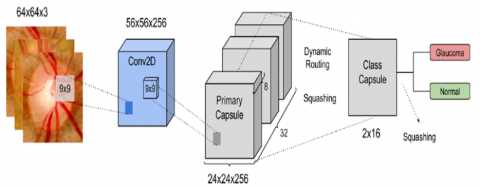
3.3 Capsule Network (CapsNet)
Capsule Network (CapsNet) consist of multiple layers, with each layer housing many Capsules representing instances of an image at specific locations and each neuron representing the probability that such instances exist. Their length corresponds to their likelihood.
Similar to conventional Convolutional Neural Networks (CNN), each Capsule ‘j’, defined by its instantiation parameter vj, strives to predict the outputs of Capsules in subsequent layers by employing a trainable weight matrix Zij. Through this relationship between Capsule ‘j’ and those in subsequent layers' Capsules established through this weight matrix, information and predictions can easily spread throughout the network represented in Figure 3.
Figure 3. Capsule network (CapsNet) for effective Classification of Glaucoma
$\hat{v}_{i \mid j}=Z_{j i} v_i$ (3)
From Eq. (3), Capsule Network (CapsNet) represents predictions from one Capsule (i) for another Capsule (j), in terms of their prediction coefficient, as $\widehat{v}_{i \mid j}$. However, actual output (sj) from Capsule j is determined via routing by Agreement process which utilizes coefficient weighting as weighted sum of predictions from different Capsules; eventually this determines its final output from Capsule (j).
$x_{i j}=\hat{v}_{i \mid j}$ (4)
$y_{i j}=y_{i j}+b_{i j}$ (5)
$D_{i j}=\frac{\exp \left(y_{i j}\right)}{\sum_k \exp \left(y_{i m}\right)}$ (6)
$q_j=\sum{ }_i{ }_j c_{j i} \hat{v}_{i \mid j}$ (7)
Capsule Network (CapsNet) distinguishes itself from traditional CNNs by using "Routing by Agreement," an innovative technique for identifying spatial relations within input data sets. Predictions that match outputs are marked with an agreement score called ‘xij’ while individual predictions receive scores called ‘Dij’ to indicate how each contributed to final outputs. Through "Routing by Agreement," CapsNet stands out from its competition by being able to detect spatial relationships among various elements within input files.
The loss function with respect to CapsNet is determined using lossc and the associated functions with capsule ‘c’ is determine as follows:
$\begin{aligned} & \operatorname{loss}_c=T_c \max \left(0, n^{ \pm}\left\|\boldsymbol{q}_c\right\|\right)^2 +\lambda\left(1-T_c\right) \max \left(0,\left\|\boldsymbol{q}_c\right\|-n^{-}\right)^2\end{aligned}$ (8)
The following Table 1 clearly stated the list of notations and respective definition used in the below equations.
Table 1. Symbols and definitions
|
Symbols |
Definition |
|
$\widehat{\boldsymbol{v}}_{i \mid j}$ |
Prediction coefficient |
|
sj |
Actual output |
|
$q_j$ |
Predicted output |
|
$b_{i j}$ |
Bias |
|
xij |
Agreement scores of each capsule |
|
Dij |
Individual predictions receive scores of every capsule |
|
$T_c$ |
Summation of entire capsules used in the network |
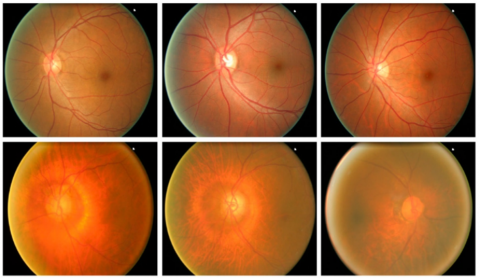
Exhaustive experiments were performed to test our method's ability in identifying and classifying cases of glaucoma. Here we discuss in depth their results, using publicly available ORIGA database as well as Matlab to implement our approach and assess its dimensional stability. The ORIGA database features 650 samples in total, of which 168 depict regions affected by glaucoma in human eyes while 482 represent healthy ones. Unfortunately, due to various artifacts present within its samples - such as variations in size, color, position and texture of Optic Disc (OD) and Optic Cup (OC) structures-classification becomes extremely challenging. Furthermore, images in the dataset present distortions such as noise blurring noise color changes intensity variations among others - some examples can be seen in Figure 4.
Figure 4. Sample image from the dataset [31]
For training and testing purposes, we split our data in an 80:20 ratio, allocating 80% of samples for training the model while 20% were set aside as performance measures.
Numerous evaluation metrices including accuracy, precision, recall, sensitivity, specificity and F1-score are utilised in order to determine the efficacy of the proposed approach. All the evaluation metrices used in the present research is in the following Eq. (9), Eq. (10), and Eq. (11).
$\begin{aligned} & \text { Accuracy } =\frac{\sum \text { True Positive, True Negative }}{\sum \text { True Positive,True Negative, False negative, Fale Positive }}\end{aligned}$ (9)
Precision $=\frac{\text { True Positive }}{\sum \text { True Positive, False Positive }}$ (10)
Recall $=\frac{\text { True Positive }}{\sum \text { True Positive, False Negative }}$ (11)
Accurate identification of lesions on optical disc heads is necessary in order to develop a computer-aided method for detecting and classifying regions with glaucoma. We conducted an experiment in order to evaluate the localization capabilities of a UNet++ model based on stacked attention, using ORIGA dataset as our basis of evaluation.
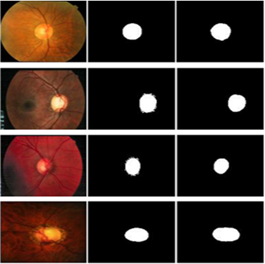
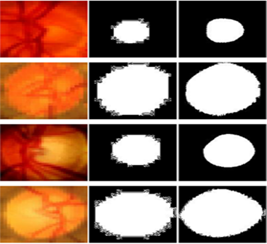
Figure 5 depicts the outcomes of our experiments conducted using this approach. The UNet++ model we propose is highly accurate in diagnosing lesions to the optic disc, optic cup, regardless of size and position, while also handling any distortions such as blurring, color variations and brightness differences that commonly appear in samples - which demonstrates its robustness in detecting and classifying glaucoma. The UNet++ segmented output results are given in Figure 5 (a-f).
(a) (b) (c)
(d) (e) (f)
Figure 5. (a) Test Image of Optic Disc, (b) Ground Truth Image, (c) Segmented Optic Disc using UNet++, (d) Test Image of Optic Cup, (e) Ground Truth Image, (f) Segmented Optic Cup using UNet++
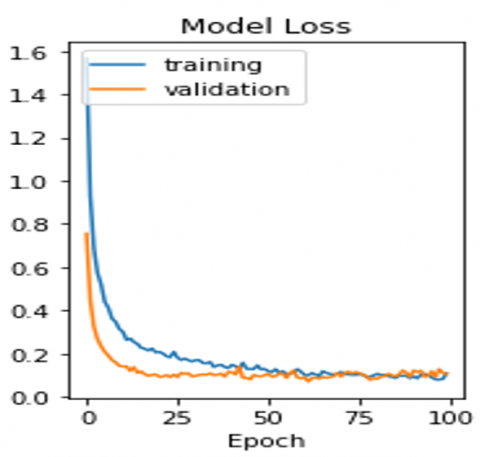
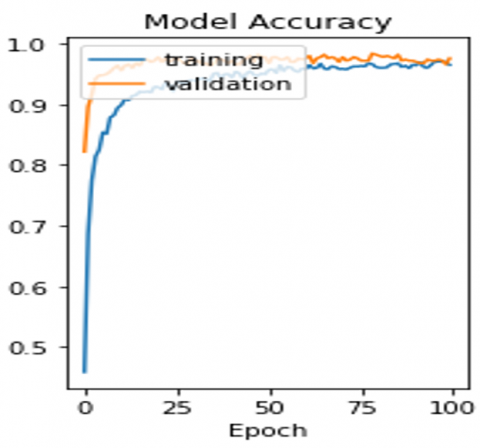
After segmentation of optical cup and optic disc, Capsule Network (CapsNet) is used for effective classification of glaucoma. Accuracy and loss model are represented in Figure 6 and Figure 7 respectively.
Figure 6. Accuracy of Proposed Model
Figure 7. Loss of Proposed Model
To validate our method for identification and classification of glaucoma, we conducted an intensive comparative evaluation with other state-of-the-art techniques using the same dataset. To ensure objectivity in our evaluation process, we compared results obtained using our approach with those documented by references [22, 31-35].
In Table 2, presents quantitative comparison metrics achieved for evaluation metrics used during this comparison process and thus allows us to measure effectiveness as well as superiority over other approaches currently available.
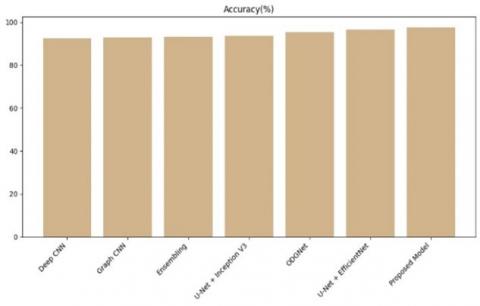
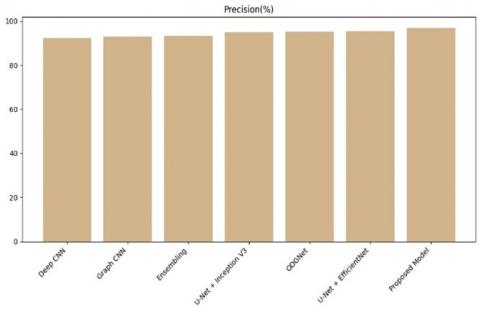
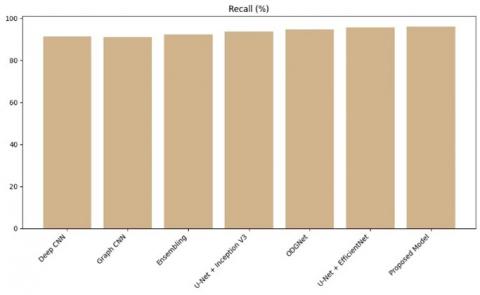
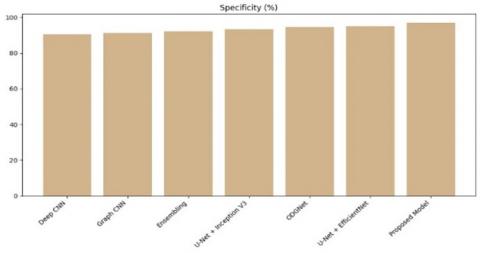
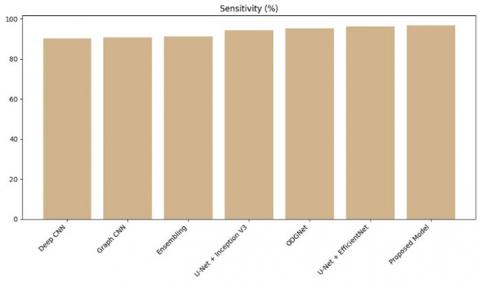
Also, the respective Comparison Graph is given in Figure 8, Figure 9, Figure 10, Figure 11, and Figure 12.
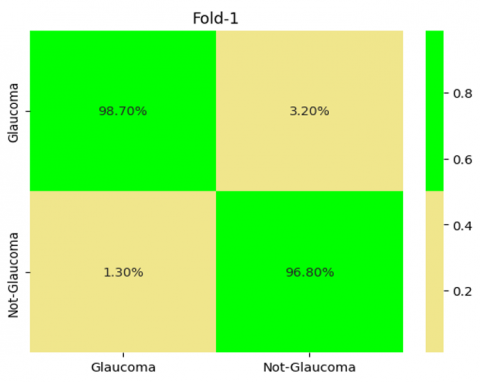
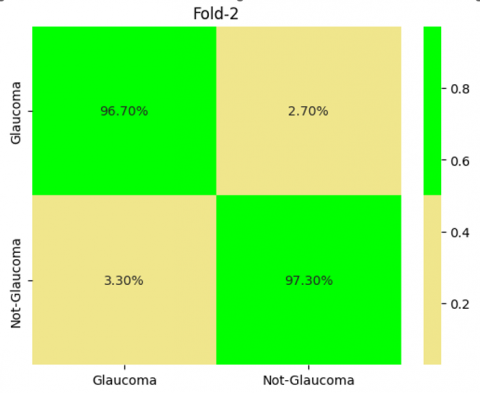
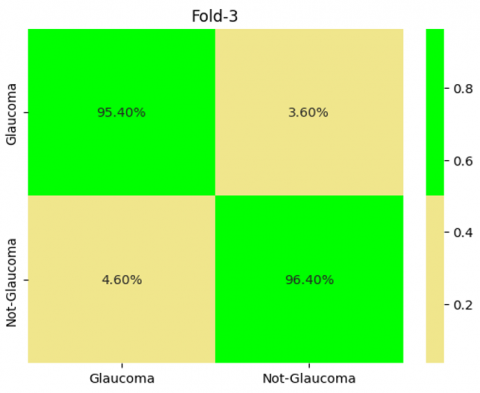
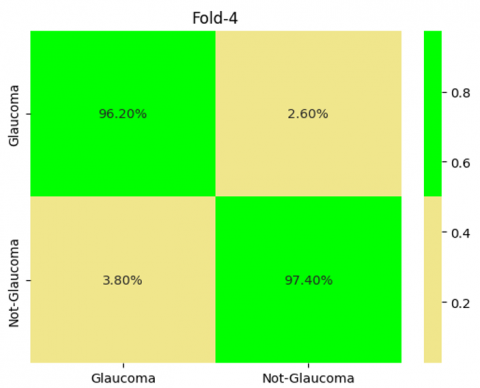
In Figure 13 demonstrates the Outcomes of 5-Fold Validation technique, from that it was clearly shown the performance of our proposed model in each folds.
Table 2. Performance comparison of proposed approach over existing technique
|
Methods |
Accuracy (%) |
Precision (%) |
Recall (%) |
Specificity (%) |
Sensitivity (%) |
|
Deep CNN[32] |
92.5 |
92.3 |
91.3 |
90.4 |
90.3 |
|
Graph CNN[33] |
92.9 |
92.9 |
91.2 |
91.3 |
90.8 |
|
Ensembling [34] |
93.1 |
93.2 |
92.3 |
92.3 |
91.1 |
|
U-Net+ Inception V3 [35] |
93.6 |
94.9 |
93.7 |
93.3 |
94.2 |
|
ODGNet[31] |
95.2 |
95.1 |
94.6 |
94.5 |
95.3 |
|
U-Net+ EfficientNet [22] |
96.5 |
95.3 |
95.7 |
95.1 |
96.3 |
|
Proposed Model |
97.6 |
96.9 |
96.2 |
97.1 |
96.8 |
Figure 8. Accuracy comparison of proposed model over existing
Figure 9. Precision comparison of proposed model over existing
Figure 10. Recall comparison of proposed model over existing
Figure 11. Specificity comparison of proposed model over existing
Figure 12. Sensitivity comparison of proposed model over existing
Figure 13. Outcome of cross validation technique
To detect glaucoma in fundus samples, trained professionals are required who can discern subtle visual differences and categorize the images accordingly. The complexity of glaucomatous regions, coupled with the difficulty of accessing domain specialists, necessitates a fully automatic system. This paper presents a Hybrid Approach aimed at effective segmentation of Glaucoma disease. The proposed method uses UNet++ to segment the optic disc and optic cup in fundus images which uses nested skip pathways and deep supervision, enabling the capture of multi-scale contextual information crucial for accurate segmentation. Then CapsNet used for accurate classification of fundus images also, it handles complicated spatial relationships in an effective manner, solving such restrictions that are present in CNN, and paves the way for yielding reliable results. Our approach is remarkably accurate, achieving 97.6% accuracy, which surpasses alternative methods. Followed by that, U-Net+ EfficientNet and ODGNet reports the high-performance accuracy rate such as 96.5% and 95.2% respectively. The integration of Generative Adversarial Networks has the potential to reduce the scarcity and cost of datasets. Our method can also be applied to other datasets that are publicly available.
[1] Yousefi, S., Goldbaum, M.H., Balasubramanian, M., Medeiros, F.A., Zangwill, L.M., Liebmann, J.M., Girkin, C.A., Weinreb, R.N., Bowd, C. (2014). Learning from data: Recognizing glaucomatous defect patterns and detecting progression from visual field measurements. IEEE Transactions on Biomedical Engineering, 61(7): 2112-2124. https://doi.org/10.1109/TBME.2014.2314714
[2] Kim, P.Y., Iftekharuddin, K.M., Davey, P.G., Tóth, M., Garas, A., Holló, G., Essock, E.A. (2013). Novel fractal feature-based multiclass glaucoma detection and progression prediction. IEEE Journal of Biomedical and Health Informatics, 17(2): 269-276. https://doi.org/10.1109/TITB.2012.2218661
[3] Yousefi, S., Goldbaum, M.H., Balasubramanian, M., Jung, T.P., Weinreb, R.N., Medeiros, F.A., Zangwill, L.M., Girkin, C.A., Bowd, C., (2014). Glaucoma progression detection using structural retinal nerve fiber layer measurements and functional visual field points. IEEE Transactions on Biomedical Engineering, 61(4): 1143-1154. https://doi.org/10.1109/TBME.2013.2295605
[4] Cheng, J., Yin, F., Wong, D.W.K., Tao, D., Liu, J. (2015). Sparse dissimilarity-constrained coding for glaucoma screening. IEEE Transactions on Biomedical Engineering, 62(5): 1395-1403. https://doi.org/10.1109/TBME.2015.2389234
[5] Vermeer, K.A., Vos, F.M., Lo, B., Zhou, Q., Lemij, H.G., Vossepoel, A.M., Van Vliet, L.J. (2006). Modeling of scanning laser polarimetry images of the human retina for progression detection of glaucoma. IEEE Transactions on Medical Imaging, 25(5): 517-528. https://doi.org/10.1109/TMI.2006.871433
[6] Niwas, S.I., Lin, W., Kwoh, C.K., Kuo, C.C.J., Sng, C.C., Aquino, M.C., Chew, P.T. (2015). Cross-examination for angle-closure glaucoma feature detection. IEEE Journal of Biomedical and Health Informatics, 20(1): 343-354. https://doi.org/10.1109/JBHI.2014.2387207
[7] George, Y., Antony, B.J., Ishikawa, H., Wollstein, G., Schuman, J.S., Garnavi, R. (2020). Attention-guided 3D-CNN framework for glaucoma detection and structural-functional association using volumetric images. IEEE Journal of Biomedical and Health Informatics, 24(12): 3421-3430. https://doi.org/10.1109/JBHI.2020.3001019
[8] Mary, V.S., Rajsingh, E.B., Naik, G.R. (2016). Retinal fundus image analysis for diagnosis of glaucoma: A comprehensive survey. IEEE Access, 4: 4327–4354. http://hdl.handle.net/10453/122945
[9] Manikandan, J., Devakadacham, S.R., Shanthalakshmi, M., Raj, Y.A., Vijay, K. (2023). An efficient technique for the better recognition of oral cancer using support vector machine. In 2023 7th International Conference on Intelligent Computing and Control Systems (ICICCS), pp. 1252-1257. https://doi.org/10.1109/ICICCS56967.2023.10142687
[10] Cheng, J., Liu, J., Xu, Y., Yin, F., Wong, D.W.K., Tan, N.M., Tao, D., Cheng, C.Y., Aung, T., Wong, T.Y. (2013). Superpixel classification based optic disc and optic cup segmentation for glaucoma screening. IEEE Transactions on Medical Imaging, 32(6): 1019-1032. https://doi.org/10.1109/TMI.2013.2247770
[11] Parashar, D., Agrawal, D.K. (2020). Automated classification of glaucoma stages using flexible analytic wavelet transform from retinal fundus images. IEEE Sensors Journal, 20(21): 12885-12894. https://doi.org/10.1109/JSEN.2020.3001972
[12] Maheswari, C., Lokku, G., Nagi Reddy, K. (2022). Detection of glaucoma using HMM segmentation and random forest classification. In Inventive Systems and Control: Proceedings of ICISC 2022, pp. 585-597. https://doi.org/10.1007/978-981-19-1012-8_39
[13] Lucas, P., Oscar, J. P., Xavier, B., Benoit, H., Sebastian, O., and Maria, A. Z., (2022). Multi-task deep learning for glaucoma detection from color fundus images. scientific reports, 12: 12361.
https://doi.org/10.1038%2Fs41598-022-16262-8
[14] Shankaranarayana, S.M., Ram, K., Mitra, K., Sivaprakasam, M. (2017). Joint optic disc and cup segmentation using fully convolutional and adversarial networks. In Fetal, Infant and Ophthalmic Medical Image Analysis: International Workshop, FIFI 2017, and 4th International Workshop, OMIA 2017, Held in Conjunction with MICCAI 2017, Québec City, QC, Canada, September 14, Proceedings 4, pp. 168-176. https://doi.org/10.1007/978-3-319-67561-9_19
[15] Manikandan, J., Yogeshkumar, R. (2023). Glaucoma Disease detection using hybrid deep learning model. In 2023 Eighth International Conference on Science Technology Engineering and Mathematics (ICONSTEM), pp. 1-7. https://doi.org/10.1109/ICONSTEM56934.2023.10142668
[16] Sevastopolsky, A. (2017). Optic disc and cup segmentation methods for glaucoma detection with modification of U-Net convolutional neural network. Pattern Recognition and Image Analysis, 27: 618-624. https://doi.org/10.1134/S1054661817030269
[17] Fu, H., Cheng, J., Xu, Y., Wong, D.W.K., Liu, J., Cao, X. (2018). Joint optic disc and cup segmentation based on multi-label deep network and polar transformation. IEEE Transactions on Medical Imaging, 37(7): 1597-1605. https://doi.org/10.1109/TMI.2018.2791488
[18] Li, L., Xu, M., Liu, H., Li, Y., Wang, X., Jiang, L., Wang, Z.L., Fan, X., Wang, N. (2019). A large-scale database and a CNN model for attention-based glaucoma detection. IEEE Transactions on Medical Imaging, 39(2): 413-424. https://doi.org/10.1109/TMI.2019.2927226
[19] Song, W.T., Lai, C., Su, Y.Z. (2021). A statistical robust glaucoma detection framework combining retinex, CNN, and DOE using fundus images. IEEE Access, 9: 103772-103783. https://doi.org/10.1109/ACCESS.2021.3098032
[20] Parashar, D., Agrawal, D. (2021). 2-D compact variational mode decomposition-based automatic classification of glaucoma stages from fundus images. IEEE Transactions on Instrumentation and Measurement, 70: 1-10. https://doi.org/10.1109/TIM.2021.3071223
[21] Parashar, D., Agrawal, D.K. (2020). Automatic classification of glaucoma stages using two-dimensional tensor empirical wavelet transform. IEEE Signal Processing Letters, 28: 66-70. https://doi.org/10.1109/LSP.2020.3045638
[22] Islam, M.T., Mashfu, S.T., Faisal, A., Siam, S.C., Naheen, I.T., Khan, R. (2021). Deep learning-based glaucoma detection with cropped optic cup and disc and blood vessel segmentation. IEEE Access, 10: 2828-2841. https://doi.org/10.1109/ACCESS.2021.3139160
[23] Devecioglu, O.C., Malik, J., Ince, T., Kiranyaz, S., Atalay, E., Gabbouj, M. (2021). Real-time glaucoma detection from digital fundus images using self-onns. IEEE Access, 9: 140031-140041. https://doi.org/10.1109/ACCESS.2021.3118102
[24] Civit-Masot, J., Domínguez-Morales, M.J., Vicente-Díaz, S., Civit, A. (2020). Dual machine-learning system to aid glaucoma diagnosis using disc and cup feature extraction. IEEE Access, 8: 127519-127529. https://doi.org/10.1109/ACCESS.2020.3008539
[25] Yu, S., Xiao, D., Frost, S., Kanagasingam, Y. (2019). Robust optic disc and cup segmentation with deep learning for glaucoma detection. Computerized Medical Imaging and Graphics, 74: 61-71. https://doi.org/10.1016/j.compmedimag.2019.02.005
[26] Veluchamy, M., Subramani, B. (2019). Image contrast and color enhancement using adaptive gamma correction and histogram equalization. Optik, 183: 329-337. https://doi.org/10.1016/j.ijleo.2019.02.054
[27] Zimmerman, J.B., Pizer, S.M., Staab, E.V., Perry, J.R., McCartney, W., Brenton, B.C. (1988). An evaluation of the effectiveness of adaptive histogram equalization for contrast enhancement. IEEE Transactions on Medical Imaging, 7(4): 304-312. https://doi.org/10.1109/42.14513
[28] Manikandan, J., Shyni, S.A., Dhanalakshmi, R., Akshaya, S.V., Dharshini, S. (2023). Segmentation and detection of pneumothorax using deep learning. In 2023 7th International Conference on Intelligent Computing and Control Systems (ICICCS), pp. 468-473. https://doi.org/10.1109/ICICCS56967.2023.10142364
[29] Tulsani, A., Kumar, P., Pathan, S. (2021). Automated segmentation of optic disc and optic cup for glaucoma assessment using improved UNET++ architecture. Biocybernetics and Biomedical Engineering, 41(2): 819-832. https://doi.org/10.1016/j.bbe.2021.05.011
[30] Lokku, G., Reddy, G.H., Prasad, M.G. (2022). OPFaceNet: Optimized face recognition network for noise and occlusion affected face images using hyperparameters tuned convolutional neural network. Applied Soft Computing, 117: 108365. https://doi.org/10.1016/j.asoc.2021.108365
[31] Latif, J., Tu, S., Xiao, C., Ur Rehman, S., Imran, A., Latif, Y. (2022). ODGNet: A deep learning model for automated optic disc localization and glaucoma classification using fundus images. SN Applied Sciences, 4(4): 98. https://doi.org/10.1007/s42452-022-04984-3
[32] El-Hag, N.A., Sedik, A., El-Shafai, W., El-Hoseny, H.M., Khalaf, A.A., El-Fishawy, A.S., Al-Nuaimy, W., El-Samie, F.E.A., El-Banby, G.M. (2021). Classification of retinal images based on convolutional neural network. Microscopy Research and Technique, 84(3): 394-414. https://doi.org/10.1002/jemt.23596
[33] Zhang, G., Pan, J., Zhang, Z., Zhang, H., Xing, C., Sun, B., Li, M. (2021). Hybrid graph convolutional network for semi-supervised retinal image classification. IEEE Access, 9: 35778-35789. https://doi.org/10.1109/ACCESS.2021.3061690
[34] Sikder, N., Masud, M., Bairagi, A.K., Arif, A.S.M., Nahid, A.A., Alhumyani, H.A. (2021). Severity classification of diabetic retinopathy using an ensemble learning algorithm through analyzing retinal images. Symmetry, 13(4): 670. https://doi.org/10.3390/sym13040670
[35] Bilal, A., Zhu, L., Deng, A., Lu, H., Wu, N. (2022). AI-based automatic detection and classification of diabetic retinopathy using U-Net and deep learning. Symmetry, 14(7): 1427. https://doi.org/10.3390/sym14071427