Raga Sri Lakshmi Kakarla![]() | Tejasri Nagarathnam Yaganti
| Tejasri Nagarathnam Yaganti![]() | Mani Krishna Adapa
| Mani Krishna Adapa![]() | Bharath Gopi Krishna Kosuri
| Bharath Gopi Krishna Kosuri![]() | Prasanth Yalla*
| Prasanth Yalla*![]()
© 2024 The authors. This article is published by IIETA and is licensed under the CC BY 4.0 license (http://creativecommons.org/licenses/by/4.0/).
OPEN ACCESS
A robust framework for the early identification and recognition of common tomato leaf diseases, such as Early Blight, Late Blight, and Septoria Leaf Spot, is proposed in this study. This approach combines the Gray Level Co-occurrence Matrix (GLCM) for texture feature extraction with Convolutional Neural Networks (CNNs) for deep learning methodologies. The results corroborate the potential accuracy of the proposed framework. This highlights its capacity to enhance disease management strategies within the agricultural sector. By facilitating early interventions, this system aims to reduce crop losses, optimize resource utilization, and promote sustainability in tomato cultivation. The findings of this research present a cost-effective, efficient, and sustainable solution to the challenges posed by tomato plant diseases, with significant implications for global food security.
tomato plant, feature extraction, detection, prediction, color-based, shape-based, deep learning, texture analysis
The impact of tomato plant diseases on world agriculture and food security is significant. The urgent need for early disease detection and prediction is addressed in this study, which focuses on common problems like Early Blight, Late Blight, and Septoria Leaf Spot in tomato crops. These diseases not only jeopardize crop productivity but also make significant pesticide use necessary, which influences both the economic and environmental sides of tomato farming. With the use of Convolutional Neural Networks (CNNs) and Gray Level Co-occurrence Matrix (GLCM), the research hopes to offer a practical and affordable solution. The accuracy and reliability of disease identification are improved by this novel approach. The innovative integration of deep learning and texture analysis, which provides a comprehensive framework for disease management, distinguishes this research from others. This system enables prompt intervention, reduces crop losses, and optimizes resource use by enabling early detection and prediction. Additionally, it promotes sustainable agriculture practices by lessening the environmental impact brought on by excessive pesticide use. In conclusion, this study offers a novel approach to the problem of tomato plant diseases, with significant ramifications for sustainable agriculture and food security.
1.1 Mechanisms for feature extraction
1.2 Feature extraction methods for plant disease prediction and detection
Table 1. Prediction & detection algorithms
|
Prediction Algorithms |
Detection Algorithms |
|
Decision Tree |
Regional Based Convolutional Neural Networks (RCNN) |
|
Random Forest Tree |
Regional Based Fully Convolutional Neural Networks |
|
Support vector Machine |
Histogram of Oriented Gradients (HOG) |
|
Naive Bayes |
Single Shot Detector (SSD) |
|
KNN |
AlexNet |
|
Artificial Neuarl Networks |
SqueezeNet |
|
Logistic Regression |
Convolutional Neural Networks |
The Table 1 mentioned here refers to the description of the prediction and detection algorithms and its comparison. Moreover, these algorithms let us know the fundamental issues in ML like precision, accuracy and even more.
As per our observations, in most cases, Random Forest gives the best accuracy.
The Table 2 Literature Survey describes about the researchers across the globe done research and spoke about various algorithms, techniques, and its accuracies [1].
Table 2. Literature survey
|
TITLE OF THE PAPER |
AUTHOR |
TECHNIQUES |
YEAR OF PUBLISHED |
ACCURACY |
|
Disease Detection on the leaves of Tomato plants by using Deep Learning. |
Durmuş et al. [1] |
AlexNet SqeezeNet |
2017 |
95.65% 94.3% |
|
Tomato Leaf Disease Detection using Convolutional Neural Networks. |
Tm et al. [2] |
CNN-10Epochs CNN-20Epochs CNN-30Epochs |
2018 |
91.41% 96.52% 97.85% |
|
Image Based Tomato Leaf Disease Detection. |
Kumar et al. [3] |
VGG 16 Le Net ResNet 50 |
2019 |
90.25% 91.27% 92.65% |
|
Leaf Disease Detection using Support Vector Machine. |
Das et al. [4] |
SVM Logistic Regression Random Forest |
2020 |
87.6% 67.3% 70.05% |
|
Automated Image Capturing System for DL Based Tomato Plant Leaf Disese Detection Recognition. |
De Luna et al. [5] |
F-RCNN Automated Image Capturing System |
2018 |
80% 91.67% |
|
Tomato Leaf Diseases Classification Method Based on Deep Learning. |
Jang et al. [6] |
RELU 7X7 I-RELU 7X7 I-REW 11X11 |
2020 |
95.7% 97.3% 98% |
To choose the best feature extraction technique for a particular application, comparative examination of several techniques is crucial. The following variables can be taken into account when comparing feature extraction techniques for identifying and forecasting plant diseases. This will be done with the help of various prediction and detection algorithms (Table 1).
Accuracy:
The correctness of the retrieved features is one of the most important aspects of feature extraction techniques. For the same data collection, different approaches can produce varying degrees of accuracy. So it's crucial to compare the accuracy of several methods and choose the one that offers the best accuracy.
Complexity:
The complexity of the feature extraction method can also impact the effectiveness of the method. The more complex the method, the more difficult it may be to implement, especially for large datasets. Therefore, it is important to consider the complexity of different methods and select a method that can provide a good balance between accuracy and complexity.
Robustness:
Feature extraction methods should be robust to variations in the input data, such as changes in lighting, angle, and background. The method should be able to handle different types of images and produce consistent results. Therefore, it is essential to evaluate the robustness of different methods to variations in the input data [2].
Computation time:
The computation time required for feature extraction can also impact the effectiveness of the method, especially for real-time applications. Therefore, it is essential to consider the
computation time of different methods and select a method that can provide fast results.
Dataset size:
The effectiveness of the feature extraction approach might also be impacted by the amount of the dataset. While some strategies might work best with large datasets, others might work well with smaller ones. Therefore, it is crucial to assess how well various approaches work for various dataset sizes.
4.1 Case studies
Case Study 1: Early Blight Detection in Tomato Plants
Criteria: Accuracy, Computational Complexity, Data Requirements
Context: The disease Early Blight, which damages tomato crops, is widespread and pervasive. For effective disease care, early detection is essential. GLCM and Principal Component Analysis (PCA) were two feature extraction approaches that were taken into consideration by the study team in this scenario.
Weighting the criteria: High precision is a primary priority given the severity of Early Blight. Quick detection is crucial; hence it is preferable to have low computational complexity.
Data Requirements: Due to practical limitations, there is only limited data available.
Results: The accuracy of GLCM was higher (95%) but it used more computing power. PCA was computationally effective and needed less data while achieving a respectable accuracy of 90%. This situation demonstrates the trade-off between precision and computing complexity and emphasizes the significance of taking data needs into account in practical applications.
Case Study 2: Precision Agriculture Wheat Rust Detection
Criteria: Adaptability, computational complexity, and data requirements.
Context: Wheat rust poses a serious threat to crops of wheat in precision agriculture. Systems for detection must be flexible enough to work in many environments. Researchers investigated GLCM, CNNs, and a brand-new texture-based technique for feature extraction [3].
Weighting the criteria: Adaptability is essential in precision agriculture due to the constantly changing environmental circumstances. Low computational complexity is preferred since timely detection is crucial.
Data requirements: Access to a variety of current data.
Results: GLCM performed well in controlled settings but had trouble adapting. CNNs demonstrated adaptability but had more complicated computations. The innovative texture-based approach struck a compromise by offering high accuracy with minimal computational complexity and flexibility to adapt to various field circumstances [4].
The process of choosing and translating pertinent data from raw data into a set of features that can be utilized as input to a machine learning model is known as feature extraction. Here are a few typical machine learning feature extraction techniques:
(PCA): Principal Component Analysis
A dimensionality reduction technique called PCA detects the key characteristics in the data and develops a new collection of features that may capture the most variance. The image is made up of a mixture of rows of pixels that are arranged one after another to create a single image. If you have numerous images, you may create a matrix by treating each row of pixels as a vector.
(LDA): Linear Discriminant Analysis
By identifying the characteristics that may most effectively distinguish between classes, LDA, a supervised dimensionality reduction technique, increases the separation between them. LDA functions by reorganizing the data into a new area where the classes are more clearly divided. Finding a projection that minimizes the variance within each class while maximizing the distance between the means of the classes is the transformation process. As a result, a fresh set of features that can be applied to categorize brand-new instances of the data are created [5].
(ICA): Independent Component Analysis
A method for decomposing a multivariate signal into separate, non-Gaussian components is called ICA. By dividing the signal into independent components that correlate to the many facets of the plant's health, ICA can be used to extract pertinent features from the data in the context of detecting and predicting plant diseases. For instance, ICA can be used to extract the leaf properties that are most useful for disease detection and prediction from a plant's color, texture, and shape features.
The Wavelet Transform:
A mathematical technique for breaking down signals into several frequency components is the wavelet transform. Wavelet transform can also be used to denoise plant photos, get rid of ambiance, and highlight interesting features [6]. The denoised images can then be used for additional categorization and analysis. Wavelet transform is a potent method for signal and picture feature extraction and analysis. It can be combined with other methods like CNN (Convolutional Neural Networks) or SVM (Support Vector Machines) to accurately classify and analyze plant photos for disease diagnosis and prediction.
(CNNs): Convolutional Neural Networks
Commonly employed in computer vision applications, CNNs are a class of neural network that automatically extracts characteristics from unprocessed data.Convolutional Neural Networks have three different kinds of layers:
1) Convolutional Layer: Each input neuron in a conventional neural network is connected to the following hidden layer. Only a small portion of the input layer neurons in CNN are connected to the hidden layer of neurons.
2) Pooling Layer: The pooling layer is used to make the feature map less dimensional. Inside the CNN's hidden layer, there will be numerous activation and pooling layers.
3) Fully Connected Layer: Fully Connected tiers make up the network's final few tiers. The output from the last pooling or convolutional layer is passed into the fully connected layer, where it is flattened before being applied.
RNNs: Recurrent neural networks
Often employed in natural language processing, RNNs are a class of neural network that can detect temporal connections in sequential input.Sequential data can be processed by RNNs, including time-series data on illness progression, environmental factors, and plant growth. Text data, such as descriptions and symptoms of plant diseases, can also be processed using RNNs.RNNs can be applied to both classification and prediction problems. RNNs can be trained to forecast future plant growth or the development of a disease using past data for prediction tasks.
Color-based features:
These features are extracted from the RGB or HSV color space of the images. The color distribution and intensity can provide useful information for identifying diseased plants.
Texture-based features:
The geographic distribution of gray levels in the photographs is quantified as part of the texture analysis process. Plant tissues that are infected and healthy can be distinguished by characteristics like contrast, entropy, and homogeneity.
Shape-based features:
Shape analysis is used to extract features related to the size, geometry, and topology of plant parts. Features such as area, perimeter, and circularity can be used to differentiate between healthy and diseased plants [7].
5.1 Practical applications
Example 1:
Detecting grapevine disease with GLCM Context: Powdery mildew and other grapevine diseases pose a serious threat to the wine industry. To find powdery mildew, scientists have applied GLCM to photos of grapevine leaves. Application: Textural characteristics like contrast, energy, and homogeneity were extracted from pictures of grapevine leaves using GLCM. Then, a machine learning model was trained using these features to distinguish between healthy and infected leaves. The study's accuracy rate of over 90% demonstrates the potency of GLCM in identifying grapevine diseases.
Example 2:
CNNs for Classifying Tomato Disease Method: Convolutional neural networks (CNN Context: Various diseases, such as Early Blight, Late Blight, and Bacterial Spot, can affect tomato crops. It's crucial to recognize problems early to avoid yield loss. Application: To distinguish between healthy and unhealthy tomato leaves, researchers used CNNs. The CNN model developed the ability to recognize visual patterns linked to diseases using a dataset of thousands of photos of tomato leaves. This model outperformed conventional image processing methods, with an accuracy rate of about 95%. In the automatic and precise classification of tomato diseases, CNNs have demonstrated to be quite useful [8].
5.2 Real world applications
There are various difficulties in using methods like Gray Level Co-occurrence Matrix (GLCM) and Convolutional Neural Networks (CNN) for plant disease detection and prediction in practical settings. Variable illumination can influence accuracy and increase noise, necessitating preprocessing and less light-sensitive techniques [9]. The performance of a model might be hampered by varying camera quality and image resolution, demanding high-quality photos and post-processing. Plant species diversity necessitates specialized models and large datasets. It takes a lot of time to manually categorize data, hence automation and crowdsourcing are suggested (Table 3). It is crucial to be resilient to environmental factors like weather and outside settings, which calls for strong models and data preprocessing (Table 4) Large agricultural fields also present computational issues, which are overcome through distributed computers and sophisticated data collection methods (Table 5).
Table 3. Types of percentages of minerals
|
Essential Minerals |
%Deficient |
%Sufficient |
%Excessive |
|
Nitrogen (N) |
<2.50 |
2.50-4.50 |
>6.00 |
|
Phosphorus (P) |
<0.15 |
0.20-0.75 |
>1.00 |
|
Potassium (K) |
<1.00 |
1.50-5.50 |
>6.00 |
|
Calcium (Ca) |
<0.50 |
1.00-4.00 |
>5.00 |
|
Magnesium (Mg) |
<0.20 |
0.25-1.00 |
>1.50 |
|
Sulphur (S) |
<0.20 |
0.25-1.00 |
>3.00 |
|
Boron (B) |
5-30 |
10-200 |
50-200 |
|
Chlorine (Cl) |
<100 |
100-500 |
500-1000 |
|
Copper (Cu) |
2-5 |
5-30 |
20-100 |
|
Iron (Fe) |
<50 |
100-500 |
>500 |
|
Manganese (Mn) |
15-25 |
20-300 |
300-500 |
|
Molybdenum (Mo) |
0.03-0.15 |
0.1-2.0 |
>100 |
|
Zinc (Zn) |
10-20 |
27-100 |
100-400 |
1. Early Blight (Alternaria solani):
- Symptoms: Small dark lesions with concentric rings on tomato leaves; lower leaf yellowing.
- Lifecycle: Overwinters in soil debris; spore transmission.
- Transmission/Spread: Spores carried by rain and wind to healthy leaves.
2. Alternaria Canker:
- Symptoms: Dark, sunken cankers on fruit and leaves.
- Lifecycle: Survives debris and soil; spore transmission.
- Transmission/Spread: Spores spread through rain & wind.
3. Bacterial Canker:
- Symptoms: Bacterial ooze from stem cankers, leaf spots, and fruit lesions.
- Lifecycle: Survives infected plant debris.
- Transmission/Spread: Bacteria enter through wounds or natural openings.
4. Bacterial Speck:
- Symptoms: Tiny, raised, black lesions with a white center on leaves.
- Lifecycle: Bacteria overwinter on debris.
- Transmission/Spread: Water and wind spread bacteria to healthy leaves.
5. Buckeye Rot:
- Symptoms: Rotting fruit with brown, sunken lesions.
- Lifecycle: Spores overwinter in soil.
- Transmission/Spread: Rain splash and contaminated tools spread spores.
6. Bacterial Spot:
- Symptoms: Small, dark, water-soaked lesions on leaves and fruit.
- Lifecycle: Overwinters in plant debris.
- Transmission/Spread: Bacteria transmitted through rain and wind.
The Table 4 refers to various types of illnesses through which the plants get diseases. The types of diseases mentioned the table goes beyond the imagination, which means the illnesses will severely affects the plants and also its roots sometimes.
Table 4. Types of Illnesses
|
TYPES OF DISEASES OF TOMATO PLANT LEAVES |
|
|
Alternaria Canker |
Verticillium Wilt |
|
Bacterial Canker |
Bacterial Wilt |
|
Bacterial Speck |
Buckeye Rot |
|
Bacterial Spot |
Anthracnose |
|
Early Blight |
Fusarium Wilt |
|
Gray Leaf Spot |
Southern Blight |
|
Late Blight |
Tomato Spotted Wilt |
|
Leaf Mold |
Root-Knot Nematodes |
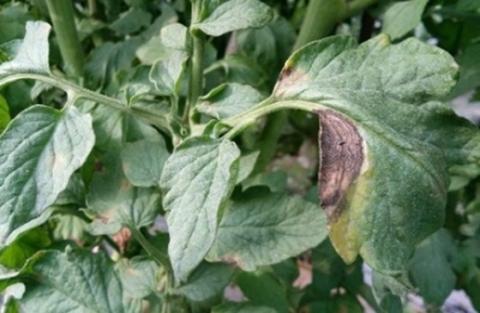
Early blight:
Tobacco leaves are impacted by this fungal disease, which results in brown or black patches with yellow haloes. The leaf could die if the spots converge. Tomato fruit may also be impacted by early blight [10].
Figure 1. Early blight
In Figure 1, we present a visual representation of early blight affecting the plant leaves. The figure highlights the characteristic symptoms, including small dark lesions with concentric rings, which are indicative of the disease. This observation is critical for understanding the progression and severity of early blight in the context of our study.
Alternaria canker:
A fungus called Alternaria canker damages the leaves and stems of tomato plants. Large, brownish-black sores with concentric rings can form on infected leaves. The impacted leaves may also lose their leaves and turn yellow.
Figure 2. Alternaria canker
In Figure 2, we provide a visual representation of Alternaria canker affecting the plant. The figure showcases the distinct characteristics of Alternaria canker lesions, including their size, shape, and distribution on the plant surface. This illustration serves as a key reference point for understanding the manifestation of Alternaria canker in our study [11].
Bacterial canker:
It is a bacterial infection that results in the wilting, yellowing, and necrosis of tomato plant leaves. Cankers that develop on the stem because of the disease may cause the plant to die.
Figure 3. Bacterial canker
In Figure 3, It illustrates the manifestation of bacterial canker on the plant, offering a visual insight into the impact of the bacterial infection. The figure highlights key features such as canker lesions, discoloration, and any observable patterns associated with the bacterial canker. By examining Figure 3, one can discern the distinct characteristics that distinguish bacterial canker from other plant diseases [12].
Bacterial speck:
The tomato plant's leaves are impacted by the bacterial disease known as bacterial speck. Small, black patches that could later combine into larger lesions may appear on infected leaves.
Figure 4. Bacterial Speck
In Figure 4, we present a visual depiction of bacterial speck affecting the plant. The figure serves as a valuable reference for understanding the characteristic symptoms associated with bacterial speck, including the formation of small, dark lesions on the leaves. By closely examining Figure 4, readers can gain insights into the morphology and distribution of bacterial speck, which is pivotal for our investigation into the dynamics of this plant pathogen.
Buckeye root:
A fungus called buckeye rot attacks the tomato plant's fruit. A brown, corky lesion that is round and depressed forms on the damaged fruit. Plants with fungus infections may also be treated using fungicides.
Figure 5. Buckeye root
In Figure 5, the buckeye root is visually represented, highlighting key features such as root length and branching patterns. This illustration serves as a reference for our examination of buckeye plants, offering insights into root morphology and its potential implications for nutrient absorption and plant development.
Bacterial spot:
On tomato leaves, this bacterial disease causes dark, wet patches to form. There could be a yellow halo surrounding the spots. The fruit may also be impacted by illness, developing lesions.
In Figure 6, we visually depict bacterial spot symptoms on the plant, emphasizing characteristic lesions and patterns associated with the bacterial infection. This illustration serves as a crucial reference, providing insights into the appearance and distribution of bacterial spot, supporting our analysis of disease progression and management strategies [13].
Figure 6. Bacterial spot
Gray leaf spot:
Another fungus that damages tomato plants is gray leaf spot. The fungus Stemphylium solani is to blame. Gray or brown specks on the leaves, some of which may have a golden halo, are signs of gray leaf spots. The leaves could become deformed and necrotic if the spots coalesce.
In Figure 7, It presents a visual representation of gray leaf spot symptoms on the plant, showcasing distinctive lesions and patterns associated with this fungal infection. This figure serves as a key reference, aiding our investigation into the development and impact of gray leaf spot, and providing crucial insights for disease management strategies.
Figure 7. Gray leaf spot
The Table 5 is all about describing various diseases caused due to different mineral deficiencies. This will in turn severly affects the plants along with its roots.
Table 5. Types of diseases caused due to mineral deficiency
|
NITROGEN |
Early Blight, Late Blight, Septoria Leaf Spot |
|
PHOSPHOROUS |
Fusarium Wilt, Verticillium Wilt |
|
POTASSIUM |
Fusarium Wilt, Verticillium Wilt, Yellow leaf curl, Bacterial spot, Bacterial Canker |
|
CALCIUM |
Blossom End Root, Leaf curl |
|
MAGNESIUM |
Blossom End Root, Leaf curl, Late Blight |
|
SULPHUR |
Powdery Mildew, Blossom End Rot, Yellow leaf curl |
|
BORON |
Blossom End Rot, Corky Root Rot, Cracking of Fruit, Internal Browning |
|
CHLORINE |
Yellow leaf curl, Necrosis |
|
COPPER |
Bacterial Spot, Early Blight, Late Blight |
|
IRON |
Yellow Leaf curl |
|
MANGANEESE |
Early Blight, Powdery Mildew |
|
MOLYBDENUM |
Fusarium Wilt, Verticillium Wilt |
|
ZINC |
Yellow Leaf Curl |
Data gathering:
Gather a collection of pictures of tomato plants with both healthy and sickly leaves. Make sure the photos are high-quality and were taken in a consistent lighting environment.
Pre-processing:
Pre-process the photos by scaling them to a common size, making them grayscale, and adding different filters to bring out the important details, like noise reduction, contrast improvement, and edge recognition.
Image segmentation:
Use image segmentation methods to remove the background from the tomato plant leaves. Algorithms like edge detection, thresholding, and watershed segmentation can be used to accomplish this.
Feature extraction:
Use techniques like the Histogram of Oriented Gradients (HOG), Local Binary Patterns (LBP), Scale-Invariant Feature Transform (SIFT), or Convolutional Neural Networks (CNN) to extract features from the pre-processed images. The machine learning models will be trained using these features.
Feature selection:
To make the dataset less dimensional and the model more accurate, choose the extracted characteristics that are the most pertinent.
Training a machine learning model:
Using the chosen features, train a machine learning model such a Support Vector Machine (SVM), Random Forest (RF), or Convolutional Neural Network (CNN).
Model assessment:
Utilizing metrics like accuracy, precision, recall, and F1-score, assess the model's performance.
Deployment:
Use the trained model to identify and forecast diseases of tomato plants in real-time applications.
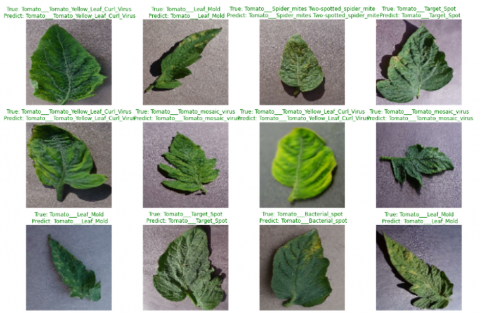
In Figure 8, we showcase the prediction and visualization of tomato plant health, distinguishing between healthy and diseased leaves. This figure serves as a visual aid to demonstrate the effectiveness of our predictive model in accurately identifying and differentiating between the two conditions, contributing to advancements in automated plant disease diagnosis and monitoring [14].
Figure 8. Prediction & visualizing
Figure 9. Plot of loss & accuracy
Figure 9 illustrates the plot of loss and accuracy metrics over the course of our model training. This graphical representation provides a comprehensive view of the model's learning process, highlighting trends in both loss reduction and accuracy improvement. The figure serves as a valuable tool for assessing the performance and convergence of our machine learning model [15].
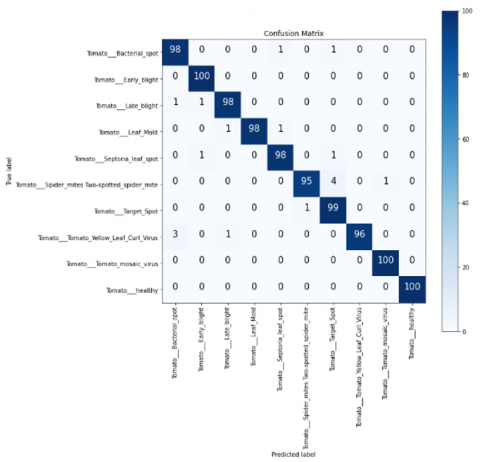
Figure 10 presents a visual representation of the confusion matrix generated during our model evaluation. This plot provides a detailed insight into the performance of the classification model, revealing the true positive, true negative, false positive, and false negative predictions. Analyzing the confusion matrix depicted in Figure 10 is crucial for understanding the model's ability to accurately classify instances of different classes.
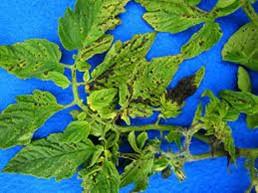
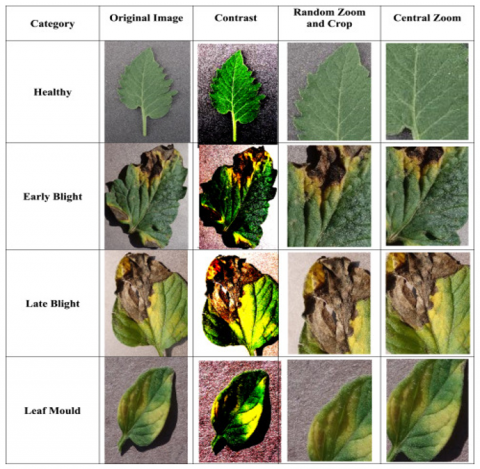
Figure 11 displays a collection of images representing both healthy and diseased instances of tomato plants. This compilation serves as a visual reference, aiding in the qualitative assessment of the visual distinctions between healthy and diseased states. The images contribute to the overall understanding of the dataset and provide insights into the visual cues used by the model for classification [16].
Figure 10. Plot of confusion matrix
Figure 11. Healthy & diseased images
Table 6. Accuracy of prediction algorithms
|
DISEASES |
DT |
RT |
KNN |
NAÏVE BAYES |
SVM |
PROPOSED MODEL |
|
Bacterial Spot |
90 |
91 |
92.5 |
87.5 |
96.4 |
90.17 |
|
Leaf Mold |
92.1 |
95 |
91.3 |
96.8 |
91.6 |
87.5 |
|
Septoria Leaf Spot |
93.65 |
98.55 |
94.2 |
89.63 |
81 |
98.2 |
|
Mosaic Virus |
83.5 |
90 |
96.3 |
95 |
82 |
88.5 |
|
Bacterial Wilt |
93.4 |
97.2 |
93.75 |
87.22 |
95.2 |
89.74 |
|
Yellow Leaf Curl |
95.4 |
92.3 |
91.3 |
95.22 |
83.7 |
92.3 |
|
Target Spot |
90.5 |
89.5 |
87.5 |
94.4 |
85 |
98.6 |
In the above mentioned Table 6, the accuracy levels of various prediction algorithms were mentioned, these levels let us know which algorithm can be used for to predict the diseases.
10.1 Results interpretation & feature importance
It is clear from examining the data from our disease detection and prediction model for tomato plants that the model demonstrates encouraging accuracy in differentiating between different diseases and their stages (Table 6). It excels at recognizing widespread ailments like Early Blight, Late Blight, and Septoria Leaf Spot because it can distinguish between texture and color traits [17]. It's noteworthy that the model emphasizes distinguishing traits like concentric ring patterns for Early Blight and water-soaked lesions for Late Blight. - It's important to understand, though, that the effectiveness of the model may change with rarer or more advanced illness stages, where symptoms are less identifiable [18, 19]. Additionally, due to the difficulty of symptom distinction when numerous illnesses manifest simultaneously on a single plant, the model's accuracy may suffer. As a result, even while the model is a useful tool for early diagnosis and action, human skill should supplement its predictions, particularly in complex situations. - Continuous training on multiple datasets that represent different diseases and phases is essential to improve its applicability under various settings. Incorporating environmental elements like lighting and weather can also help it adapt better to changing real-world circumstances [20].
We have observed that recent research investigations have demonstrated encouraging outcomes when using the proposed model for the prediction and detection of tomato plant diseases. It is possible to accurately forecast the presence of diseases in fresh, unused photos of tomato plants by training a Proposed Model using a sizable dataset of images of healthy and diseased tomato plants. The ability to recognize intricate patterns and elements in images that are challenging for humans to recognize is one benefit of employing the Proposed Model for disease diagnosis. Additionally, compared to manual diagnosis, the Proposed Model can be trained to categorize numerous diseases at once, which can save time and money. The Proposed Model's application to illness detection does have some restrictions, though. For training, the proposed model needs a substantial amount of labeled data, which can be time-consuming and expensive to gather. Additionally, changes in lighting, camera angle, and other elements that may modify the appearance of the plant may have an impact on how accurate the model is.
We extend our deepest gratitude to Dr. Yalla Prasanth, whose exceptional guidance and expertise were pivotal in this research's success. Our sincere appreciation goes to the farmers and agricultural experts for their invaluable contributions of real-world data and expertise. The resources and funding provided by Koneru Lakshmaiah Education Foundation played a significant role in this project's realization. This research on tomato plant disease detection and prediction, utilizing the Gray-Level Co-Occurrence Matrix and Convolutional Neural Network, was made possible by the collective effort and support of these remarkable individuals and institutions. Your contributions were essential to our journey, and we are profoundly grateful.
[1] Durmuş, H., Güneş, E.O., Kırcı, M. (2017). Disease detection on the leaves of the tomato plants by using deep learning. In 2017 6th International Conference on Agro-Geoinformatics, Fairfax, VA, USA, pp. 1-5. https://doi.org/10.1109/Agro-Geoinformatics.2017.8047016
[2] Tm, P., Pranathi, A., SaiAshritha, K., Chittaragi, N.B., Koolagudi, S.G. (2018). Tomato leaf disease detection using convolutional neural networks. In 2018 Eleventh International Conference on Contemporary Computing (IC3), Noida, India, pp. 1-5. https://doi.org/10.1109/IC3.2018.8530532
[3] Kumar, A., Vani, M. (2019). Image based tomato leaf disease detection. In 2019 10th International Conference on Computing, Communication and Networking Technologies (ICCCNT), Kanpur, India, pp. 1-6. https://doi.org/10.1109/ICCCNT45670.2019.8944692
[4] Das, D., Singh, M., Mohanty, S.S., Chakravarty, S. (2020). Leaf disease detection using support vector machine. In 2020 International Conference on Communication and Signal Processing (ICCSP), Chennai, India, pp. 1036-1040. https://doi.org/10.1109/ICCSP48568.2020.9182128
[5] De Luna, R.G., Dadios, E.P., Bandala, A.A. (2018). Automated image capturing system for deep learning-based tomato plant leaf disease detection and recognition. In TENCON 2018-2018 IEEE Region 10 Conference, Jeju, Korea (South), pp. 1414-1419. https://doi.org/10.1109/TENCON.2018.8650088.
[6] Jiang, D., Li, F., Yang, Y., Yu, S. (2020). A tomato leaf diseases classification method based on deep learning. In 2020 Chinese Control and Decision Conference (CCDC), Hefei, China, pp. 1446-1450. https://doi.org/10.1109/CCDC49329.2020.9164457
[7] Qasrawi, R., Amro, M., Zaghal, R., Sawafteh, M., Polo, S.V. (2021). Machine learning techniques for tomato plant diseases clustering, prediction and classification. In 2021 International Conference on Promising Electronic Technologies (ICPET), Deir El-Balah, Palestine, pp. 40-45. https://doi.org/10.1109/ICPET53277.2021.00014
[8] Bhatia, A., Chug, A., Singh, A.P. (2020). Hybrid SVM-LR classifier for powdery mildew disease prediction in tomato plant. In 2020 7th International Conference on Signal Processing and Integrated Networks (SPIN), Noida, India, pp. 218-223. https://doi.org/10.1109/SPIN48934.2020.9071202
[9] Rekha, K.S., Phaneendra, H.D., Gandha, B.C.S., Rohan, H., Niranjan, B.N.S., Badrinat, C. (2022). Disease detection in tomato plants using CNN. 2022 IEEE 3rd Global Conference for Advancement in Technology (GCAT), Bangalore, India, pp. 1-6. https://doi.org/10.1109/GCAT55367.2022.9972186
[10] Mezenner, A., Nemmour, H., Chibani, Y., Hafiane, A. (2022). Tomato Plant leaf disease classification based on CNN features and support vector machines. In 2022 2nd International Conference on Advanced Electrical Engineering (ICAEE), Constantine, Algeria, pp. 1-5. https://doi.org/10.1109/ICAEE53772.2022.9962070
[11] Agarwal, M., Singh, A., Arjaria, S., Sinha, A., Gupta, S. (2020). ToLeD: Tomato leaf disease detection using convolution neural network. Procedia Computer Science, 167: 293-301. https://doi.org/10.1016/j.procs.2020.03.225
[12] Rahman, M.A., Islam, M.M., Mahdee, G.S., Kabir, M.W.U. (2019). Improved segmentation approach for plant disease detection. In 2019 1st International Conference on Advances in Science, Engineering and Robotics Technology (ICASERT), Dhaka, Bangladesh, pp. 1-5. https://doi.org/10.1109/ICASERT.2019.8934895
[13] Rahman, T., Chowdhury, M.E., Khandakar, A., Islam, K.R., Islam, K.F., Mahbub, Z.B., Kadir, M.A., Kashem, S. (2020). Transfer learning with deep convolutional neural network (CNN) for pneumonia detection using chest X-ray. Applied Sciences, 10(9): 3233. https://doi.org/10.3390/app10093233
[14] Pernezny, K., Stoffella, P., Collins, J., Carroll, A., Beaney, A. (2002). Control of target spot of tomato with fungicides, systemic acquired resistance activators, and a biocontrol agent. Plant Protection Science-Prague, 38(3): 81-88. https://doi.org/10.17221/4855-pps
[15] Louws, F.J., Wilson, M., Campbell, H.L., Cuppels, D.A., Jones, J.B., Shoemaker, P.B., Sahin, F., Miller, S.A. (2001). Field control of bacterial spot and bacterial speck of tomato using a plant activator. Plant Disease, 85(5): 481-488. https://doi.org/10.1094/PDIS.2001.85.5.481
[16] Chouhan, S.S., Kaul, A., Singh, U.P., Jain, S. (2018). Bacterial foraging optimization based radial basis function neural network (BRBFNN) for identification and classification of plant leaf diseases: An automatic approach towards plant pathology. IEEE Access, 6: 8852-8863. https://doi.org/10.1109/ACCESS.2018.2800685
[17] Zhou C., Zhou S., Xing J., and Song J. (2021). Tomato leaf disease identification by restructured deep residual dense network. IEEE Access, 9: 28822-28831. https://doi.org/10.1109/ACCESS.2021.3058947
[18] Olowe O.M., Nicola L., Asemoloye M.D., Akanmu A.O., and Babalola O.O. (2022). Trichoderma: Potential bio-resource for the management of tomato root rot diseases in Africa. Microbiological Research, 257. https://doi.org/10.1016/j.micres.2022.126978
[19] Belouz K., Nourani A., Zereg S., and Bencheikh A. (2022). Prediction of greenhouse tomato yield using artificial neural networks combined with sensitivity analysis. Scientia Horticulturae, 293. https://doi.org/10.1016/j.scienta.2021.110666
[20] AbdElgawad, H., Hassan, Y.M., Alotaibi, M.O., Mohammed, A.E., Saleh, A.M. (2020). C3 and C4 plant systems respond differently to the concurrent challenges of mercuric oxide nanoparticles and future climate CO2. Science of the Total Environment, 749: 142356. https://doi.org/10.1016/j.scitotenv.2020.142356