Ahmad Fauzi*![]() | Jayadi Butar Butar
| Jayadi Butar Butar![]() | Indra Budi
| Indra Budi![]() | Amanah Ramadiah
| Amanah Ramadiah![]() | Prabu Kresna Putra
| Prabu Kresna Putra![]() | Aris Budi Santoso
| Aris Budi Santoso![]()
© 2024 The authors. This article is published by IIETA and is licensed under the CC BY 4.0 license (http://creativecommons.org/licenses/by/4.0/).
OPEN ACCESS
2024 is a political year in Indonesia as it marks the presidential general election. The proliferation of survey institutions attempting to capture the electability levels of each candidate may not invariably yield accurate results, as evidenced by the events of the 2016 United States Presidential election. The loyal support creates tight competition and a narrow margin in electability levels among the three contending candidates. Opinion mining on social media offers an alternative that addresses the challenges often encountered when measuring electability using traditional survey methods. This study aims to build entity-level sentiment classifiers as a new approach for predicting electability of presidential candidates based on citizen support on social media Twitter within the framework of the CRISP-DM model. The study compares 9 different algorithms with 3 vectorization techniques. Evaluation measurement with 4 metrics: accuracy, precision, recall and f1-score is performed. As a result, TF-IDF 3-gram Random Forest achieves the highest fi-score 0.84486. The selected model is then employed to measure the presidential candidates' electability levels over time. Besides streamlining the process, social media’s opinion mining enables the candidates and their constituents to monitor electability levels affordably in real-time and on-demand manner, which is advantageous compared to traditional surveys.
machine learning, opinion mining, presidential election, sentiment analysis, social media mining, traditional survey
The date of February 14, 2024, will mark a historic day for the nation of Indonesia, as it is scheduled to hold the Presidential election [1]. The Presidential Election is a political event where every citizen selects a candidate for a leader whom they hope can fulfill their aspirations [2]. This makes every citizen highly enthusiastic about following the political developments. There are three candidates who will be competing in Indonesian 2024 election [3]. Firstly, Anies Baswedan, a former Governor of DKI Jakarta, is renowned for his visionary ideas and proposals concerning transformative initiatives. Secondly, Ganjar Pranowo, the Governor of Central Java, is supported by the ruling party PDI-P and is well-known for his close rapport and frequent interactions with people. Lastly, Prabowo Subianto, the Minister of Defense and a former Army General during the New Order era, is famous for his patriotism and commitment to matters pertaining to the security of food resources. As the grand event approaches, the candidates and endorsing parties are in fierce competition to gain support from the public. As the election draws closer, numerous political dynamics emerge, which may potentially influence the electability level of a presidential candidate.
Since the names of the candidates have been announced by the endorsing coalition parties, the traditional electability surveys of the candidates have been abundant, with at least 17 survey results recorded by independent institution [4]. Traditional surveys represent as the most utilized method in the context of measuring the electability of presidential candidates, analyzing voter demographics, and identifying selection factors. Despite being the most frequently utilized method, traditional surveys come with inherent limitations in their implementation. For example, a decreasing response rate has an impact on the increasing costs due to the higher effort required to contact and interview respondents [5]. Measurement bias occurs when respondents are not truthful in expressing their preferences [6]. Inaccuracy in the likely-voters model refers to the imprecision in the weighting assigned to specific sample categories. Requiring a considerable amount of time in its processes, making it challenging for researchers to capture rapidly changing dynamics of opinions [7]. The format of traditional surveys is often constrained by the scope of questions. Which provides limited space for free-form opinions (except for open-ended questions), restricting the diversity of responses to a set of discrete data.
As the results of mentioned drawbacks in previous paragraph, the traditional survey process often diverges from reality, as seen in the 2016 US presidential election [6]. Many survey institutions and experts initially predicted that Donald Trump's vote share would not exceed 40%. However, this prediction did not align with the final election results. Research conducted by Nicolas et.al. stated factors that caused this discrepancy were measurement bias, inaccuracy likely-voters model and the undecided voters did not show their preference until late, which in the end they voted for Trump. Furthermore, Clinton failed to capture the electability dynamics and subsequently did not change her campaign strategy accordingly. In conclusion, Nicolas et. al (2019) suggests necessary mechanism for measuring electability that can be executed on-demand and in real-time has the potential to minimize prediction deviations [6].
In this era of information disclosure, social media has become a place for people to channel their opinions. Every social phenomenon often attracts people's attention to comments on social media, including presidential election contests [8]. Citizens have diverse political views, which manifest in the form of their support for the presidential candidate, which is increasingly visible in the span of one year before the presidential election is held, thereby making very large amounts of citizen's opinions regarding the presidential candidates in social media. Platforms such as Twitter, Facebook, YouTube are believed to be places that can reflect public opinion or sentiment towards their future leader.
The existence of large unstructured data that is spread out makes social media an intriguing source for public sentiment analysis research. Sentiment analysis aimed to identify positive and negative emotions, expressed either explicitly or implicitly in the text [9]. In the context of business management, sentiment analysis is useful in maximizing achievable utility, while in the context of computer science research, the most efficient way to extract positive and negative sentiment from large and diverse social media data is the main objective of the research.
In the realm of computer science, sentiment analysis can be carried out using the Natural Language Processing (NLP) approach [9]. The goal is to be able to extract hidden information that can be generated quickly and accurately from big-volume-unstructured data. Sentiment analysis, which is categorized as predictive analysis, can be divided into three levels: document-level, sentence-level, and aspect-level. Aspect-level sentiment analysis, also known as entity-level sentiment analysis, is the most applied level in the industry as well as for prediction of election outcomes. Compared with document-level and sentence-level analysis, this level of analysis ensures that sentiment predictions are made on the smallest parts of a document or sentence that contains opinions about entities that are the target of sentiment. Entity-level sentiment analysis approaches can be executed with 2 approaches, namely: machine learning-based approaches and lexicon-based approaches.
This entity-level sentiment analysis research is conducted using supervised machine learning technique. Supervised machine learning is used to solve problems such as classification, in which the objective is to determine the nominal value of a dataset and regression, which aims to predict precise numerical values (e.g., weight, height) [9]. The term "supervised" refers to the requirement of manual data labelling during the process. The focus of this research lies in the classification task, specifically categorizing sentiments as positive or negative, within tweets shared by Indonesian netizens regarding the competing presidential candidates.
In context of Indonesian election, there have been several studies employed sentiment analysis, which is conducted for previous presidential election. A study carried out by Ibrahim O. et.al for Indonesian presidential election 2014, not only performed lexicon-based sentiment analysis but also incorporated a process for buzzer detection to ensure that the training dataset used represents genuine opinions from the public and not artificially manipulated opinions [10]. Subsequently, in the 2019 election period, Suciati et. al solely concentrated on the reliable buzzer detection [11]. On the other hand, the study conducted by Budiharto et.al solely focused on sentiment analysis using TextBlob, a python lexicon-based sentiment analyzer, without involving any buzzer detection process [12]. This research employs a distinct sentiment analysis method from the two sentiment analysis studies conducted during the previous Indonesian election periods. Unlike the prior studies which used lexicon-based sentiment analysis, this research utilizes supervised machine learning-based sentiment analysis.
This research will focus on conducting sentiment analysis and topic mining of the public's opinions towards the three presidential candidates of Indonesian 2024 election. The approach will utilize supervised machine learning techniques, and the data will be retrieved from the social media Twitter. The novel contribution of this research is comparing 9 machine learning algorithms, namely: Random Forest [13], Decision Tree [14], Naïve Bayes [15], XGB [16], LGBM [17], AdaBoost [18], Voting Classifier [19], K-Nearest Neighbor [20], Logistic regression [21]. With the aim to identify the most optimal and reliable sentiment analysis technique that can be used in real-time and on-demand to monitor public sentiment and its underlying concerns towards the candidates of the upcoming 2024 Indonesian presidential election during dynamic political situation of campaign period.
By adopting such a dynamic approach, the electoral landscape can be continuously monitored and updated, allowing for more accurate and up-to-date assessments of candidate popularity. This real-time data can better capture the changing sentiments and factors influencing the electorate, reducing the risk of misalignments between predictions and actual election outcomes. Implementing an on-demand and real-time measurement system for electability offers the possibility of more precise and timely insights, which can aid decision-makers, analysts, and the public in making informed choices during the electoral process [22].
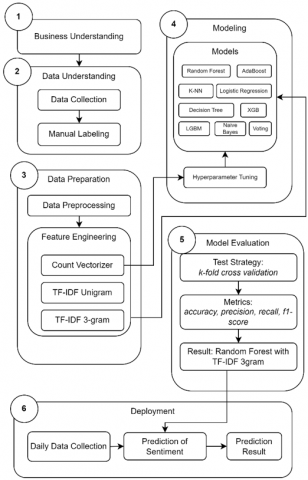
This research employed Cross-industry standard process for data mining (CRISP-DM) framework. This framework consists of six iterative stages namely: Business Understanding, Data Understanding, Data Preparation, Modelling, Evaluation and Deployment [23]. Figure 1 shows implementation Overview of the framework for this research.
2.1 Business understanding
In this stage, we aim to identify political issues related to each candidate. This serves as a foundation for us to be objective in the manual labelling process to form the training set. During this stage, we also determine the main objectives of this data mining process. Which adopts a classification approach using machine learning for extracting public sentiment and identifying topics or concerns that underlie the sentiments expressed towards the candidates in real-time. This research was conducted in August, where the campaign period is still relatively long (until February 2024) and undecided voters have not yet determined and expressed their support. However, with the use of automated, fast, even in real-time opinion mining techniques, this option becomes highly rational for relevant parties, including the candidates, supporting parties, and their constituents to capture public opinions, devise new strategies, and execute them to enhance their electability, especially as the end of the campaign period when the available time becomes increasingly limited.
Figure 1. Research overview with CRIPS-DM
2.2 Data understanding
Determining and familiarizing the source and structure of dataset is the initial part for this process, then data collection is conducted from social media Twitter, which employs a crawling approach. As a highly popular social media platform among Indonesian society, Twitter has achieved remarkable numbers with 78 million Indonesian citizens consistently expressing their opinions on the platform, and over 150 million active users originating from Indonesia [24]. The data retrieval process was divided into three stages based on the entities. Each stage had distinct keywords utilized for specific presidential candidates. Table 1 presents the keywords we employed:
Then, the labelling process was conducted, involving two types of classifications: entities and sentiment. Entity classification is used to identify the entities targeted for sentiment analysis, with nominal values assigned to the three contesting presidential candidates: 'anies', 'ganjar', and 'prabowo'. On the other hand, sentiment classification consists of two nominal values: positive and negative. Thus, there are a total of 6 nominal values overall. Table 2 shows the samples of annotation process result and Table 3 presents the number of datasets obtained from the manual labelling process:
Table 1. Twitter API query for data collection
|
Entity |
Query |
|
Anies Baswedan |
qry='(pilpres OR pemilu OR "pemilihan umum" OR "pemilihan presiden") (anies OR anis) -prabowo -ganjar since:'+since +' lang:in -filter:url -filter:images -is:retweet' |
|
Ganjar Pranowo |
qry='(pilpres OR pemilu OR "pemilihan umum" OR "pemilihan presiden") prabowo -ganjar -anies -anis since:'+since +' lang:in -filter:url -filter:images -is:retweet' |
|
Prabowo Subianto |
qry='(pilpres OR pemilu OR "pemilihan umum" OR "pemilihan presiden") ganjar -prabowo -anies -anis since:'+since +' lang:in -filter:url -filter:images -is:retweet' |
Table 2. Sample of annotated data
|
Category (sentiment - entity) |
Sample |
|
positive - anies |
Translated: The Volunteer Group for Indonesia's Mandate (ANIES) declares its support to win the presidential candidate from the Coalition for Unity Change, Anies Baswedan, in the 2024 Presidential Election. Original: Relawan Amanat Indonesia (ANIES) menyatakan dukungan untuk memenangkan calon presiden dari Koalisi Perubahan untuk Persatuan, Anies Baswedan, pada Pilpres 2024. |
|
negative - anies |
Translated: @ainunnajib Identity politics is an integral part of Anies's track record that cannot be forgotten, as Anies himself acknowledges that identity politics is unavoidable during electoral moments. Original: @ainunnajib Politik indentitas itu bagian dari Rekam Jejak anies yg tdk bisa dilupakan, karena anies sendiri masih menyatakan politik identitas tdk bisa terhindarkan pada Moment Pemilu. |
|
positive - ganjar |
Translated: ‘Partai (Party) Demokrasi Indonesia Perjuangan (PDIP)’ positively welcomes the survey results from Charta Politika Indonesia, which indicate that the electability of the party and the PDIP's presidential candidate, Ganjar, is above average leading up to the 2024 elections. Original: Partai Demokrasi Indonesia Perjuangan menyambut positif hasil survei Charta Politika Indonesia yang menyebut elektabilitas partai dan Bacapres dari PDIP yakni Ganjar berada di atas jelang Pemilu 2024. |
|
negative - ganjar |
Translated: For image-building, willing to watch football, while based on his track record as conveyed by the elite figure of the Indonesian Democratic Party (PDI-P), Ganjar Pranowo has never shown any concern for the field of sports. Original: Demi sebuah pencitraan,rela nonton bola, sementara dari rekam jejak nya yang disampaikan oleh tokoh elit PDI-P Ganjar Pranowo tidak pernah peduli dengan bidang olahraga. |
|
positive - prabowo |
Translated: Among the potential figures to run in the 2024 Presidential Election, Prabowo is a figure who could potentially reflect a more active role in establishing world order based on the preamble of the 1945 Constitution. Original: Di antara beberapa tokoh yang berpotensi maju dalam Pilpres 2024, Prabowo merupakan figur yang bisa mencerminkan lebih aktif dalam menciptakan ketertiban dunia berdasarkan Pembukaan UUD 1945. |
|
positive - prabowo |
Translated: @SORUN2020 @Dennysiregar7 @aniesbaswedan @prabowo Waiting for him to express gratitude again when he loses, pretending to be president for the third time. Original: @SORUN2020 @Dennysiregar7 @aniesbaswedan @prabowo Menunggu doi sujud Syukur saat KALAH lagi & main pleciden2an lagi utk yg ketiga kalinya. |
Table 3. Amount of annotation result
|
Entity |
Positive |
Negative |
Total |
|
Anies |
150 |
150 |
300 |
|
Ganjar |
150 |
150 |
300 |
|
Prabowo |
150 |
150 |
300 |
|
Total |
450 |
450 |
900 |
2.3 Data preparation
Data Pre-processing and feature engineering are conducted in this phase. When the dataset has been collected and annotated, the process continues with data pre-processing. Data pre-processing is performed to produces clean fine-grain text and transforms those data to relevant features for the model building process, which the main objective is aiming to improve the accuracy of the classification results. Here is the sequence of steps we followed for this stage:
(1) Eliminating URLs, mentions, emoticons, and non-alphanumeric characters from the text using regular expressions.
(2) Tokenization: converting the text into a list of words.
(3) Stop word removal: eliminating insignificant words from the classification process.
(4) Lemmatization: converting words to their base form, ensuring that the scoring of affixed words during the feature engineering stage is not separated from their base form.
(5) POS tagging: determining the part-of-speech (POS) of each word and eliminating tokens based on their POS. The following POS tags were used for this stage: 'NN' (Noun), 'VB' (Verb), 'ADJP' (Adjective Phrase), 'JJ' (Adjective), 'ADV' (Adverb). We only select subset of word types that are closely related to sentiment representation to reduce computation cost and produce better results [25].
Feature engineering is conducted after cleaning the data, the process is then performed by changing the cleaned text of each feature vectors format, which machine learning algorithm understands [26]. This format is later used in the machine learning model creation process. There are 2 approaches used for this research, namely TF-IDF and Count Vectorizer. TF-IDF is the matrix form of the dataset, the rows represent documents in the corpus, the columns represent tokens in the corpus, and the values in the cells represent the number of times a feature occurs in each document in the corpus, with the more frequent features appearing, the smaller the value [26]. Variable TF (term frequency), which is how often a feature appears in a document.
$T F=\frac{\begin{array}{c}\text { number of times the tern } \\ \text { appears in the document }\end{array}}{\text { total number of terms in the document }}$ (1)
Divided by the IDF (inverse document frequency), the result of the log function of the ratio of the number of documents in the corpus and the number of documents in which the feature in question is contained.
$I D F=\log \left(\frac{\begin{array}{c}\text { number of the documents } \\ \text { in the corpus }\end{array}}{\text { in the corpus contain the term }}\right)$ (2)
$\text { TF-IDF }=T F * I D F$ (3)
TF-IDF is the most commonly used vectorization technique, which usually gives better accuracy and can be applied in unigram and n-gram [27-29]. While count vectorizer is similar with TF-IDF in terms of column and row, but values in cells represent the number of times the token was found in the document without considering the existence of token in other documents [26].
Table 4. Result of Hyper-parameter tuning
|
Algorithm (Parameter) |
Range in Search |
Optimum Value |
F1-Score |
|
K-NN (Number of Nearest Neighbor) |
1-100 |
3 |
0.73 |
|
Decision Tree (Max Depth) |
1-100 |
67 |
0.79 |
|
Logistic Regression (Max Iteration) |
1-100 |
15 |
0.83 |
|
Random Forest (Max Depth) |
1-100 |
63 |
0.83 |
|
LGBM (Max Depth) |
1-100 |
3 |
0.78 |
|
AdaBoost (Number of Estimator) |
1-30 |
21 |
0.73 |
2.4 Modelling
Before building and comparing the model, we conducted hyperparameter tuning for 6 algorithms with bag of word vectorization technique, objective of this subsequence process is to identify the optimal parameter values. For example, decision tree has the separation criteria and the depth of the tree, while the number of DTs and depth of DTs is used for Random Forest Classifier [30]. The parameters value is not learned and determined from the data, but they are set before the model building is executed. Table 4 shows hyperparameter tuning results, which ultimately can produce the best version of the model for each machine learning algorithm.
Based on the best parameter values obtained from the hyperparameter tuning process, we conducted model building using 9 different algorithms (namely: (1) K-Nearest Neighbor (2) Decision Tree (3) Logistic Regression (4) Naïve Bayes (5) Random Forest (6) LGBM (7) XGB (8) AdaBoost (9) Voting Classifier) and 3 vectorization methods mentioned earlier.
2.5 Model evaluation
In this step the measurement of accuracy and execution speed of the established model takes place. There are two aspects that need to be determined in this stage: Test Strategy and Measurement Metrics. Test Strategy is conducted to determine testing dataset from training dataset, in this research we employ k—fold cross validation. Which aims to divide the dataset into given number of sections, based on that given number of sections the algorithms will be executed iteratively [24]. In the first iteration, the first section of the dataset will be employed as testing data and the rest as training data. For the second iteration, the second section of dataset acts as testing and so on. We performed 10-fold cross-validation, dividing the data into 10 subsets for evaluation.
Metrics: Precision, Recall, F1-score are employed to measure the model’s performance. Table 5 shows confusion matrix that is used to categorize the result. There are 4 types of classification result categories, namely: True Positive (TP), True Negative (TN), False Positive (FP) and False Negative (FN). Those 4 categories can be used to identify the value of the metrics. Accuracy simply counts percentage of correct prediction against all datasets. Precision informs the percentage of correct prediction from all predicted class, while recall measures percentage of correct prediction against the actual class and f1-score harmonizes the measurement of precision and recall [24].
Accuracy $\frac{T P+T N}{T P+F P+T N+F N}$ (1)
Precision $\frac{T P}{T P+F P}$ (2)
Recall $\frac{T P}{T P+F P}$ (3)
F1-score $\frac{2 * \text { Precision } * \text { Recall }}{\text { Precision } * \text { Recall }}$ (4)
Table 5. Confusion matrix
|
Confusion Matrix |
Actual Class |
|
|
Positive |
Negative |
|
|
Predicted Positive |
True Positive (TP) |
False Positive (FP) |
|
Predicted Negative |
False Negative (FN) |
True Negative (TN) |
2.6 Deployment
Deployment is the phase in which the implementation of the model with the best accuracy is carried out, as determined during the evaluation phase. With the aim of continually monitoring the electability levels of each candidate over time, the data collection process in this deployment phase is conducted daily. In this stage, manual labeling of newly acquired data is no longer performed. Subsequently, to facilitate prediction, data preprocessing is conducted, followed by prediction with random forest TF-IDF 3-gram vectorization model, as it has been established as the highest modelling technique. This modelling technique emerges as the top performer overall, which achieves 0.8448 f1-score value. This modelling technique slightly surpasses prediction of random forest model with TF-IDF unigram vectorization and count vectorizer, which achieves 0.8447 and 0.8394. Details of evaluation measurements are described in the result and discussion section. The outcomes derived from the deployment phase are presented in the form of histograms, allowing consumers to observe the fluctuations in the presidential candidates' electability levels over time.
Tables 6-8 show the measurement summary results for the 9 algorithm models using the 3 different vectorization methods which is conducted in model evaluation phase, while Table 9 shows the result of random forest classifier, as best performing classifier, which is categorized by nominal values:
Table 6. Model evaluation of count vectorizer
|
Classifier |
Count Vectorizer |
|||
|
Accuracy |
Precision |
Recall |
F1-Score |
|
|
Rf |
0.83 |
0.84 |
0.83 |
0.83 |
|
Vot |
0.82 |
0.83 |
0.81 |
0.82 |
|
Dt |
0.78 |
0.81 |
0.78 |
0.79 |
|
Xgb |
0.78 |
0.79 |
0.78 |
0.78 |
|
NB |
0.78 |
0.78 |
0.78 |
0.78 |
|
Lgbm |
0.77 |
0.78 |
0.78 |
0.78 |
|
Knn |
0.72 |
0.73 |
0.72 |
0.72 |
|
Adaboost |
0.64 |
0.67 |
0.57 |
0.56 |
|
Lr |
0.61 |
0.81 |
0.52 |
0.46 |
By using the Count Vectorizer for vectorization, the Random Forest model achieved the highest accuracy with an F1-Score of 0.8394. It is followed by the Voting Classifier with 0.8234 and the Decision Tree with 0.7946.
Table 7. Model evaluation of Unigram TF-IDF
|
Classifier |
TF-IDF Unigram |
|||
|
Accuracy |
Precision |
Recall |
F1-Score |
|
|
Rf |
0.83 |
0.85 |
0.84 |
0.84 |
|
Vot |
0.82 |
0.83 |
0.82 |
0.83 |
|
Dt |
0.82 |
0.83 |
0.82 |
0.82 |
|
Xgb |
0.81 |
0.82 |
0.82 |
0.82 |
|
Lgbm |
0.79 |
0.81 |
0.80 |
0.81 |
|
Knn |
0.79 |
0.81 |
0.79 |
0.80 |
|
NB |
0.74 |
0.80 |
0.77 |
0.79 |
|
Adaboost |
0.71 |
0.74 |
0.70 |
0.71 |
|
Lr |
0.63 |
0.64 |
0.56 |
0.55 |
Using TF-IDF unigram vectorization, the Random Forest model attained the highest accuracy with an F1-Score of 0.8447. Subsequently, the Voting Classifier achieved an F1-Score of 0.8328, while the Decision Tree obtained an F1-Score of 0.8275. Notably, TF-IDF unigram vectorization exhibited substantial enhancement for the Decision Tree, XGBoost (XGB), LightGBM (LGBM), K-Nearest Neighbor (K-NN), and AdaBoost algorithms, when compared to count vectorization.
The last vectorization method, TF-IDF 3-gram, the accuracy rankings remain unchanged compared to the previous two vectorization approaches. The F1-Score values also show minimal differences compared to TF-IDF unigram vectorization. However, the Random Forest model with TF-IDF 3-gram vectorization emerges as the top performer overall, achieving the highest F1-Score of 0.8448. This F1-Score slightly surpasses the F1-Score of 0.8447 achieved by the Random Forest model with TF-IDF unigram vectorization. This finding indicates the potential characteristics of the corpus, which contains lexical phrases or terms with meaning and can be significant predictors in the classification process [25].
Table 8. Model evaluation of 3-gram TF-IDF
|
Classifier |
TF-IDF N-Gram |
|||
|
Accuracy |
Precision |
Recall |
F1-Score |
|
|
Rf |
0.83 |
0.84 |
0.84 |
0.84 |
|
Vot |
0.83 |
0.85 |
0.82 |
0.83 |
|
Dt |
0.83 |
0.84 |
0.82 |
0.83 |
|
Xgb |
0.80 |
0.81 |
0.81 |
0.81 |
|
Lgbm |
0.79 |
0.81 |
0.80 |
0.80 |
|
NB |
0.79 |
0.80 |
0.79 |
0.79 |
|
Knn |
0.79 |
0.79 |
0.79 |
0.79 |
|
Adaboost |
0.72 |
0.75 |
0.72 |
0.73 |
|
Lr |
0.65 |
0.66 |
0.58 |
0.57 |
Table 9. Model evaluation based on categories
|
Nominal |
F1-Score |
||
|
Count Vectorizer |
TF-IDF Unigram |
TF-IDF 3-Gram |
|
|
Anies Positive |
0.75 |
0.74 |
0.77 |
|
Anies Negative |
0.64 |
0.64 |
0.63 |
|
Ganjar Positive |
0.9 |
0.9 |
0.9 |
|
Ganjar Negative |
0.88 |
0.88 |
0.91 |
|
Prabowo Positive |
0.95 |
0.93 |
0.92 |
|
Prabowo Negative |
0.93 |
0.91 |
0.93 |
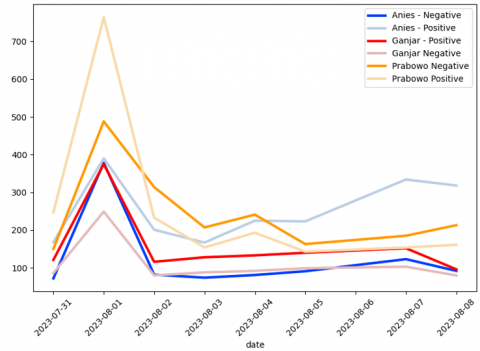
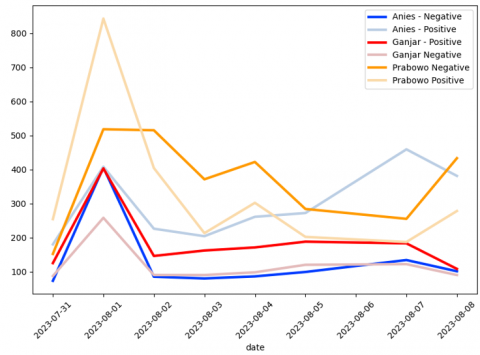
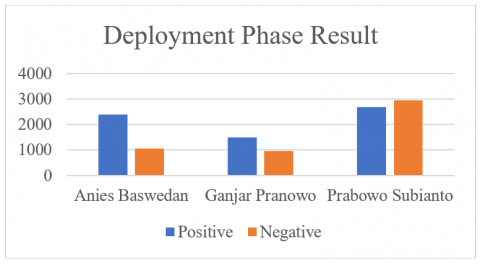
Once the model with the best accuracy has been identified, Deployment phase is executed. Figure 2 shows the result of deployment proses the data is presented as historical electability level with interval from June 31, 2023, to August 8, 2023, while Figure 3 presents numbers of users who posted their opinion grouped by the prediction result.
In total, there are 11516 tweets collected in deployment phase. Figure 4 shows most predicted tweets are opinions directed towards Prabowo Subianto, totaling 5629 tweets overall, 2682 tweets are detected as positive sentiment, while 2947 tweets are marked as negative. Then, followed by Anies Baswedan with 3451 tweets, where 2388 represents positive sentiments and 1063 negative sentiments. Lastly, Ganjar Pranowo received 2436 tweets, with 1483 being positive sentiment and 953 being negative sentiment.
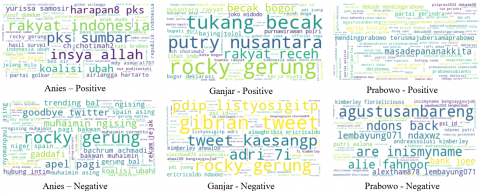
Subsequently, the frequency of words from each predicted category can be utilized to unearth the underlying topics driving netizens to express their opinions. Figure 5 presents the most employed words within each assessment category.
WordCloud is constructed using bigram to capture lexical phrases which represent meaning and political context. Some phrases give insights. For example, in Anies – Positive category, phrase ‘Insya Allah’, which means ‘if God will’ in Islamic way, may correlates that one of the support bases for Anies Baswedan comes from the Islamic community, and phase ‘Koalisi Ubah’, which means ‘Coalition for transformative initiatives’, may indicates support from those who believe that changes should be made to current government policies. In Ganjar – Positive category, ‘Rocky Gerung’ and his controversial condemnation phrase to President Joko Widodo show as frequent token, this may indicate those who supporting Ganjar Pranowo also condemn the political observer Rocky Gerung's statement to President Joko Widodo regarding his views on the new State Capital project, which was trending at the moment.
Figure 2. Number of tweets based on categories
Figure 3. Number of users based on categories
Figure 4. Overall classification result
Figure 5. Most frequently used words based on classification categories
This paper aims to compare 9 machine learning algorithms to find the model with the highest accuracy that is reliable enough to predict Indonesian netizens' support towards presidential candidates. This model is expected to be quite good as an alternative to traditional surveys which are considered more time-consuming and expensive. As evaluation result shows, the Random Forest classifier with TF-IDF 3-Gram vectorization is the method with the highest accuracy compared with other 8 machine learning algorithms and 2 other vectorization techniques, which records f1-score of 0.8448.
To predict public support towards presidential candidate during the campaign periode in day-to-day manner. The developed model can then be used, as shown in deployment process results. There is evident that the entity Prabowo is the presidential candidate with the highest count of positive sentiment. However, it also registers as the entity with the highest count of negative sentiment. This observation highlights the significant concern of the Indonesian society regarding the re-candidacy of the defense minister. In the other hand, Anies Baswedan emerges as a candidate with the highest ratio of positive to negative sentiment.
By analyzing the public opinions expressed on social media, it can serve as an alternative for decision-makers, election analysts, presidential candidates, and their constituents to measure electability levels and capture citizen concern in an affordable and straightforward manner. With the assistance of machine learning approaches, this process can be accelerated, made real-time, and available on-demand. Suitable to capturing the dynamic of political situation and addressing the challenges faced by contesting candidates to remain relevant and in tune with societal concerns. Especially during the final stages of the campaign period, where measuring electability through traditional survey methods becomes increasingly impractical.
However, it is important to acknowledge the limitations of this research. The elimination of "buzzer" accounts has not been incorporated in the process. The elimination of "buzzer" accounts is a crucial aspect in uncovering genuine public opinions towards the presidential candidates, analyzing the demographic support on social media can provide crucial insights for adjusting the campaign strategies according to the demographic data of voters and the suboptimal classification results for the entity "Anies" have sparked the author's curiosity to identify the underlying causes, which will be further investigated in future research.
[1] Ketua Komisi Pemilihan Umum. Peraturan KPU No 3 Tahun 2022 Tentang Tahapan dan Jadwal Pemilihan Umum Tahun 2024. pp. 1-4. https://jdih.kpu.go.id/data/data_pkpu/2022pkpu003.pdf.
[2] W. Gunawan, K. Lestari, M. Purnomo, D. Silvya Sari Indonesian, and D. Silvya Sari, (2019). Democracy without Conflict? Central European Journal of International & Security Studies. https://www.cejiss.org/images/issue_articles/2019-volume-13-issue-4/21-indonesian-presidential-election-2019.pdf.
[3] Komisi Pemilihan Umum. KPU Tetapkan Tiga Pasangan Calon Presiden dan Wakil Presiden Pemilu 2024 - KPU. 2023. https://www.kpu.go.id/berita/baca/12081/kpu-tetapkan-tiga-pasangan-calon-presiden-dan-wakil-presiden-pemilu-2024.
[4] CNBC Indonesia. 17 Survei Terbaru Capres-Cawapres, Anies Vs Ganjar Vs Prabowo, 2023. https://www.cnbcindonesia.com/news/20230716075301-4-454653/17-survei-terbaru-capres-cawapres-anies-vs-ganjar-vs-prabowo.
[5] Groves, R.M. (2011). Three eras of survey research. Public Opinion Quarterly, 75(5): 861-871. https://doi.org/10.1093/poq/nfr057
[6] Valentino, N.A., King, J.L., Hill, W.W. (2017). Polling and prediction in the 2016 presidential election. Computer, 50(5): 110-115. https://doi.org/10.1109/MC.2017.139
[7] Reveilhac, M., Steinmetz, S., Morselli, D. (2022). A systematic literature review of how and whether social media data can complement traditional survey data to study public opinion. Multimedia tools and Applications, 81(7): 10107-10142. https://doi.org/10.1007/s11042-022-12101-0
[8] Rizk, R., Rizk, D., Rizk, F., Hsu, S. (2023). 280 characters to the White House: Predicting 2020 US presidential elections from twitter data. Computational and Mathematical Organization Theory, 29(4), 542-569. https://doi.org/10.1007/s10588-023-09376-5
[9] Liu, B. (2020). Sentiment Analysis: Mining Opinions, Sentiments, and Emotions. Cambridge University Press. https://doi.org/10.1017/CBO9781139084789
[10] Ibrahim, M., Abdillah, O., Wicaksono, A.F., Adriani, M. (2015). Buzzer detection and sentiment analysis for predicting presidential election results in a twitter nation. In 2015 IEEE International Conference on Data Mining Workshop (ICDMW), Atlantic City, NJ, USA, pp. 1348-1353. https://doi.org/10.1109/ICDMW.2015.113
[11] Suciati, A., Wibisono, A., Mursanto, P. (2019). Twitter buzzer detection for Indonesian presidential election. In 2019 3rd International Conference on Informatics and Computational Sciences (ICICoS), Semarang, Indonesia, pp. 1-5. https://doi.org/10.1109/ICICoS48119.2019.8982529
[12] Budiharto, W., Meiliana, M. (2018). Prediction and analysis of Indonesia Presidential election from Twitter using sentiment analysis. Journal of Big Data, 5(1): 1-10. https://doi.org/10.1186/s40537-018-0164-1
[13] Breiman, L. (2001). Random forests. Machine Learning, 45: 5-32. https://doi.org/10.1023/A:1010933404324
[14] Breiman, L., Friedman, J.H., Olshen, R.A., Stone, C.J. (1984). Classification and regression trees. Biometrics, 40(3): 874. https://doi.org/10.2307/2530946
[15] Zhang, H. (2004). The optimality of naive Bayes. The Florida AI Research Society, pp. 562-567.
[16] Chen, T., Guestrin, C. (2016). Xgboost: A scalable tree boosting system. In Proceedings of the 22nd ACM Sigkdd International Conference on Knowledge Discovery and Data Mining, pp. 785-794. https://doi.org/10.1145/2939672.2939785
[17] Ke, G., Meng, Q., Finley, T., Wang, T., Chen, W., Ma, W., Ye, Q., Liu, T.Y. (2017). Lightgbm: A highly efficient gradient boosting decision tree. Advances in Neural Information Processing Systems 30 (NIPS 2017).
[18] Wang, W., Sun, D. (2021). The improved AdaBoost algorithms for imbalanced data classification. Information Sciences, 563: 358-374. https://doi.org/10.1016/j.ins.2021.03.042
[19] Elsaeed, E., Ouda, O., Elmogy, M.M., Atwan, A., El-Daydamony, E. (2021). Detecting fake news in social media using voting classifier. IEEE Access, 9: 161909-161925. https://doi.org/10.1109/ACCESS.2021.3132022
[20] Wang, L., Zhao, X. (2012). Improved KNN classification algorithms research in text categorization. In 2012 2nd International Conference on Consumer Electronics, Communications and Networks (CECNet), Yichang, China, pp. 1848-1852. https://doi.org/10.1109/CECNet.2012.6201850
[21] Indra, S.T., Wikarsa, L., Turang, R. (2016). Using logistic regression method to classify tweets into the selected topics. In 2016 International Conference on Advanced Computer Science and Information Systems (ICACSIS), Malang, Indonesia, pp. 385-390. https://doi.org/10.1109/ICACSIS.2016.7872727
[22] Ceron, A., Curini, L., Iacus, S.M., Porro, G. (2014). Every tweet counts? How sentiment analysis of social media can improve our knowledge of citizens’ political preferences with an application to Italy and France. New Media & Society, 16(2): 340-358. https://doi.org/10.1177/1461444813480466
[23] Schröer, C., Kruse, F., Gómez, J.M. (2021). A systematic literature review on applying CRISP-DM process model. Procedia Computer Science, 181: 526-534. https://doi.org/10.1016/j.procs.2021.01.199
[24] Fathoni, F., Erwin, E., Abdiansah, A. (2023). Multilabel sentiment analysis for classification of the spread of COVID-19 in Indonesia using machine learning. The Indonesian Journal of Electrical Engineering and Computer Science, 31(2): 968-978. https://doi.org/10.11591/ijeecs.v31.i2.pp968-978
[25] Wang, Y. (2017). Advanced naïve bayes algorithm design with part-of-speech tagger on sentiment analysis. In 2017 International Conference on Computer Systems, Electronics and Control (ICCSEC), Dalian, China, pp. 1382-1385. https://doi.org/10.1109/ICCSEC.2017.8446798
[26] Zafarani, R., Abbasi, M.A., Liu, H. (2014). Social Media Mining: An Introduction. Cambridge University Press. https://doi.org/10.1017/CBO9781139088510
[27] Setiawan, Y., Maulidevi, N.U., Surendro, K. (2023). The use of dynamic n-gram to enhance TF-IDF features extraction for Bahasa Indonesia cyberbullying classification. In Proceedings of the 2023 12th International Conference on Software and Computer Applications, pp. 200-205. https://doi.org/10.1145/3587828.3587858
[28] Suhasini, V., Vimala, N. (2021). A hybrid TF-IDF and N-grams based feature extraction approach for accurate detection of fake news on Twitter data. Turkish Journal of Computer and Mathematics Education, 12(6): 5710-5723.
[29] de Godoi Brandão, J., Calixto, W.P. (2019). N-Gram and TF-IDF for feature extraction on opinion mining of tweets with SVM classifier. In 2019 International Artificial Intelligence and Data Processing Symposium (IDAP), Malatya, Turkey, pp. 1-5. https://doi.org/10.1109/IDAP.2019.8875900
[30] Rodríguez, S., Allende-Cid, H., Palma, W., Alfaro, R., Gonzalez, C., Elortegui, C., Santander, P. (2018). Forecasting the Chilean electoral year: Using twitter to predict the presidential elections of 2017. In: Meiselwitz, G. (eds) Social Computing and Social Media. Technologies and Analytics. SCSM 2018. Lecture Notes in Computer Science(), vol 10914. Springer, Cham. https://doi.org/10.1007/978-3-319-91485-5_23