Anitha Ettiyappan*![]() | John Aravindhar David
| John Aravindhar David![]()
© 2023 IIETA. This article is published by IIETA and is licensed under the CC BY 4.0 license (http://creativecommons.org/licenses/by/4.0/).
OPEN ACCESS
The objective of this investigation was to formulate and validate a hybrid algorithm that predicts Diabetic Retinal (DR) detachment at early stages, capitalizing on a synergistic integration of image processing techniques and neural network architectures. Specifically, the focus of the research was on the timely detection of tractional retinal detachment following intravitreal injections of bevacizumab (Avastin), which is used as an adjuvant treatment for severe proliferative diabetic retinopathy in conjunction with vitrectomy. Convolutional neural networks (CNNs) are hindered by a significant challenge: obtaining big labeled datasets. This is a necessary but frequently difficult criterion for efficient CNN training. This problem is solved by integrating the Improved Lion Optimization (ILO) algorithm with the Faster Mask Recurrent Convolutional Neural Network (FMRCNN) to achieve the predicted gradient length. By adding a parallel branch for object mask prediction to the bounding box recognition branch, the ILO algorithm is altered to enhance the FMRCNN. The proposed ILO-FMRCNN model was rigorously tested across a diverse collection of retinal detachment images, demonstrating superior performance in detecting abnormalities related to Diabetic Retinopathy, particularly in advanced stages categorized as level 5 DR severity. Comparative analysis with existing and cutting-edge meta-heuristic algorithms established the proposed model's superiority. The performance metrics obtained from the Eye PACS benchmark CNN method—applied to a dataset comprising 54,000 retinopathy images—yielded an accuracy rate of 98%, sensitivity of 92.20%, specificity of 96%, and an F-score of 95.10%. These results underscore the high efficacy of the hybrid algorithm and its potential to significantly advance early diagnostic capabilities for Diabetic Retinal detachment.
performance measures, deep neural networks, image processing, diabetic retinal detachment, retinal detachment fundus
Retinal detachment-based illnesses are attractive mutual amongst all ages, which decrease the competence of the eye to clear vision, owing to blurry imagining& occasionally whole vision damage [1]. The retina is an extremely thin film that covers the inner surface of the eye and is a responsive layer. This layer is in charge of interacting with the brain's mapping of actual visual objects, such as cameras [2]. Object-reflected sunlight that reaches the eye and is transformed into an equivalent biochemical and electrical impulse before being sent by the visual nerves to different vision centers is how an object is recognized. Cones and rods, the two types of photo-receptors found in the retina, are used for this communication. There are around 100 million rods in the eye that are responsible for both vision in dim and strong light. Rods are extremely sensitive but do not perceive color, while cones, which number 6–8 million and are impacted by diseases like a macular bunker, DR, retinal detachment, retinoblastoma, and retinitis pigmentosa are responsible for color perceptions.
These disorders' specifics are listed below: In the world as a whole, DR is the single most common cause of sight. Age plays a role in how the DR condition develops. DR-related vision is an issue that is quickly getting worse [3]. The drusen, a fatty protein deposition in the retina where the tissue that reacts to light exists, is what causes DR to develop. Since drusen obstruct and lessen the responsiveness of sensitive to light cells, its presence raises the risk to the retina and decreases brightness and clarity perception [4, 5]. Additionally, there are two subtypes of DR: dry macular degeneration and wet macular degeneration. Early identification of these illnesses can help in their treatment [6].
Someone who has developed diabetes will experience DR. To the research, 50% of people who have diabetes will also experience DR issues. The primary factor contributing to this disease's adverse effects on eyesight is prolonged and unregulated blood glucose levels [7]. The primary causes of this condition include proliferative DR and diabetes-related macular edema [7, 8]. The phrase "diabetic macular edoema" refers to the inner retinal detachment thickening caused by diabetes that weakens the circulatory system's vessels and impairs vision. Tiny blood arteries can become damaged in diabetics, which impair blood flow. The retina will be harmed by this. The tissue of the retina will not regenerate after harm, in contrast to other types of tissue [9].
Proliferative DR is the term for the condition in which the scar tissue separates the linked tissues from each other and causes loss of vision [10]. The macula, which is the nucleus or center of the retina, is what gives people their crisp, finely detailed vision. Macular pucker, which is wrinkled naturally occurring, and formed by semi-transparent scarring (occurred owing to lack of blood flow), is a tiny hole that is found at the macula [10-12]. This can constrict, which causes retinal detachment edema, or expansion, to cause a loss of acute eyesight. Rarely, do young babies and kids called retinal detachment tumors [13, 14]. This condition is brought on by a change that took place during child birth's division of cells. Unlike DR, this condition is not inherited from parent to child along with is not influenced by aging. Males and people over the age of 40 are more likely than females to experience detached retinal detachment problems [15]. When the retina is shifted from its original location, a detached retina happens. A retinal detachment condition called retinitis pigmentosa is inherited from one's parents.
As a result, consequences like blindness at night diminished peripheral perception, and fuzzy vision develop. It damages the photo-receptors, or rods, which are responsible for both strong illumination and low-light sight. It is a genetic disorder, children will begin to exhibit its symptoms. Drusen, a yellowish pigment that is dispersed across the retinal detachment region in the DR retina image, can spread to the entire retina if the condition worsens. The causes of DR will be evident if an iris imaging include extrudes, aberrant blood vessels, hemorrhages, and woolly cotton patches. Retinoblastoma, or immature retinal detachment cells, is thought to be the cause of retinal detachment cancer. It appears to be a scar but is an aberrant development in retinal detachment tissue.
DR is characterized by retinal detachment pictures that appear to have weeping, gaps, and even damaged blood vessels. It is characterized by patches of black pigmentation across the middle layer of the retina. According to Figure 1, which depicts an ordinary retinal detachment picture, macular degeneration caused by age, and a regular image, these are some of the usual features of retinal detachment-based disorders. The method of creating a computerized system with all of these features will be confusing to the framework, which will lower the system's efficiency.
Figure 1. Compares the visual traits of retinal detachment disorders. Normal, DR, and retinopathy
The CNN models perform poor with small training sample due to local minima problem, vanishing gradient problem, etc. Sometimes the performance of supervised learning models is not up to the mark in case of model overfiting or under-fitting due to the dependency on gradient of the error. In such a case, the feature learning in unsupervised mode can enable the model to be free from the dependency on error gradient and can lead to better generalization performance. The features learned in unsupervised model can also be used in supervised classification model to introduce nonlinearity and improve the accuracy in the model. Hence, the work proposes the use of optimization model to learn optimized feature without depending upon the error gradient.
The prime objectives of this research are to predict the detection of DR. With this, we have tried to resolve some major issues that occur while dealing with the problem of classification using fundus image for DR. Though, various DL approaches have been used for the classification of DR, there are some difficulties arise in CNN such as:
•Tuning parameters of CNN for the classification of DR
•Proper and detail feature extraction of the fundus image
•Local minima and vanishing gradient problem of the CNN due to back-propagation
So, our contribution in this work develops ILO-FMRCNN satisfying the above issues of neural network models for the classification of DR.
A new method for predicting and classifying retinal detachment pictures has been developed to address the aforementioned problems. This approach aids in reducing the issue of vision loss brought on by DR. Numerous studies have proposed numerous methods to identify DR precisely. Neovascularization, lesions, etc. The application of curvelet equations derived from endoscopies and retinal detachment images is common. A three-step categorization procedure was used in the trial, which involved 70 diabetics [9-10]. The anticipated method thus achieves a sensitivity value of 100%.
A technique for categorizing DR pictures treated by prior micro aneurysms has been developed [11]. The circularity and position of the micro aneurysm were also taken into consideration when extracting the features. According to a 2013 statement [13], Three strategies for sentimental and sub anterior recognition were applied using filtering. In the stage of the very first system, all probable AD-affected regions in the retinal detachment picture were found [12].
Four groupings were resolute: complete retina, vision loss, non-destructive diabetes mellitus, &proliferative diabetic neuropathy. In the systematic works, they focused on a whole of 238 retinal detachment fundus images, and 5 texture structures were learned from the goal fundus images, with a suggestion, consistency, optimistic long-run pressure, short-run focus, and run proportions [14]. Then, to achieve accurate identification, a Support Vector Machine (SVM) was given the appropriate properties [15].
At this point, the research employed a range of ways to discern between abnormal and typical retinal detachment pictures. One of these is an automated method for detecting diabetic macular edoema. In this process, which locates the fovea, the macular regions were identified using the categorization level of the insulin retinal detachment investigations from the beginning of therapy [16]. The architectures of the solvers utilized and the subsequent stages can affect the outcomes of the diagnostic effectiveness. The diagnostic segment, which is related to one of the reasons given, is intended to be improved [17].
Deep Learning (DL), a strong and comprehensive form of ML, is anticipated to provide the advantage of deep picture analysis of information for superior outcomes in this scenario [18]. The research's standard framework, also referred to as the "educating algorithm," has numerous layers of complexity that interact with one another. Every level is closely connected to the one before it and bases its judgment on the output given by that layer to cope with unorganized or unprocessed information with greater efficiency [19]. Studies utilizing high-end graphics processors showed reliability and SE outcomes of 75% and 95%, accordingly, on validation information gathered from 5,000 points of information.
CNN ranked different levels of DR on 128,000 backdrop photographs with the aid of 54 licensed optometrists [20, 21]. Both CNN models obtained an SP of 93.9% and SE of 97.5% in the categorization of the DR phase. The research's objective is to develop a deep learning system that automatically selects which is most helpful patching and photographs to construct usable masks and evaluations of DR to forecast DR-related regions for importance [22, 23]. With minimal or no training information, the Active Deep Learning (ADL) method, a powerful artificial intelligence method, may achieve excellent precision. CNN is an option that, considering into consideration its application, may handle imaging information of people with diabetes mellitus effectively [24].
The whole thing has an easy-to-understand structure and even employs fundamental image processing methods during the preliminary processing phase, in addition to its distinctiveness and advantages. While previous research attempted to accomplish acceptable outcomes by combining along with altering a variety of methods, the presented system in this work uses Contrast-Limited Adaptive Histogram Equalization (CLAHE) or Histogram Equalization (HE), effective approaches to which was before information and gets ready it for the CNN. The strategy proposed in this study is a suitable solution to the issue of improving the categorization accuracy of backdrop retinal detachment images by utilizing a combination of methods with a high computation workload.
The traditional image processing techniques for DR diagnosis includes the extraction of DR features as the primary step. Since the features are manually hand crafted, it showed reliable performance. However, the success of the algorithm purely lies in the feature extraction. Since it is done manually, it is more error prone.
Further manual extractions of features are difficult. Hence most of the researchers had now moved to the recent technology, deep learning. The beauty of a deep learning is that it needs only data to get trained. Once sufficient amount of data is available, the algorithm itself will learn the necessary features for DR diagnosis. Looking into the existing deep learning architectures, most of the model performs well. However, the model lacks in purifying the data by removing the noise and uncertainty in it.
Data purification is essential as the medical images will contain uncertain information with the presence of noise. Though little architecture exists for data purification, the model’s representation is insufficient to learn the fine grained features of the DR. Hence a model with good representational learning is required to extract the DR features by purifying the data. Further most of the model will focus on the entire region of the retinal image for extracting the features. It is sufficient to look at the specific region of interest for DR diagnosis. In addition, most of the research has resized the retinal image to the standard size of the deep learning architecture. During such a process, the important feature, microaneurysms size gets reduced making the model difficult to extract it. Microaneurysms are the initial change in the retina during DR development. Hence a model capable of addressing this issue and detecting the DR at early stage is necessary.
Early detection through proper diagnosis is the only way to the blindness rate causing due to DR. The requirement of automated system for DR screening is at its peak. Image classification, pattern recognition, ML and DL are the principal approached used for the same. DL methods like CNN is found and proved to be the most appropriate technique to be utilized as a part of screening the DR for classification. With a principal intention to develop an automated system for the detection of DR tried some major issues that occur while dealing with the problem of classification using fundus image for DR are observed as follows:
•Tuning parameters of CNN for the classification of DR.
•Proper and detail feature extraction of the fundus image.
•Local minima and vanishing gradient problem of the CNN due to back-propagation.
3.1 Acquisition of dataset
The strategy proposed in this work uses HE and CLAHE, which are effective ways of preliminary processing information and getting it ready for CNN, unlike a comparable study that attempts to obtain successful outcomes by combining and changing various methodologies. The method put forward in this study is a suitable solution to the demand for techniques that integrate a heavy computational burden with a deductive approach to improve the categorization accuracy of images of the retinal detachment fundus. For every DR class, an optometrist rates every specimen from 0 to 4 [25]. The moderate, severe, severe, and proliferation DR are each indicated by an index of 1, 2, 3, and 4, accordingly, while the standard state is denoted by a level of 0. And the proposed ILO-FMRCNN network uses these sizes as labels. There is no set criterion for the quality of vision. Every image includes a variety of illumination, colors medians, and ratios of dimensions, in addition to unusual illumination and an additional black limit. The classification and division skills of DR-based CAD approaches are negatively impacted by these retinal detachment samples, as illustrated in Figure 2.
Figure 2. EyePACS sample reference
3.2 Data pre-processing
The non-linear contrast technique is then used on the J channels to reduce variable local contrast, boost image contrast, and improve odd lighting. Low light often results in images with poor brightness and scant color picture information. Areas of the source photos with little to no light were detected as grey after conducting the aforementioned normalization technique on them [26]. Strange illumination that illuminated dark areas has been eliminated. There is no light or colored data present in the dark sections, which would have been apparent in grey. Although the biological components of the photoreceptor layer are mostly black in hue. This feature could be used to take the entering background image's quality into account during the normalization process. Consider (R, G, B) as a color vector with each bar having a value between zero and 255. The word "grey" describes the color.
$96 \leq g \leq 160$ (1)
$\begin{aligned} & |r-g| \leq 15 \\ & |g-b| \leq 15\end{aligned}$ (2)
Then, to isolate the background and eliminate black borders, each color wallpaper image is in the center. A label patch dataset is created by reducing every image to a 48-by-48-pixel patch, encompassing both typical and unusual DR cases.
The grouping issue with our ILO-FMRCNN templates is resolved by purposefully generating 7 new label conservation samples with 900, 1800, and 2700 rotational changes. Following the information's enrichment and cropped processes, data dividers are produced using selected random portions of every class. In the training/test divisions, there were 8760/1314 patches for each of the categories.
3.3 ILO-FMRCNN model
The amazing CNN DL setup is structurally and theoretically inspired by the hierarchical organization of the natural visual cortex. It can identify visual patterns with little to no training and generate ideas from the data. The CNN is designed to be strong enough to produce forecasts that are correct even when an object's particular position is distorted, translated, or partially constant. Additionally, the benefits of information enrichment are required to learn input in variances to improve the localization precision of the CNN system. The proposed ILO-FMRCNN model's pipeline for assessing the level of vision loss along with selecting important regions is shown in Figure 3, and the appropriate information from the CNN employed in our study is listed in Table 1.
Figure 3. Proposed ILO-FMRCNN architecture
Table 1. Proposed system structure template
|
Layers |
Types |
Feature Map |
Output (Shape) |
Feature Map Kernel Size |
|
1 2 3 4 5 6 7 |
Input Convolution Max pooling Convolution Max pooling FC Softmax |
3 22 22 52 52 - - |
48 × 48 × 3 44 × 44 × 20 22 × 22 × 20 18 × 18 × 50 9 × 9 × 50 1 × 1 × 500 5 |
- 5 × 5 × 3 2 × 3 5 × 5 × 20 2 × 2 - - |
Utilizing parameters for input, the proposed method of learning for the ILO-FMRCNN emission is optimized and modified. The proposed model typically uses the following control variables: periods, modeling difficulty, integral benefit learning decaying percentages, package terms of size, decay of weight ratio, optimizer, function activation, and velocity.the learning decay ratio was set to 0.1, the learning rate was 1×10⁻³, and the weighted loss was set to 1×10⁻⁴.
The leak-rectified linear unit functioned as a function of activation for layers 1, 3, 5, and 6. These layers' biases and weights are incorporated at startup. At level 7, bias is generated randomly using the Gaussian density of probability method.ADL looked into the most effective techniques for annotating photographs from the collection of large-sized images to increase the classifier's accuracy. The first part starts by defining the Batch Setting (BS) variant of the ADL problem, which is used in this study to train a hypothetical ADL system. Despite having a budget of 1, the conventional ADL method consults a professional before purchasing each image label.
The single image label has a very steady and proportionally large impact on ILO-FMRCNN local optimization techniques, making it impossible to train ILO-FMRCNN with this type of image labeling method. Additionally, it is challenging to train ILO-FMRCNN models in the series of picture labels considering the scope of the existing ADI difficulties. As a result, the proposed strategy concentrates on ADL batch settings, where an SME tags a moderate set of photographs after every iteration. When planning the acquisition of knowledge for the batch-specific example, we use the top limitation of active knowledge loss specified in Eq. (3):
$\min _{S^1:\left|S^1\right| \leq b} L_{i, j \approx p k}\left[l\left(i, j ; F_{S^0 \cup S^1}\right)\right]$ (3)
As an outcome, the ADL method uses the batch case with a dynamic set of b-budget, as previously mentioned. This specific approach is taken into consideration in many stages to select relevant samples. The proposed ADL technique also considers several images produced by the myopic strategy to address the single franchise of sample labeling, such as
$\min _{S^{q+1:\left|S^{q+1}\right| \leq b}} L_{i, j \approx p k}\left[l\left(i, j ; F_{S^0 \cup \ldots S^{q+1}}\right)\right]$ (4)
$\theta_{t+1}=\theta_t-\alpha \Delta Y_x\left(\theta_t\right)$ (5)
To contribute this organized value to the learning dataset, a medical specialist was asked to annotate these cases. The Predicted Descent Length method uses an unlabelled pool of findings, and where denotes sorted information from this pool. For the first time, EGL was created to be used in multi-instance learning scenarios. The study described in this article employed an analogous method to choose images of the ILO-FMRCNN. To get the corresponding likelihood of the Soft-max layer of the network for the likelihood in statistical terms that the sample has the label, a forward propagation via ILO-FMRCNN was conducted. Then, the change in gradient length of the model was determined by using the backward propagation method to assess the Hermitian norm of the gradient parameters.
$\Theta\left(i^x\right)=\sum_{y=1}^l p\left(j^x=y\left[i^x \Delta y_x(\theta)\right]\right)$ (6)
By using this technique, the clinical specialist may efficiently develop a model by labeling only the images that are most pertinent to the problem at hand. Additionally, it facilitates picture commentary, saving ophthalmologists' energy and time. The method for selecting the most relevant image is covered in algorithm 1.
|
Algorithm 1: ADL for image selection using ILO-FMRCNN |
|
Input: D – Labeled data; T - training set; n- number of initial images; Tn– randomly selected images Output: Desired image/ Step 1: Initial training of labeled and training data using from n. Step 2: While convergence == NULL { Step 3: for each image from $\frac{T}{T_n}$ { Step 4: Patch the image and compute $\partial_{\text {image }}=\sum_{\text {patch } \epsilon \text { image }} \theta($ patch $)$, using M } Step 5: Sort the process on all $\partial_{\text {image }}$ values Step 6: Return the highest sum of Imax } Step 7: $T_n=T_n \cup I_{\max }$ Step 8: $D_n=\left\{\right.$ patch $\in D_1$, for all $\left.I \in T_n\right\}$ Step 9: Update M with the patches $\mathrm{D}_1$ and k selected patches via algorithm 1 } |
The outcomes of the ILO-FMRCNN structure's design are evaluated by running measurements on the ethnographic data. The evaluations of the proposed ILO-FMRCNN method for selecting one of the most pertinent optical specimens, dividing DR potential areas or spots and offering qualitative and numerical outcomes. The weight optimization technique for the ILO-FMRCNN network was developed using the Stochastic Gradient Descent (SGD) algorithm, which operates at 0.9 speeds in Nesterov mode. In all learning domains, it was discovered that this range was stable. The final network formation is finished after 30 eras with a lot size of 32 and a rate of learning of 0.01. Five sets of 32 datasets are first used to create the proposed model shown in Figure 4.
Figure 4. Proposed architecture step by step
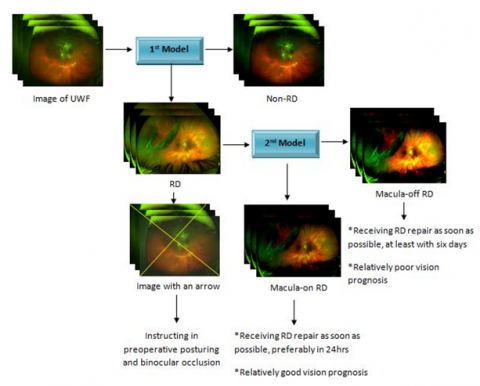
With no overlaps among clients, all eligible photos were split arbitrarily into 3 sets: a training collection of 70% (7323 images), a validation collection of 15% (1556 images), and an evaluation set of 15% (1572 images). The second-deep learning model was created to distinguish between macula-on RD including macula-off RD using 1771 RD photos after eliminating 238 images of fair quality. The training set consisted of 1239 images, and the validation collection of 266 images, including the evaluation set of 266 images. Figure 2 presents the features of the two systems mentioned above. For every test, Caffe DL and Python 3.6 were utilized. In our experiments, we assessed the losses for learning, and reliability on the verification set, along with validation. The proposed ILO-FMRCNN model's usefulness in figuring out the degree of DR severity has been shown utilizing several results, including ACC, SD, SE& F-Score. The efficiency of the method was widely compared using SP and SE metrics according to the deductive reasoning of the True Positive Rate versus the False Positive Rate. The True-Positive presents the actual case together with the positive values of the categorization forecast. False-positive results show the actual case's negative values. On the other hand, true-negative shows the N values for the classifier's real while participating in predicted labels. While the machine learning algorithm N is given, the False-Negative shows that the true class score is favorable. The metrics SE, SP, F-Score, and ACC are computed via Eqs. (7) - (11).
$\begin{aligned} & \text { SE }=\text { True }- \text { True Positive Rate } =\frac{\text { True Positive }}{\text { True Positive }+ \text { False Negative }}\end{aligned}$ (7)
$S P=1-\left(\frac{\text { False Positive }}{\text { False Positive }+ \text { True Negative }}\right)$ (8)
$\begin{aligned} & \text { False - False Positive Rate (FPR) } =\frac{\text { False Positive }}{\text { False Positive }+ \text { True Negative }}\end{aligned}$ (9)
$\begin{gathered}A C C=\text { (True Positive + True Negative) / (True } \\ \text { Positive }+ \text { False Negative }+ \text { False Positive }+ \text { True }\text { Negative) }\end{gathered}$ (10)
$\begin{gathered}F \text {-score }=2 \text { True Positive / ( } 2 \text { True Positive }+ \text { False } \text { Negative }+ \text { False Positive })\end{gathered}$ (11)
3.4 Dimension reduction strategy
The DBN approach is used to learn the information, such as a retina image with high-precision specifics, but processing such a significant amount of information necessitates a specialized GPU or high-end equipment. Therefore, the deep learned characteristics also require the dimension-reducing method. The efficacy of the method of classification will be improved by choosing the powerful and important characteristics. Another issue is the selection of these traits, which is resolved by considering what and how to choose. The approach of using an ANN technique as a remedy in such a way that it transfers the characteristics of the input to itself, as demonstrated in Figure 4. Typically, input that corresponds with the target is needed for ANN training. Neural network training is known to be a mapping procedure. The output layer (OL), hidden layer (HL), and input layer (IL) make up the ANN. The input and target used determines the IL and OL lengths. However, the HL is a user-generated allocation that is chosen at random or computed to fit the learning method.
To create a multilayered neural network, HL needs to establish 2 constraints: (1) the total number of layers used to stack during the training phase, and (2) the number of neurons used for every level. Each hidden layer is given an HL phase such that it has fewer neurons than its predecessors, hence reducing the overall size of the characteristics. Expect the sum of features from DBN is2xthen layer-1 of HL with 2xneurons, layer-2 of HL with 2x-1 neurons, layer-3 of HL with 2x-2 neurons etc. The neuron decrease for every level will outcome in decreasing the feature input to the following step. This will decrease the number of features from 2x to 2x-1 in every stage.
Figure 5. Architecture of DBN
The first layer of HL along with the median behavior of the information provided patterns can be gathered by the Generalized Regression Neural Network (GRNN) [22]. It consists of radial components that group the information rather than representing every learning batch individually. The GRNN method will run more quickly if the undetectable units are changed. This is the key argument in favor of GRNN. The network's transfer of information is likewise decreased by the 2x step-by-step decrease in neurons. As depicted in Figure 4, information is taken from the learned GRNN at the phase of the concealed layer where the number of neurons is limited to meet the needs. As a result, the information obtained will be in a decreased dimensional state. The numerous deep characteristics of an image will be collected by the next level of hidden layer neurons as a result of the entire learning process performed by the previous phase of hidden layer neurons, which in turn propels the system towards outstanding performance shown in Figure 5 and Figure 6.
Figure 6. Strategy of feature dimension reduction
4.1 Performance measures analysis
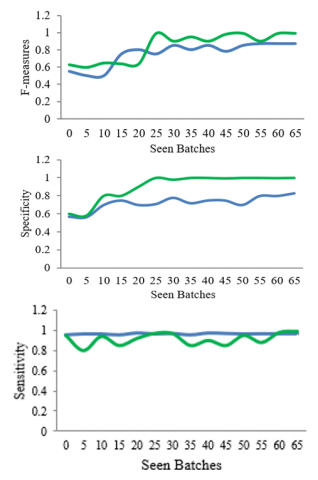
After the picture normalization step, augmenting, and information trimming, it took a median of 25 seconds to convert an input raw retinograph photo into the standard and CIECAM02 color space model or well-enhanced perceptual-oriented color format. The median duration spent training to optimize deep learning characteristics for the ILO-FMRCNN was 13.45 seconds, and the median time for building the last layer of learning was 1.78 seconds. Instead of patching, professional ophthalmology chooses the most pertinent retinographic samples for the ILO-FMRCNN model that was proposed in the experiment. The network parameters are then updated after algorithm 1 chooses the most pertinent image. With this method, the network's convergence takes place 15 lots later than with the previous method. It further highlights the superiority of our training approach over other widely used methods for creating CNN models.
Figure 7. Performance measures of ILO-FMRCNN with the existing system
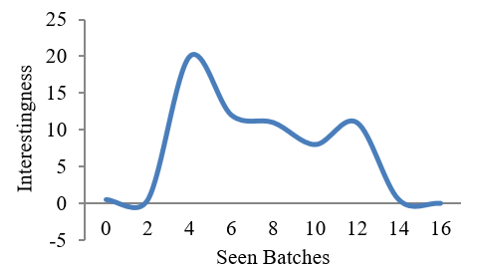
After the first simulation was finished, a piece of the image sequence was calculated by adding up all of its EGL values. It describes the criteria for selecting images for algorithm outputs. Figure 7 [27] displays the image and the perceived enjoyment scores for different learning periods. This value was plotted and analyzed as the network studied different batches, as seen in Figure 8. In this instance, the decrease in attribute value following model completion was seen. The loss characteristic won't keep getting worse, and the variable average is extremely close to zero.
An information test based on F-score, SE, SP, and ACC was conducted on 54,000 digitized retinal detachment samples to ascertain how successfully the ILO-FMRCNN method classified each NPDR class for DR diagnosis. Based on Table 2, the SE (92.20%), SP (95.10%), F-score (93%), and ACC (98%) of the proposed ILO-FMRCNN approach have all greatly increased. We compared this outcome from the EDNN system provided with numerous current in-depth learning and training methodologies for the 54,000 test specimens in the EyePACS collection.
Figure 8. Batches vs Interestingness
Table 2. Proposed model performance measures
|
Classes |
Levels (Severity) |
SE (%) |
SP (%) |
ACC (%) |
F-Score (%) |
Error Rate |
|
0 1 2 3 4 |
Normal MNPDR NPDRM SNPDR PDR |
94. 17 92. 47 88. 57 88. 47 89. 47 |
97. 72 97. 01 93. 32 92. 22 92. 33 |
99 95 94 92 90 |
98 96 91 92 91 |
0. 445 0. 455 0. 552 0. 678 0. 512 |
|
Total result |
|
92. 22 |
95. 12 |
99 |
94 |
0. 543 |
The capacity of ADL to continuously derive discriminating information based on training data while maintaining a decreased computing overhead is a significant advantage. This provided a simple and reliable way to train DL models as well. After a thorough analysis, it was discovered that the end-to-end training methodology was the primary cause of the decline in sensitivity and dependability of ML approaches.
The simulation behaved poorly during the fragmentation and recognition of DR lesions and was unable to determine ROIs by neglecting the intricate retinal detachment components that are covered by the eye's circulatory networks. Exercises that call for an understanding of items, such as plants, animals, etc., frequently involve transferable lessons.
4.2 Pre-train ILO-FMRCNN networks
The effectiveness of the proposed ILO-FMRCNN system and pre-training ILO-FMRCNN systems were assessed and compared using statistics. Table 3 demonstrates that the ILO-FMRCNN model performed better than pre-train ILO-FMRCNN models in the DR test to be recognized. This result demonstrates how ILO-FMRCNN may do better than the well-known VGG16 methods. With an ACC of 91% and an SP of 90%, VGG16noFC2 outperforms VGG16 and VGGG16noFC1 in producing the best outcomes from pre-train VGG16 CNN structures. Although GV16noFC2's 78% SE value was a little less than that of its competitors. Our ILO-FMRCNN method also generates accurate pixel-based categorization for DR injuries, as seen in Figure 9.
Figure 9. DR lesions segmentation retinal detachment
Table 3. Comparison of ILO-FMRCNN with various structures of VGG16
|
Methods |
SE (%) |
SP (%) |
ACC (%) |
F-Score |
|
VGG16 VGG16noFC1 VGG16noFC2 Proposed ILO-FMRCNN |
82 89 79 95.10 |
83 80 91 98 |
84 87 92 92.20 |
85 85 92 96 |
Figure 10 shows the receiver operating characteristic (ROC) curves of the deep learning models developed from the test data and how they performed when measured against a reference standard for generalist ophthalmologists.
AUC (area under the ROC curve); general ophthalmologists A and B, both with five years of experience working in physical examination centres; and regular ophthalmologists A and B, both with three decades' experience. Table 2 displays the deep learning models and general ophthalmologists used to identify RD and determine the macular condition. The first model had a 96.1% sensitivity along with a 99.6% specificity with an area under the curve (AUC) of 0.989 (95% confidence interval (CI): 0.978-0.996) for RD detection as compared to the general ophthalmologist with 5 years of experience who had a 95.4% sensitive along with a 99.8% particularity along with the general ophthalmologist with 3 years of experience who had a 94.4% sensitivity and 99%. The second model had a 93.8% sensitivity along with a 90.9% particularity with an AUC of 0.975 (95% CI: 0.957-0.988) for differentiating macula-on RD from macula-off RD, compared to the general ophthalmologist with 5 years of experience who had a 91.3% sensitivity and a 92.4% particularity and the broad ophthalmologist with 3 years of experiences who had an 86. The unweighted Cohen's coefficient for the first models and the second model, when evaluated to the reference standard, was 0.965 (95% CI: 0.948-0.982) and 0.811 (95% CI: 0.736-0.887), correspondingly.
(a) Retinal detachment detection performance
(b) Performance of macula-on retinal detachment detection
Figure 10. ROC curves of the DL
4.3 Discussions
This research aids in the creation of a real-time approach for identifying ocular conditions linked to DR. State-of-the-art methods connected to multi-layer deep learning architecture and pre-processing of images have been implemented to enhance the quality of images for efficient learning of features along with categorizing the severity of DR. One of the key advantages of the proposed ILO-FMRCNN model is that it can employ the relevant part of the test set and yet deliver outcomes similar to the model learned on the information that was provided. The proposed ILO-FMRCNN architecture was tested on 89,000 background images. Its primary advantage is the quick pattern creation that it performs with a small number of highly pertinent coaxial samples. In comparison to the OMS technique, this method gave the system a quicker and more effective local divergence. The ILO-FMRCNN strategy's main potential is its capacity to distinguish DR-related lesions and produce practical masking for forecasts.
Additionally, it was mentioned that the ILO-FMRCNN approach has a technical issue when processing huge volumes of information, but that this might be fixed using traditional sampling techniques. Test results indicate that with a smaller set of information, the ILO-FMRCNN model functions better. The original label should be used to conduct a more thorough analysis given the volume of information. Efficiency will be improved through the application of the proposed selection of information algorithm and guided learning. The Sample false effect is shown in Figure 11.
Figure 11. Sample false effect
Due to the significant impact of ongoing instructional procedures, DL approaches may become increasingly important in emergency medical imaging assessment jobs as they do away with the need for extensive label collection. These methods, where the cost of the label is expensive, include the localization of lesions for glaucoma and macular edoema, and the evaluation of histological, pulmonary, and respiratory nodule, in addition to tomography. The proposed ILO-FMRCNN system also failed to accurately evaluate several images linked to PDR, moderate severity levels, including serious DR, as illustrated in Figure 10.
The aforementioned simulations demonstrate that the automated analysis system can diagnose retinal detachment conditions like retinitis pigmentosa, age-related molecular degeneration, diabetic retinopathy, retinal detachment, retinoblastoma, and bunker using a deep learning-based extraction of features technique. Building a system that can categorize datasets with common properties is the primary goal here.
-It is challenging to differentiate between the five DR severities using a fundus picture because of the intricate architecture and diverse appearance of the lesions therein.
-Only the DR class is used in the vast majority of studies in the literature, and the results are crucial.
-Our research demonstrated the 7-layered Architecture employing an ILO-FMRCNN that mechanically and concurrently recognizes the 5 phases of the DR with the localization of lesions using some ground-truth annotated retina samples, compared to using the whole set of learning instances.
-An input background image was first previously processed to improve brightness in the reinforcement methods and uniform color scheme before being incorporated into the algorithm to learn its distinctive characteristics.
This hybrid approach of integrating FMRCNN with optimization algorithms worked well for the DR Classification. This preliminary investigation of DR Classification is crucial to diagnose Diabetic Retinopathy and based on these results further referral to the medical experts can be provided to the patients.
[1] Shaheed, K., Mao, A., Qureshi, I., Kumar, M., Hussain, S., Ullah, I., Zhang, X. (2022). DS-CNN: A pre-trained Xception model based on depth-wise separable convolutional neural network for finger vein recognition. Expert Systems with Applications, 191: 116288. https://doi.org/10.1016/j.eswa.2021.116288
[2] Riyaz, L., Butt, M.A., Zaman, M. (2022). A novel ensemble deep learning model for coronary heart disease prediction. Revue d'Intelligence Artificielle, 36(6): 825-832. https://doi.org/10.18280/ria.360602
[3] Luo, X., Li, J., Chen, M., Yang, X., Li, X. (2021). Ophthalmic disease detection via deep learning with a novel mixture loss function. IEEE Journal of Biomedical and Health Informatics, 25(9): 3332-3339. https://doi.org/10.1109/JBHI.2021.3083605
[4] Tufail, A.B., Ullah, I., Khan, W.U., et al. (2021). Diagnosis of diabetic retinopathy through retinal fundus images and 3D convolutional neural networks with limited number of samples. Wireless Communications and Mobile Computing, 2021: 6013448. https://doi.org/10.1155/2021/6013448
[5] Ajaz, A., Kumar, H., Kumar, D. (2021). A review of methods for automatic detection of macular edema. Biomedical Signal Processing and Control, 69: 102858. https://doi.org/10.1016/j.bspc.2021.102858
[6] Abbas, Q., Qureshi, I., Ibrahim, M.E. (2021). An automatic detection and classification system of five stages for hypertensive retinopathy using semantic and instance segmentation in DenseNet architecture. Sensors, 21(20): 6936. https://doi.org/10.3390/s21206936
[7] Balamurugan, K., Latchoumi, T.P., Ezhilarasi, T.P. (2022). Wearables to improve efficiency, productivity, and safety of operations. Smart Manufacturing Technologies for Industry 4.0, pp. 75-90. https://doi.org/10.1201/9781003186670-9$
[8] Hatua, A., Subudhi, B.N., Veerakumar, T., Ghosh, A. (2021). Early detection of diabetic retinopathy from big data in hadoop framework. Displays, 70: 102061. https://doi.org/10.1016/j.displa.2021.102061
[9] Smitha, A., Jidesh, P. (2022). Classification of multiple retinal disorders from enhanced fundus images using semi-supervised GAN. SN Computer Science, 3: 59. https://doi.org/10.1007/s42979-021-00945-6
[10] Anand, M., Balaji, N., Bharathiraja, N., Antonidoss, A. (2021). WITHDRAWN: A controlled framework for reliable multicast routing protocol in mobile ad hoc network. Materials Today: Proceedings. https://doi.org/10.1016/j.matpr.2020.10.902
[11] Amin, J., Anjum, M.A., Malik, M. (2022). Fused information of DeepLabv3+ and transfer learning model for semantic segmentation and rich features selection using equilibrium optimizer (EO) for classification of NPDR lesions. Knowledge-Based Systems, 249: 108881. https://doi.org/10.1016/j.knosys.2022.108881
[12] Abbas, Q., Qureshi, I., Yan, J., Shaheed, K. (2022). Machine learning methods for diagnosis of eye-related diseases: A systematic review study based on ophthalmic imaging modalities. Archives of Computational Methods in Engineering, 29(6): 3861-3918. https://doi.org/10.1007/s11831-022-09720-z
[13] Latchoumi, T.P., Swathi, R., Vidyasri, P., Balamurugan, K. (2022). Develop new algorithm to improve safety on WMSN in health disease monitoring. In 2022 International Mobile and Embedded Technology Conference (MECON), Noida, India, pp. 357-362. https://doi.org/ 10.1109/MECON53876.2022.9752178
[14] Mohammed, H., Tannouche, A., Ounejjar, Y. (2022). Weed detection in pea cultivation with the faster RCNN ResNet 50 convolutional neural network. Revue d'Intelligence Artificielle, 36(1): 13-18. https://doi.org/10.18280/ria.360102
[15] Sungheetha, A., Rajesh, S.R. (2021). Design an early detection and classification for diabetic retinopathy by deep feature extraction based convolution neural network. Journal of Trends in Computer Science and Smart Technology, 3(2): 81-94. https://doi.org/10.36548/jtcsst.2021.2.002
[16] Sreekanth, G.R., Latha, R.S., Suganthe, R.C., Sivakumar, S., Swathi, N., Sonasri, N., Vaishnavi, S. (2021). Automated detection and classification of dr and diabetic macular edema in retinal detachment fundus images using deep learning approach. Nveo-Natural Volatiles and Essential Oils, 8(5): 61-70.
[17] Latchoumi, T.P., Ezhilarasi, T.P., Balamurugan, K. (2019). Bio-inspired weighed quantum particle swarm optimization and smooth support vector machine ensembles for identification of abnormalities in medical data. SN Applied Sciences, 1(10): 1137. https://doi.org/10.1007/s42452-019-1179-8
[18] Li, F., Wang, Y., Xu, T., et al. (2022). Deep learning-based automated detection for diabetic retinopathy and diabetic macular oedema in retinal fundus photographs. Eye, 36(7): 1433-1441. https://doi.org/10.1038/s41433-021-01552-8
[19] Abbood, S.H., Hamed, H.N.A., Rahim, M.S.M., Rehman, A., Saba, T., Bahaj, S. A. (2022). Hybrid retinal image enhancement algorithm for diabetic retinopathy diagnostic using deep learning model. IEEE Access, 10: 73079-73086.https://doi.org/10.1109/ACCESS.2022.3189374
[20] Butt, M.M., Iskandar, D.A., Abdelhamid, S.E., Latif, G., Alghazo, R. (2022). Diabetic retinopathy detection from fundus images of the eye using hybrid deep learning features. Diagnostics, 12(7): 1607. https://doi.org/10.3390/diagnostics12071607
[21] Das, S., Kharbanda, K., Suchetha, M., Raman, R., Dhas, E. (2021). Deep learning architecture based on segmented fundus image features for classification of diabetic retinopathy. Biomedical Signal Processing and Control, 68: 102600. https://doi.org/10.1016/j.bspc.2021.102600
[22] Sneha, P., Balamurugan, K. (2022). Investigation on wear characteristics of a PLA-14% bronze composite filament. In Recent Trends in Product Design and Intelligent Manufacturing Systems: Select Proceedings of IPDIMS 2021, pp. 453-461. https://doi.org/10.1007/978-981-19-4606-6_42
[23] Alyoubi, W.L., Abulkhair, M.F., Shalash, W.M. (2021). Diabetic retinopathy fundus image classification and lesions localization system using deep learning. Sensors, 21(11): 3704. https://doi.org/10.3390/s21113704
[24] Bilal, A., Zhu, L., Deng, A., Lu, H., Wu, N. (2022). AI-based automatic detection and classification of diabetic retinopathy using U-Net and deep learning. Symmetry, 14(7): 1427. https://doi.org/10.3390/sym14071427
[25] Asia, A.O., Zhu, C.Z., Althubiti, S.A., Al-Alimi, D., Xiao, Y.L., Ouyang, P.B., Al-Qaness, M.A. (2022). Detection of diabetic retinopathy in retinal fundus images using CNN classification models. Electronics, 11(17): 2740. https://doi.org/10.3390/electronics11172740
[26] Kadan, A.B., Subbian, P.S. (2021). Diabetic retinopathy detection from fundus images using machine learning techniques: A review. Wireless Personal Communications, 121(3): 2199-2212. https://doi.org/10.1007/s11277-021-08817-1
[27] Maqsood, S., Damaševičius, R., Maskeliūnas, R. (2021). Hemorrhage detection based on 3D CNN deep learning framework and feature fusion for evaluating retinal abnormality in diabetic patients. Sensors, 21(11): 3865. https://doi.org/10.3390/s21113865