Abdallah Azzouz*![]() | Billel Bengherbia
| Billel Bengherbia![]() | Patrice Wira
| Patrice Wira![]() | Nail Alaoui
| Nail Alaoui![]() | Abdelkerim Souahlia
| Abdelkerim Souahlia![]()
© 2023 IIETA. This article is published by IIETA and is licensed under the CC BY 4.0 license (http://creativecommons.org/licenses/by/4.0/).
OPEN ACCESS
The analysis of electrocardiogram (ECG) signals is imperative for the diagnosis of cardiac anomalies. However, the integrity of ECG signals is often compromised by the presence of noise, such as Additive White Gaussian Noise (AWGN) and Power Line Interference (PLI), which can obfuscate critical signal characteristics during acquisition. AWGN typically permeates ECG recordings through electronic noise, movement artifacts, and environmental factors, whereas PLI is commonly induced by alternating current power sources at frequencies of either 50 or 60 Hz, contingent upon the geographical location. In this investigation, a novel denoising strategy employing a synergistic application of the Genetic Algorithm (GA) and Wavelet Transform (WT) is presented. The WT parameters are meticulously optimized through the Genetic Algorithm, which conducts a systematic search to ascertain the optimal decomposition levels and thresholding values for noise reduction. This iterative optimization process refines WT parameter settings to attenuate noise effectively. The efficacy of the proposed approach is rigorously evaluated using the benchmark MIT-BIH Arrhythmia Database, a renowned and publicly accessible collection of annotated ECG recordings. Objective metrics, namely the Signal-to-Noise Ratio (SNR) and the Percentage Root mean square Difference (PRD), are utilized to validate the performance enhancements achieved by the proposed method. Results indicate that the method substantially mitigates both PLI and AWGN, yielding a cleaner ECG signal that is more amenable to subsequent medical analysis. Notably, for PLI at 50 Hz with an input SNR of 10 dB, the algorithm achieved an output SNR of 22.56 dB and a PRD of 7.46%. Similarly, under AWGN conditions with an equivalent input SNR, an output SNR of 18.31 dB and a PRD of 12.16% were realized. These outcomes signify a notable improvement over existing methodologies documented within the literature, affirming the proposed method's potential for advancing ECG signal processing in medical applications.
electrocardiogram (ECG), Wavelet Transform (WT), Genetic Algorithm (GA), Additive White Gaussian Noise (AWGN), Power Line Interference (PLI)
Electrocardiogram (ECG) signals illustrate the human heart's electrical activity during the depolarisation and repolarisation of myocytes over time [1]. This technique is non-invasive which enables the efficient display of relevant electrical data received by a collection of electrodes that are affixed to the exterior of the human body [2]. Accurate ECG signal analysis is paramount for healthcare practitioners in the diagnosis and management of cardiac disorders. While acquiring an ECG signal, different forms of noise with a broad spectrum are present, degrading its quality.
These noises contain Power Line Interference (PLI) (A narrow frequency range of 1 Hz) that is typically caused by the presence of alternating current (AC) electrical power lines, often operating at 50 or 60 Hz depending on the region, whereas White Gaussian Noise (AWGN), characterized by a normal distribution of amplitude values and equal power across all frequencies, can infiltrate ECG recordings through sources such as electronic noise, movement artefacts, and environmental factors. The presence of WGN may impede the accurate analysis of ECG signals. Baseline Wander (BW) in ECG signals, originating from factors like patient motion, respiration, electrode issues, introduces low-frequency noise (0.15-0.3 Hz) that disrupts ECG signal interpretation by causing slow, rhythmic baseline fluctuations and obscuring vital waveform features, hindering accurate diagnosis of cardiac conditions. Muscular Movement Artifacts (EMG) in ECG signals, originating from skeletal muscle contractions near electrodes due to factors like shivering or electrode movement, introduce high-frequency noise that appears as rapid spikes, hindering accurate interpretation and potentially causing misdiagnosis in cardiac analysis [3].
The prevalence of these aberrations has a substantial impact on diagnostic information present within an ECG signal, thereby making diagnosis exceedingly difficult. These artefacts must be removed for a precise diagnosis. In the study [4], a FIR digital filter with a reduced number of inputs is used to eliminate PLI with a high frequency. The authors [5] executed an IIR notch filter with transient reduction with the intention of canceling PLI. The adaptive notch filter is more effective at lowering residual signal entropy [6] and more computationally efficient when compared to non-adaptive notch filters for removing 60 Hz noise in the study [7]. Using the Empirical Wavelet Transform (EWT), the researchers [8] developed an empirical wavelet filter bank, whereas in the study [9], a technique called Eigen Value Decomposition (EVD) was implemented by decomposing a Hankel matrix. In the study [10], an approach using the Fourier Decomposition Method (FDM) was introduced, which utilise a discrete Fourier Transform for denoising ECG signals. A denoising method that involved an adaptive Kalman filter bank that consists of two filters specifically designed for reducing noise in high-frequency and low-frequency components was proposed in the study [11]. In the studies [12, 13], a method based on the Variational Mode Decomposition (VMD) technique was employed for the purposes of analysis, whereas in the study [14], a method based on Principal Component Analysis (PCA) was used to enhance the efficacy of noise reduction. Empirical Mode Decomposition (EMD) has been applied to remove different types of artefacts present in ECG signals [15-17].
Several effective denoising techniques based on wavelets have been suggested owing to the non-stationary nature of ECG signals. In the study [18], a modula-maxima technique based on DWT was employed, whereas in the study [19], the coefficients of the decomposed signal were processed using a technique based on thresholds. Methods [20, 21] based on the dual-tree and dual-tree complex Wavelet Transforms were employed. In the study [22], the Stationary Wavelet Transform (SWT) method was used [23], a Wavelet Lifting Scheme-based DWT method was investigated. Several ECG noise elimination approaches, including filtering and adaptive thresholding, have been proposed in the literature. Recent wavelets transform (WT) applications for denoising of biomedical signals, such as ECG and EEG [24, 25], have been effective.
In a number of engineering fields, the Genetic Algorithm (GA) has been successfully applied to various problems of optimisation and produced excellent results. However, the objective of this paper is to utilise the GA to iteratively explore the search space of the Wavelet Transform (WT), aiming to identify the most suitable decomposition level and threshold value by means of a sequence of consecutive iterations to effectively remove noise from the ECG signal. This paper's primary goal is to improve the accuracy of cardiac signal analysis for further classification in healthcare applications. The results achieved by employing our approach to the MIT-BIH database using the Signal-to-Noise Ratio (SNR) and the Percentage Root mean square Difference (PRD) metrics proved very effective in suppressing noise, as they outperformed other state-of-the-art methods. The paper's remaining sections are organised as follows: Section 2 provides a theoretical overview of our proposed approach, which combines the GA and the WT. In Section 3, we outline the proposed technique (GA-DWT) that effectively removes noise. This method introduces a novel approach to determining the optimal level of decomposition (L) and the value of the threshold (ϭ) using the Daubechies-13 DWT as the mother wavelet. Results and discussion are shown in Section 4. Section 5 provides the conclusion and future perspectives.
This section discusses the theoretical foundation of our proposed ECG signal noise reduction technique, utilising WT and GA.
2.1 Predominant noises in ECG
The noises and disturbances reside within the spectral range of interest and manifest themselves predominately as morphological characteristics similar to the ECG's inherent characteristics or disease-specific characteristics. Below is a concise description of the predominant ECG noises.
PLI introduces synchronised noise components, often originating from external sources such as electrical devices, potentially causing misinterpretation or misdiagnosis. In contrast, AWGN, a random noise following a Gaussian distribution, obscures finer ECG signal details. Baseline Wander, typically occurring between 0.15 Hz and 0.3 Hz, leads to rhythmic baseline oscillations, hindering the accurate diagnosis of cardiac conditions by obscuring critical waveform components. Muscular Movement Artifacts, characterised by high-frequency noise (typically 25-50 Hz and above), manifest as rapid spikes and interference, complicating the interpretation of underlying cardiac electrical activity.
2.1.1 Power-line interference
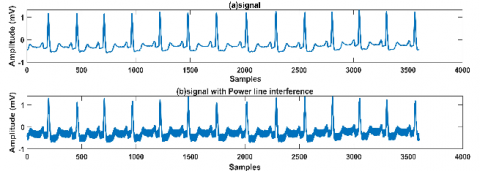
During ECG signal acquisition, inductive and capacitive couplings of 50/60 Hz power lines cause PLI disturbances as seen in Figure 1 (where the record number 100 was polluted with noise at an input SNR of 10 dB) [26]. It has a narrowband bandwidth of 1 Hz and an amplitude of up to 50% of full-scale deflection (FSD). The morphology of the signals is distorted when the PLI and ECG are combined. This results in P-wave distortions, which can contribute to an incorrect diagnosis of atrial arrhythmias such as atrial enlargement and fibrillation [27].
Figure 1. (a) the original signal, (b) signal polluted with PLI
2.1.2 Channel noise
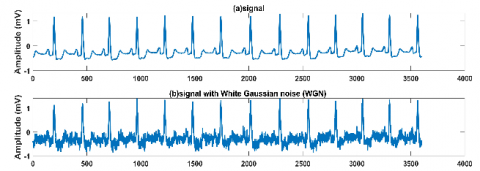
Figure 2. (a) the original signal, (b) the signal with AWGN
When ECG signals are transmitted over a channel with weak channel conditions, such as AWGN, channel noise is induced as seen in Figure 2 (where the record number 100 was polluted with noise at an SNR input of 10 dB).
2.2 Database
The MIT-BIH databases were one of the earliest publicly available test materials utilised to evaluate arrhythmia detection. Since 1980, more than 500 institutions around the world have used it for research on heart dynamics [28, 29]. The BIH Arrhythmia Laboratory collected 48 half-hour samples from 47 participants' 24-hour ECG recordings with two channels. The recordings were digitized at a rate of about 360 samples per second, according to channel, with a precision of 11 bits and a dynamic range of 10 mV. More than two cardiologists annotated the records individually, and conflicts were settled to generate machine-readable reference annotations for every pulse (approximately 110,000 annotations in total). ECG signals can be obtained from the MIT-BIH database of arrhythmia and analysed.
2.3 Discrete Wavelet Transform (DWT)
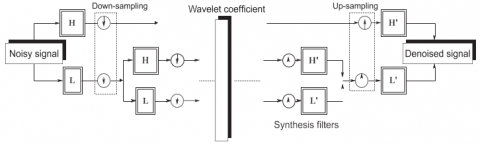
By means of a sequence of high-frequency filters (H) and low-frequency filters (L), the DWT decomposes a signal into coefficients with varying frequency levels. Analysing the high-frequency and low-frequency components enables the elimination of the presumed noise-causing small detail coefficients. Mathematically, the Wavelet Transform is determined with Eq. (1):
$W_x(a, b)=\frac{1}{\sqrt{a}} \sum_{n=0}^{N-1} s(n)_N \psi^*\left(\frac{n-b}{a}\right)$ (1)
where, the DWT yields a large number of wavelet coefficients $W_x(a, b)$, $a$ represents the scale (dilation) parameter $a=2^j$ and $j=0,1,2,3 \ldots, \log _2($ length $(s(n))$ represents parameter for translation $b=k 2^j$, $S(n)$ represents the signal with noise and $\psi$ represents the mother wavelet. In DWT techniques, the high-pass and low-pass filter outputs are downsampled by a factor of 2 to compute the approximation coefficients $A(K)$ and detail coefficients $D(K)$. These DWT coefficients play a crucial role in reconstructing the signal using a basis function $\psi$ and a discrete scale function $\Phi(n)$ through Eqs. (2-4).
$y(n)=\frac{1}{\sqrt{a}} \sum_k \mathrm{A}(j, k) \Phi_{j, k}+\sum_{j=0}^m \sum_k \mathrm{D}_j(k) \psi_{j, k}(n)$ (2)
$\mathrm{D}_j(k)=\frac{1}{\sqrt{a}}\left(\sum_n s(n) \psi_{j, k}(n)\right), k=0,1,2, \ldots, 2^{j-1}$ (3)
$\mathrm{A}_j(k)=\frac{1}{\sqrt{a}}\left(\sum_n s(n) \Phi_{j, k}(n)\right)$ (4)
$j=0,1,2,3 \ldots, \log _2\left(\right.$ length $(s(n)) k=0,1,2, \ldots, 2^{(j-1)}$, $n$ represents the signal's duration. Following an analysis of the processes, the adjusted signals have been sampled and filtered with synthesis filters, which are comprised of H′ and L′. The sum of H′ as well as L′ outputs are equivalent to the initial signal. Figure 3 depicts the DWT decomposition and reconstruction procedure.
2.4 Generator of additive noise
ECG signals are frequently contaminated by numerous types of noise, which degrade signal quality and interpretation. In such circumstances, the DWT is among those demonstrating extremely high levels of success. However, a noise signal typically manifests as a coefficient with a high frequency.
Figure 3. Decomposition and reconstruction of signals using the Wavelet Transform
A noisy signal can be characterised by a substantial quantity of detail coefficients exhibiting low magnitudes on both the negative and positive ends. In this regard, our goal will also be to eliminate noise while preserving the signal's characteristics. Using Eq. (5), the clean ECG signal is corrupted with PLI and with AWGN using Eq. (6).
$N(t)=A * \sin (2 * \pi * f * t)$ (5)
$N(t)=x(t)+\sigma$ (6)
2.5 Genetic Algorithm (GA)
The problem of global optimisation was addressed using the Genetic Algorithm (GA) technique, which incorporates natural selection and genetics. Beginning with a random sample of prospective solutions, their performance is evaluated using a fitness function [30]. During the evaluation phase, this function examines the performance of the GA in a specific environment and evaluates the quality of each solution. The purpose of denoising is to effectively eliminate disturbance and restore the original ECG signal. Maximizing the signal-to-noise ratio (SNR) between the original ECG signal and the denoised ECG signal is a typical optimization objective in ECG noise suppression. The SNR is therefore selected as the fitness function. Consider an original signal $x(n)$ with N samples and a reconstructed approximation of this signal denoted $\hat{x}(n)$ to compute the SNR.
$\mathrm{SNR}=10 \log _{10} \frac{\sum_{\mathrm{n}=1}^{\mathrm{N}}[\mathrm{x}(\mathrm{n})]^2}{\left.\sum_{\mathrm{n}=1}^{\mathrm{N}}[\mathrm{x}(\mathrm{n})-\hat{\mathrm{x}}(\mathrm{n}))\right]^2}$ (7)
We selected SNR as the fitness function for our GA to enhance the optimisation process. SNR quantitatively assesses ECG signal quality relative to noise, offering a clear metric for signal quality evaluation. By maximising SNR, the GA aims to find an optimal parameter and filter combination to reduce noise from Baseline Wander, Muscular Movement Artefacts, PLI, and AWGN, aligning with our goal of enhancing the accuracy and reliability of ECG signal interpretation for precise cardiac condition diagnoses. This approach focuses on maximising signal quality while minimising noise effects, including PLI and AWGN, to improve the utility of ECG data in clinical applications.
GAs develops global optimised parameters for the network using three fundamental operators: (1) the selection operation, (2) the crossover operation, and (3) the mutation. The population of potential solutions is used in GA. Based on the principles of natural selection and survival of the fittest, the optimal solution is determined by the Genetic Algorithm through the repeated execution of computations on the operators, namely selection, crossover, mutation, and the population size, the possibility for crossover, and the possibility of mutation are all control variables for the GA. Chromosomes represented alternate solutions, or a fix for the problem that produces positive results in accordance with the fitness function, are generated successively by GA. The fundamentals of conventional GAs are covered in detail. The phases of the executed Genetic Algorithm will be described in the following manner [31, 32]:
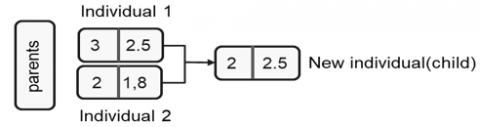
New populations are generated through three distinct procedures. A selected pair of beginning individuals using the roulette wheel to commence. Second, by applying crossover operations on them (Figure 4), in the third phase, mutation processes are applied to the newly created individual by multiplying each of the coefficients by a random number between [0.8 and 1.2].
Figure 4. Operation crossover
where, the population size of the GA is 50, the maximal number of iterations is set to 100. The mutation rate is established at 0.02, and the crossover rate is determined to be 1.
|
Algorithm 1 Genetic Algorithm Code |
|
1: Xchrom← Generate_Initital_Population 2: Evaluate (Xchrom) 3: while (Stopping criterion is not met) do 4: Xchrom’← Selection (Xchrom) 5: Xchrom’’← Crossover (Xchrom’) 6: Xchrom’’’← Mutation (Xchrom’’) 7: Evaluate (Xchrom’’’) 8: Xchrom← Replacement (Xchrom’’’ $U$ Xchrom) 9: end while |
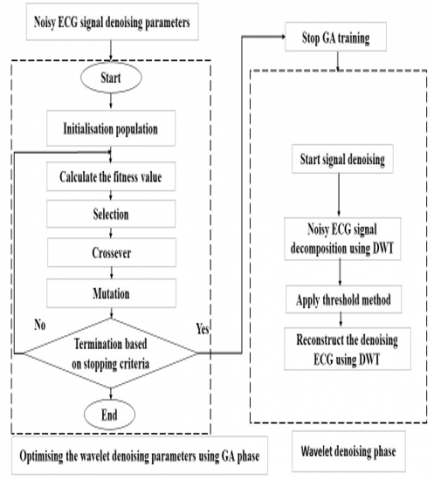
Considering that noise has contaminated the ECG signal. Using the GA technique, the most appropriate WT denoising settings to eliminate noise through ECG signals were determined. Figure 5 depicts the proposed GA-WT noise reduction technique. The developed GA-WT method for noise suppression can be described as follows:
|
Algorithm 2 Tuning WT Parameters Using GA Algorithms to obtain ECG Signal Noise-reduction |
|
1: Initialise the noisy ECG signals (nECG) and estimate the SNR for the ECG signal input. 2: Initialise GA operators, initialise solution(s) Xi (i = 1, 2) Xi (L, ϭ) represents the initial solution (where L and ϭ are the level of decomposition and threshold value, respectively). 3: X’opt = GA (X, Xi), X’opt (Lopt, ϭopt) 4: ECG Denoised = DWT (X’opt, nECG) 5: ECG Out Signals = Evaluation (ECG Denoised, SNRout, PRD) |
Figure 5. The proposed method
3.1 Noise removal using wavelet denoising
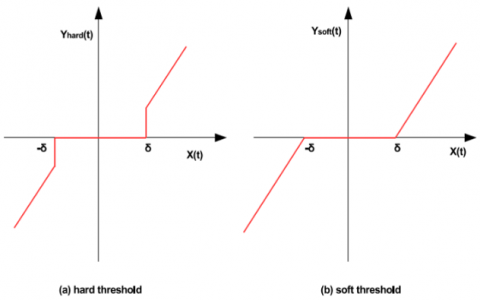
There are two varieties of thresholding functions that can be used to eliminate noise in the wavelet domain: hard thresholding and soft thresholding as seen in Figure 6. In the process of hard thresholding, any detail coefficients (CD) with absolute values below the specified threshold are set to zero, while the remaining coefficients remain unchanged (as described by Donoho and Johnstone [33]). In contrast, soft thresholding resembles hard thresholding but decreases the magnitude of wavelet coefficients that exceed the threshold. While soft thresholding demands additional computational resources, it provides improved denoising capabilities [34, 35].
Figure 6. Hard and soft thresholding methods
$\operatorname{Hard} \operatorname{thr}\left(x_{h t}\right)= \begin{cases}\mathrm{CD}_j, & \left|\mathrm{CD}_j\right| \geq \beta_j \\ 0, & \left|\mathrm{CD}_j\right|<\beta_j\end{cases}$ (8)
$\beta_j$: The value of the threshold
Soft thr $\left(x_{s t}\right) = \begin{cases}\operatorname{sign}\left(\mathrm{CD}_{\mathrm{j}}\right)\left(\mathrm{CD}_{\mathrm{i}}-\left|\beta_{\mathrm{j}}\right|\right), & \left|\mathrm{CD}_{\mathrm{j}}\right| \geq \beta_{\mathrm{j}} \\ 0, & \left|\mathrm{CD}_{\mathrm{i}}\right|<\beta_{\mathrm{j}}\end{cases}$ (9)
The selection of the value of the threshold is an important matter that requires careful consideration. The threshold may be executed on a global or local scale. With regards to global thresholding, all detail coefficients are assigned a singular value. In the local case, various threshold values are selected at every wavelet level. This research bases the threshold of noise on universal threshold (β) that Donoho and Johnstone [36] proposed. The Eq. (12) expresses this.
$\beta_j=\sigma_j^{\text {Noise}^{\circ} } \sqrt{2 \log \left(N_j\right)}$ (10)
where, $N_j$ denotes the signal length at the scale j and $\sigma_j^{\text {Noise }^{\circ}}$ denotes the variance of the noise, which can be calculated using the Eq. (10).
$\sigma_j^{\text {Noise }}=\frac{\operatorname{median}\left(\left|\mathrm{CD}_{\mathrm{j}}\right|\right)}{0.6745}$ (11)
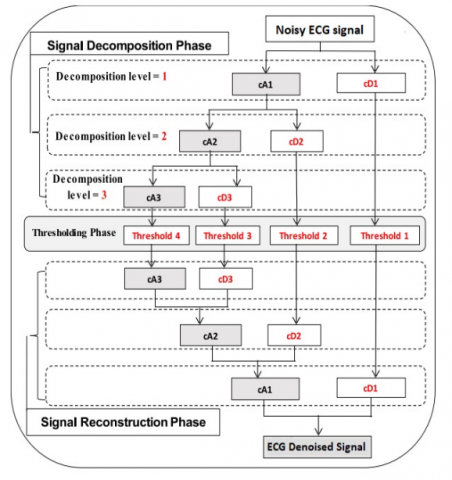
Selecting an appropriate wavelet mother function, in addition, is a critical step in demonstrating the benefits of DWT in denoising. At the moment, no generic approach suited for ECG data has been proposed to select the mother wavelet based on wavelet features, and the researchers have not yet been adequately described. The mother wavelet function selection rules apply in numerous fields. Our research, on the other hand, outlines three basic steps: Choosing the mother wavelet, which is tuned experimentally, as well as the optimal level and threshold value, which are obtained using the Genetic Algorithm and can be used to denoise the ECG signal to obtain a perfect reconstruction and avoid distortion, some wavelet types, such as the Symlet and Daubechies wavelets, have been proposed to reduce noise in ECG signals [37, 38]. We used the Daubechies wavelet family (dB-13) [39]. In summary, Figure 7 depicts the wavelet denoising principle, which is based on three fundamental steps: (1) decomposition, (2) threshold detail transactions, and (3) reconstruction. The noisy signal is divided into multiple levels of approximation and detail coefficients in the first stage.
Denoising processes a large number of detail coefficients for low-frequency noises; furthermore, besides the approximation coefficients, which possess the potentiality to contain low-frequency noises, there exist various other factors that must be taken into consideration, thereby constraining the noise threshold. In the event of low SNR, however, experimentally weak signals are frequently difficult to examine. As a result, decisions must be made on the best wavelet method, mother wavelet, and decomposition level number (L), which was considered between 1 and 10. The threshold function will comprise the next phase; the crucial aspect of threshold applications is establishing the value of the threshold. It should be noted that it ultimately includes a trade-off between retaining some noise in the data and deleting some signal detail. Finally, the reconstructed denoised signal is generated without loss of information using the final level and the threshold detail coefficients from all levels.
Figure 7. ECG denoising process [29]
In the initial step, both the value of the threshold and the level of decomposition (2.55 and 3), respectively, are considered. For optimising these two values, the quest for the appropriate solution commences within the space of the search. Using the proposed approach, the two appropriate parameters (X'opt) are determined. Using the GA, the pre-selected DWT is used for filtering the signal and producing a maximum SNR and minimum PRD using the following formulas:
$\mathrm{SNR}_{\text {input }}=10 \log _{10} \frac{\sum_{\mathrm{n}=1}^{\mathrm{N}}[\mathrm{x}(\mathrm{n})]^2}{\left.\sum_{\mathrm{n}=1}^{\mathrm{N}}[\mathrm{x}(\mathrm{n})- \tilde{\mathrm{x}}(\mathrm{n}))\right]^2}$ (12)
$\mathrm{SNR}_{\text {output }}=10 \log _{10} \frac{\sum_{\mathrm{n}=1}^{\mathrm{N}}[\mathrm{x}(\mathrm{n})]^2}{\left.\sum_{\mathrm{n}=1}^{\mathrm{N}}[\mathrm{x}(\mathrm{n})-\hat{\mathrm{x}}(\mathrm{n}))\right]^2}$ (13)
$\mathrm{SNR}_{\text {imp }}=\mathrm{SNR}_{\text {output }}-\mathrm{SNR}_{\text {input }}$ (14)
$\mathrm{PRD}=100 * \sqrt{\frac{\left.\sum_{\mathrm{n}=1}^{\mathrm{N}}[\mathrm{x}(\mathrm{n})-\hat{\mathrm{x}}(\mathrm{n}))\right]^2}{\sum_{\mathrm{n}=1}^{\mathrm{N}}[\mathrm{x}(\mathrm{n})]^2}}$ (15)
where, $x(n)$ represents the original ECG signal, $\tilde{x}(n)$ denotes the noisy ECG signal, $\hat{x}(n)$ represents the denoised ECG signals are produced by adjusting the wavelet settings with the GA, with $N$ being the number of points in the data set (record).
The objective evaluation is shown in Table 1 of our proposed method using SNR as well as PRD metrics. The table compares our approach, which incorporates a GA-enhanced DWT, with an ECG denoising technique using the basic DWT across different input SNR levels.
Table 1. The performance of the basic and optimised DWT in terms of SNRout and PRD
|
SNRinput (dB) |
L -Dwt |
L-Opt |
Ϭ -Dwt |
Ϭ -Opt |
SNRout-Dwt |
SNRout-Opt |
PRD-Dwt (%) |
PRD-Opt (%) |
|
10 |
3 |
3 |
2.55 |
0.19 |
20.94 |
21.04 |
9 |
8.9 |
|
15 |
3 |
0.08 |
20.98 |
22.32 |
8.96 |
7.67 |
||
|
20 |
2 |
0.04 |
20.99 |
25.99 |
8.95 |
5.01 |
||
|
25 |
2 |
0.02 |
21 |
29.33 |
8.94 |
3.41 |
The 'dB13' mother wavelet function is employed in both methods. The first column of Table 1 displays the input SNR values, representing the level of noise introduced to the clean ECG signal. In each table, the columns denoted as the second and third columns indicate the initial and optimised the WT's values decomposition level parameter, respectively. The fourth and fifth columns show the basic and optimised threshold values of the WT parameter. The remaining columns in each table exhibit the SNR and PRD outputs for both the basic and enhanced GA-DWT methods.
The results clearly indicate that our proposed GA-WT enhancement surpasses basic DWT, as evidenced by higher SNR outputs and lower PRD ratios. Additionally, the table demonstrates that the output SNR and PRD ratios for the basic DWT remain relatively consistent regardless of the input SNR value. However, for the enhanced DWT, as the input SNR increases, the output SNR also increases while the PRD decreases. According to Table 1, which utilises the "dB13" wavelet function, the output SNR value for the basic DWT ranges between 20.94 and 21 when the input SNR varied between 10 and 25 dB. Consequently, the SNR output remains consistently low, irrespective of the input SNR. Conversely, our optimised DWT method exhibits an increasing output SNR as the input SNR. For example, a 25 dB input SNR results an output SNR of 29.33 dB. Therefore, our proposed method generates a higher SNR output compared with the basic DWT, especially for the noisier ECG signals. The best input SNR value of 25 dB corresponds to a clearer ECG signal. In conclusion, the superiority of our proposed enhanced DWT method using GA over the basic WT for noise reduction from ECG signals is evident through the higher SNR output achieved.
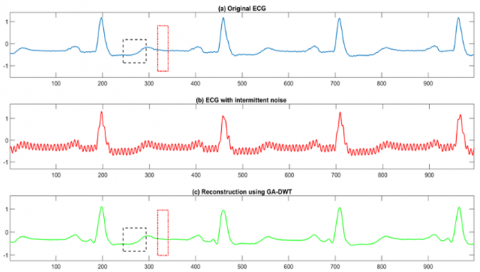
Figure 8 illustrates the results of an initial subjective evaluation conducted at f = 50 Hz. It depicts the clean Figure (8-a) represents the original ECG signal, while Figure (8-b) illustrates the ECG signal with added noise. Figure (8-c) displays the denoised ECG signal. Which were generated using the suggested method. This figure plainly demonstrates that the original ECG signal and the denoised ECG signal are extremely similar. The similarity observed between the two signals demonstrates the efficacy of the proposed technique for ECG noise removal, which involves optimising DWT with GA.
Figure 8. (a) clean, (b) noisy and (c) denoised ECG signal using GA-WT at SNRinput=10dB
Table 2. SNR improvements and PRD with various inputs SNR values for each ECG record with 50 Hz PLI
|
ECG Record |
SNRimp |
PRD |
||||||||
|
-10 |
-5 |
0 |
5 |
10 |
-10 |
-5 |
0 |
5 |
10 |
|
|
100 |
23.76 |
19.05 |
14.22 |
10.37 |
7.90 |
20.99 |
20.30 |
19.89 |
17.34 |
12.87 |
|
103 |
22.31 |
17.54 |
12.89 |
9.39 |
6.96 |
24.91 |
24.25 |
23.25 |
19.41 |
14.18 |
|
105 |
27.95 |
24.77 |
20.55 |
15.84 |
11.00 |
12.70 |
10.30 |
09.41 |
09.10 |
08.94 |
|
109 |
31.76 |
29.01 |
25.05 |
20.44 |
15.68 |
8.17 |
6.30 |
5.59 |
5.34 |
5.20 |
|
116 |
26.86 |
22.46 |
17.66 |
12.89 |
9.29 |
14.45 |
13.49 |
13.18 |
12.85 |
10.90 |
|
123 |
28.04 |
23.85 |
19.14 |
14.34 |
10.68 |
12.61 |
11.47 |
11.09 |
10.84 |
9.29 |
|
201 |
27.20 |
22.85 |
18.08 |
13.23 |
8.93 |
13.90 |
12.89 |
12.55 |
12.34 |
11.34 |
|
221 |
22.59 |
21.05 |
16.19 |
11.64 |
6.87 |
16.79 |
15.94 |
15.68 |
14.86 |
14.01 |
|
231 |
20.22 |
15.36 |
11.14 |
7.70 |
6.90 |
32.32 |
31.82 |
28.81 |
23.88 |
14.30 |
Table 3. SNR improvements and PRD with various inputs SNR values for each ECG record with AWGN
|
ECG Record |
SNRimp |
PRD |
||||||||
|
-10 |
-5 |
0 |
5 |
10 |
-10 |
-5 |
0 |
5 |
10 |
|
|
100 |
16.22 |
11.59 |
7.78 |
6.58 |
5.58 |
52.57 |
54.47 |
42.08 |
26.62 |
16.73 |
|
103 |
12.28 |
8.53 |
7.48 |
5.83 |
5.86 |
115.41 |
78.02 |
44.10 |
28.61 |
16.31 |
|
105 |
12.12 |
10.35 |
9.19 |
7.96 |
6.99 |
95.64 |
55.22 |
34.88 |
22.69 |
14.40 |
|
109 |
14.52 |
12.22 |
10.94 |
9.06 |
8.31 |
71.15 |
43.16 |
28.66 |
19.93 |
12.16 |
|
116 |
15.29 |
10.41 |
8.52 |
7.49 |
6.07 |
64.24 |
63.19 |
37.37 |
23.88 |
15.79 |
|
123 |
18.96 |
14.44 |
9.63 |
7.80 |
6.73 |
36.37 |
35.85 |
34.13 |
22.96 |
14.65 |
|
201 |
12.92 |
9.98 |
8.42 |
7.61 |
5.95 |
103.78 |
60.10 |
38.35 |
23.68 |
15.80 |
|
221 |
12.23 |
10.01 |
8.13 |
7.12 |
5.69 |
92.70 |
60.13 |
39.75 |
25.05 |
16.56 |
|
231 |
11.38 |
8.13 |
6.73 |
5.98 |
5.67 |
133.63 |
83.02 |
48.76 |
28.46 |
16.74 |
Table 2 shows the denoised PLI signal's improved SNR and values for several ECG recordings at different input SNR levels. When the input SNR is low, the SNRimp values remain around 25 dB and decrease with increasing SNR.
Estimated PRD values for record 105 are 12.70, 10.30, 9.41, 9.10, and 8.94 at the specified degrees of noise. When the proposed method is used to eliminate AWGN noise, the relevant improvement values are recorded in Table 3. The output signal and results are extremely good, regardless of the quantity of input noise.
In this section, we will show the results that have been obtained by applying our proposed approach for noise removal from ECG signals. This technique is based on optimising the two primary parameters of the DWT, which are the level of decomposition L and the threshold value ϭ, respectively, and it was implemented with the use of GA. It should be noted that this work was done using the code of the Matlab 2018-B edition using Wavelet Toolbox in this software program. In addition, we compared the filtering of two distinct kinds of noise, namely Power Line Interference and additive Gaussian noise. Several records from the MIT-BIH database were used for the experiments described in this paper.
4.1 AWGN noise removal
The efficiency of the suggested approach to remove noise from ECG signals that are contaminated with AWGN noise is illustrated in Table 4. Using record numbers 100, 101, 102, and 103 obtained from the MIT-BIH database. The values of SNRout and PRD at 5 dB and 10 dB of input noise are displayed. These values were contrasted with the results of the methods: EMD-ASMF [40], GAMNVE [41], PLI-SWT [42], and 1DTV [43].
The values highlighted in bold in the table are the highest values for each SNR record and the corresponding PRD for each ECG record. These results show the efficacy of our suggested technique for eliminating this type of noise.
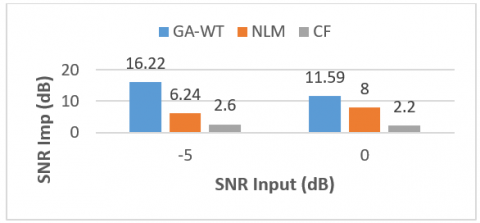
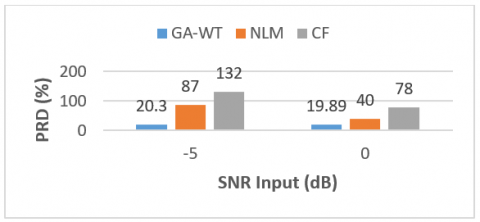
Another comparison was made when introducing high-noise SNR at values -5 and 0 using records number 100, as seen in Figure 9, and Figure 10 which shows the superiority of our proposed method over both NLM and CF methods, as we obtained the highest SNR improvement and lowest PRD. This result demonstrates the efficiency of the proposed method.
Table 4. Values of performance parameters for arrhythmia ECG records contaminated by AWGN.
|
Signal SNR |
Input SNR Output |
|
|
|
|
|
PRD |
|
|
|
|
||
|
|
GA-WT |
EMD- ASMF |
GAMNVE |
NIWT |
PLI- SWT |
1DTVD |
GA-WT |
EMD-ASMF |
GAMNVE |
NIWT |
PLI- SWT |
1DTVD |
|
|
100 5 |
11.58 |
8.87 |
10.88 |
5.11 |
4.99 |
13.34 |
26.62 |
36.05 28.65 |
55.54 |
56.30 |
21.59 |
||
|
10 |
15.58 |
12.78 |
15.09 |
10.13 |
9.99 |
13.93 |
16.73 |
22.98 17.65 |
31.18 |
31.67 |
20.11 |
||
|
101 5 |
14.14 |
9.66 |
10.94 |
5.15 |
4.99 |
13.25 |
19.91 |
32.92 28.47 |
55.32 |
56.31 |
21.78 |
||
|
10 |
16.48 |
13.52 |
15.31 |
10.15 |
9.99 |
13.62 |
15.00 |
21.09 17.22 |
31.09 |
31.67 |
20.86 |
||
|
102 5 |
11.38 |
8.70 |
10.16 |
5.13 |
4.99 |
10.97 |
27.00 |
36.77 31.10 |
55.44 |
56.32 |
28.29 |
||
|
10 |
14.69 |
12.50 |
14.40 |
10.14 |
9.99 |
11.15 |
18.00 |
23.72 19.08 |
31.14 |
31.68 |
27.71 |
||
|
103 5 |
10.83 |
9.24 |
10.71 |
5.10 |
4.99 |
13.48 |
28.61 |
34.55 29.24 |
55.59 |
56.30 |
21.21 |
||
|
10 |
15.86 |
13.32 |
15.47 |
10.11 |
9.99 |
14.41 |
16.31 |
21.59 16.94 |
31.24 |
31.66 |
19.05 |
||
Figure 9. The improvement in SNR for various denoising methods
Figure 10. The improvement in PRD for various denoising methods
4.2 PLI noise removal
The Tables 5 and 6 show the values obtained by applying our method to different records of the ECG signal from the earlier mentioned database, where the first column shows the number of records (100,103,105,109,116,123,201,221,231), and in the remaining columns we find the various methods used in previous studies to compare them with our proposed method at various SNR Input values. The resulting SNR output of the denoising method (GA-WT) is compared with to other state-of-the-art denoising methods in these two tables, namely: the EVD-based technique [9], the MRLS-based technique [44], and the EMD-WT technique [45], which are used to reduce PLI noise. Table 5 demonstrates the superior performance of our proposed methodology when subjected to increased noise levels, specifically by introducing an SNR input of -10 dB at a frequency of 50 Hz. In this context, we observed a substantial improvement in the average SNR compared to the other techniques under consideration. It is worth highlighting that the advantages of our proposed approach extend beyond these elevated noise levels, as it also exhibits superior performance in certain recordings when the noise levels are comparatively lower. Another important point is that the suggested method outperformed other earlier techniques when employed to reduce noise at a frequency of 60 Hz at inputs 0 and 5 of SNR, as demonstrated in Table 6 Overall, the results show the effectiveness of our noise reduction technique.
Based on the thorough analysis in Tables 5 and 6, it is clear that our approach presents a highly effective noise reduction solution in this context. These results underscore its superiority over existing methods in some records and its practical potential in real-world scenarios where noise reduction is crucial.
The consistent performance across diverse noise levels and frequencies affirms the reliability and credibility of our technique, positioning it as a promising avenue for further research and practical use in relevant fields.
This paper presents an innovative approach that integrates Wavelet Transform with Genetic Algorithm to effectively reduce both PLI and AWGN noises from ECG signals. The primary goal of this methodology is to function as a pre-processing technique for ECG data analysis and classification.
The study emphasizes the efficacy of the GA in optimising noise reduction parameters based on WT for filtering ECG signals.
Through extensive experimentation using the wavelet family (dB13), We employed GA to pinpoint optimal values for both the threshold value (Thr_opt) and decomposition levels (L_opt), leading to a significant enhancement in noise reduction for noisy ECG signals. The proposed method exhibits outstanding performance in signal noise reduction, as evidenced by the obtained SNR and PRD metrics values compared to state-of-the-art methods. In our forthcoming studies, we aspire to broaden the applicability of this method to biomedical signals such as Electroencephalogram (EEG) and Phonocardiogram (PCG). Additionally, we plan to use modern optimisation algorithms to fine-tune all WT parameters and implement this method on an FPGA board to facilitate its integration into future medical applications.
Table 5. The performance of PLI (at f = 50Hz) removal from diverse ECG signals with varying input SNR levels was evaluated using averaged values over 20 segments
|
ECG Record |
SNRinp = -10 dB |
SNRinp = -5 dB |
SNRinp = 0 dB |
SNRinp = 5 dB |
||||||||||||
|
SNRout(dB) |
||||||||||||||||
|
GA-WT |
EVD [9] |
MRLS [44] |
EMD-WT [45] |
GA-WT |
EVD [9] |
MRLS [44] |
EMD-WT [45] |
GA-WT |
EVD [9] |
MRLS [44] |
EMD-WT [45] |
GA-WT |
EVD [9] |
MRLS [44] |
EMD-WT [45] |
|
|
100 m |
13,762 |
3,758 |
13,666 |
11,366 |
14,051 |
7,284 |
17,899 |
11,869 |
14,227 |
11,683 |
21,583 |
11,547 |
15,371 |
16,045 |
23,931 |
11,458 |
|
103 m |
12,312 |
3,770 |
13,984 |
13,804 |
12,542 |
7,300 |
18,472 |
15,313 |
12,892 |
11,707 |
22,815 |
16,294 |
14,392 |
15,314 |
26,680 |
14,873 |
|
105 m |
17,954 |
3,772 |
14,054 |
19,238 |
19,777 |
7,302 |
18,625 |
21,846 |
20,558 |
11,711 |
23,116 |
24,422 |
20,848 |
13,795 |
27,219 |
24,887 |
|
109 m |
21,767 |
3,773 |
14,095 |
20,012 |
24,012 |
7,305 |
18,590 |
23,420 |
25,059 |
7,420 |
23,023 |
25,503 |
25,447 |
5,251 |
27,205 |
26,972 |
|
116 m |
16,868 |
3,775 |
14,122 |
15,267 |
17,468 |
7,307 |
18,547 |
17,759 |
17,669 |
11,718 |
22,719 |
18,515 |
17,893 |
11,099 |
26,458 |
19,558 |
|
123 m |
18,042 |
3,769 |
14,056 |
13,270 |
18,859 |
7,114 |
18,635 |
15,344 |
19,147 |
10,867 |
23,092 |
16,156 |
19,349 |
15,131 |
27,054 |
13,747 |
|
201 m |
17,201 |
3,770 |
13,789 |
16,956 |
17,856 |
7,299 |
18,268 |
19,434 |
18,086 |
11,706 |
22,497 |
20,428 |
18,238 |
16,200 |
26,299 |
21,258 |
|
221 m |
12,597 |
3,770 |
13,971 |
16,442 |
16,052 |
7,301 |
18,463 |
18,355 |
16,193 |
11,711 |
22,798 |
19,619 |
16,647 |
15,311 |
26,670 |
20,072 |
|
231 m |
10,221 |
3,767 |
13,946 |
11,604 |
10,364 |
7,295 |
18,409 |
13,221 |
11,142 |
11,405 |
22,619 |
13,154 |
12,705 |
11,336 |
26,044 |
12,883 |
|
AVG |
15,636 |
3,769 |
13,965 |
15,329 |
16,776 |
7,279 |
18,434 |
17,396 |
17,219 |
11,103 |
22,696 |
18,404 |
17,877 |
13,276 |
26,396 |
18,412 |
Table 6. The performance of PLI (at f = 60 Hz) removal from diverse ECG signals with varying input SNR levels was evaluated using averaged values over 20 segments
|
ECG Record |
SNRinp = -10 dB |
SNRinp = -5 dB |
SNRinp = 0 dB |
SNRinp = 5 dB |
|
|||||||||||
|
SNRout(dB) |
||||||||||||||||
|
GA-WT |
EVD [9] |
MRLS [44] |
EMD-WT [45] |
GA-WT |
EVD [9] |
MRLS [44] |
EMD-WT [45] |
GA-WT |
EVD [9] |
MRLS [44] |
EMD-WT [45] |
GA-WT |
EVD [9] |
MRLS [44] |
EMD-WT [45] |
|
|
100 m |
14,714 |
3,754 |
11,310 |
13,932 |
18,761 |
7,251 |
15,866 |
14,924 |
22,628 |
11,582 |
20,184 |
16,220 |
25,295 |
15,785 |
23,297 |
17,781 |
|
103 m |
14,215 |
3,761 |
11,321 |
16,383 |
19,359 |
7,304 |
15,992 |
19,819 |
22,987 |
11,727 |
20,633 |
20,540 |
26,657 |
14,968 |
24,965 |
22,316 |
|
105 m |
18,542 |
3,761 |
11,432 |
21,702 |
20,058 |
7,276 |
16,179 |
24,234 |
23,227 |
11,650 |
20,962 |
25,481 |
26,979 |
13,664 |
25,516 |
27,017 |
|
109 m |
22,413 |
3,766 |
11,429 |
22,358 |
24,337 |
7,292 |
16,209 |
25,485 |
25,183 |
8,450 |
21,043 |
27,256 |
27,462 |
5,243 |
25,719 |
29,033 |
|
116 m |
17,067 |
3,766 |
11,482 |
18,295 |
19,629 |
7,294 |
16,302 |
20,732 |
24,258 |
11,697 |
21,234 |
21,918 |
27,971 |
10,628 |
26,047 |
22,841 |
|
123 m |
18,308 |
3,771 |
11,372 |
16,818 |
19,54 |
7,117 |
16,110 |
18,570 |
24,629 |
10,870 |
20,961 |
20,582 |
28,647 |
15,137 |
25,793 |
23,208 |
|
201 m |
17,419 |
3,764 |
11,369 |
19,663 |
18,978 |
7,285 |
16,012 |
21,069 |
23,196 |
11,663 |
20,607 |
23,495 |
26,359 |
15,777 |
24,683 |
23,735 |
|
221 m |
15,751 |
3,765 |
11,347 |
19,177 |
18,837 |
7,280 |
15,991 |
20,644 |
22,827 |
11,644 |
20,518 |
22,693 |
25,643 |
11,733 |
25,77 |
21,382 |
|
231 m |
14,578 |
3,772 |
11,419 |
14,741 |
18,449 |
7,304 |
16,174 |
17,290 |
21,925 |
11,421 |
21,023 |
19,209 |
23,397 |
15,785 |
23,297 |
17,781 |
|
AVG |
17,001 |
3,764 |
11,387 |
18,119 |
19,772 |
7,267 |
16,093 |
20,307 |
23,429 |
11,189 |
20,796 |
21,933 |
26,490 |
13,191 |
25,010 |
22,788 |
The main part of this manuscript was completed by Azzouz and Alaoui. In MATLAB, they created software and an algorithm. Bengherbia and Souahlia developed a theoretical framework and mathematical model. The final manuscript was read and approved by all authors.
[1] Liu, Z., Chen, Y., Zhang, Y., Ran, S., Cheng, C., Yang, G. (2023). Diagnosis of arrhythmias with few abnormal ECG samples using metric-based meta learning. Computer Biology Medicine, 153: 106465. https://doi.org/10.1016/j.compbiomed.2022.106465
[2] Ribeiro, A. H., Pereira, A. C., Attux, R., et al. (2020). Automatic diagnosis of the 12-lead ECG using a deep neural network. Nature Communications, 11(1): 1760. https://doi.org/10.1038/s41467-020-15432-4
[3] Van Alste, J.A., Van Eck, W., Herrmann, O. E. (1986). ECG baseline wander reduction using linear phase filters. Computers and Biomedical Research, 19(5): 417-427. https://doi.org/10.1016/0010-4809(86)90037-6
[4] Chatterjee, S., Thakur, R.S., Yadav, R.N., Gupta, L., Raghuvanshi, D.K. (2020). Review of noise removal techniques in ECG signals. IET Signal Processing, 14(9): 569-590. https://doi.org/10.1049/iet-spr.2020.0104
[5] Pei, S.C., Tseng, C.C. (1995). Elimination of AC interference in electrocardiogram using IIR notch filter with transient suppression. IEEE transactions on biomedical engineering, 42(11): 1128-1132. https://doi.org/10.1109/10.469385
[6] Hamilton, P.S. (1996). A comparison of adaptive and nonadaptive filters for reduction of power line interference in the ECG. IEEE transactions on biomedical engineering, 43(1): 105-109. https://doi.org/10.1109/10.477707
[7] Razzaq, N., Sheikh, S.A.A., Salman, M., Zaidi, T. (2016). An intelligent adaptive filter for elimination of power line interference from high resolution electrocardiogram. IEEE Access, 4, 1676-1688. https://doi.org/10.1109/ACCESS.2016.2548362
[8] Singh, O., Sunkaria, R.K. (2017). ECG signal denoising via empirical wavelet transform. Australasian Physical & Engineering Sciences in Medicine, 40: 219-229. https://doi.org/10.1007/s13246-016-0510-6
[9] Sharma, R.R., Pachori, R.B. (2018). Baseline wander and power line interference removal from ECG signals using eigenvalue decomposition. Biomedical Signal Processing and Control, 45: 33-49. https://doi.org/10.1016/j.bspc.2018.05.002
[10] Singh, P., Srivastava, I., Singhal, A., Gupta, A. (2019). Baseline wander and power-line interference removal from ECG signals using Fourier decomposition method. In Machine Intelligence and Signal Analysis, 25-36. https://doi.org/10.1007/978-981-13-0923-6
[11] Hesar, H.D., Mohebbi, M. (2020). An adaptive Kalman filter bank for ECG denoising. IEEE Journal of Biomedical and Health Informatics, 25(1): 13-21. https://doi.org/10.1109/JBHI.2020.2982935
[12] Singh, P., Pradhan, G. (2018). Variational mode decomposition based ECG denoising using non-local means and wavelet domain filtering. Australasian Physical & Engineering Sciences in Medicine, 41: 891-904. https://doi.org/10.1007/s13246-018-0685-0
[13] Shridhar, S., Karuna, Y., Saladi, S., Reddy, R. (2019). Denoising of ECG signals using wavelet transform and principal component analysis. In Proceedings of International Conference on Sustainable Computing in Science, Technology and Management (SUSCOM), Amity University Rajasthan, Jaipur-India. http://doi.org/10.2139/ssrn.3356368
[14] Blanco-Velasco, M., Weng, B., Barner, K.E. (2008). ECG signal denoising and baseline wander correction based on the empirical mode decomposition. Computer Biology Medicine, 38(1): 1-13. https://doi.org/10.1016/j.compbiomed.2007.06.003
[15] Nimunkar, A.J., Tompkins, W.J. (2007). EMD-based 60-Hz noise filtering of the ECG. In 2007 29th annual international conference of the IEEE Engineering in Medicine and Biology Society, Lyon, France, pp. 1904-1907. https://doi.org/10.1109/IEMBS.2007.4352688
[16] Jain, S., Bajaj, V., Kumar, A. (2017). Riemann Liouvelle fractional integral based empirical mode decomposition for ECG denoising. IEEE Journal of Biomedical and Health Informatics, 22(4): 1133-1139. https://doi.org/10.1109/JBHI.2017.2753321
[17] Kabir, M.A., Shahnaz, C. (2012). Denoising of ECG signals based on noise reduction algorithms in EMD and wavelet domains. Biomedical Signal Processing and Control, 7(5): 481-489. https://doi.org/10.1016/j.bspc.2011.11.003
[18] Yzu, Q.R. (2009). Realization and improvement of the modulus maximum de-noising method based on wavelet transformation. Journal of Nanjing University of Posts and Telecommunications, 29: 74-79.
[19] Peng, Y.H. (2000). De-noising by modified soft-thresholding. IEEE Asia-Pacific Conference on Circuits and Systems - Proceedings, 41(3): 760-762. https://doi.org/10.1109/apccas.2000.913631
[20] El B’charri, O., Latif, R., Elmansouri, K., Abenaou, A., Jenkal, W. (2017). ECG signal performance de-noising assessment based on threshold tuning of dual-tree wavelet transform. Biomedical Engineering Online, 16: 1-18. https://doi.org/10.1186/s12938-017-0315-1
[21] Prashar, N., Sood, M., Jain, S. (2021). Design and implementation of a robust noise removal system in ECG signals using dual-tree complex wavelet transform. Biomedical Signal Processing and Control, 63: 102212. https://doi.org/10.1016/j.bspc.2020.102212
[22] Kumar, A., Tomar, H., Mehla, V.K., Komaragiri, R., Kumar, M. (2021). Stationary wavelet transform based ECG signal denoising method. ISA Transactions, 114: 251-262. https://doi.org/10.1016/j.isatra.2020.12.029
[23] Ercelebi, E. (2004). Electrocardiogram signals de-noising using lifting-based discrete wavelet transform. Computer Biology Medicine, 34(6): 479-493. https://doi.org/10.1016/S0010-4825(03)00090-8
[24] Alyasseri, Z. A. A., Khader, A. T., Al-Betar, M.A. (2017). Electroencephalogram signals denoising using various mother wavelet functions: A comparative analysis. ACM International Conference Proceeding Series, Penang, Malaysia, pp. 100-105. https://doi.org/10.1145/3132300.3132313
[25] Alyasseri, Z.A.A., Khader, A.T., Al-Betar, M.A., Awadallah, M.A. (2018). Hybridizing β-hill climbing with wavelet transform for denoising ECG signals. Information Sciences (New York), 429: 229-246. https://doi.org/10.1016/j.ins.2017.11.026
[26] Levkov, C., Mihov, G., Ivanov, R., Daskalov, I., Christov, I., Dotsinsky, I. (2005). Removal of power-line interference from the ECG: A review of the subtraction procedure. Biomedical Engineering Online, 4(1): 1-18. https://doi.org/10.1186/1475-925X-4-50
[27] Satija, U., Ramkumar, B., Manikandan, M.S. (2018). A review of signal processing techniques for electrocardiogram signal quality assessment. IEEE Review of Biomedical Engineering, 11: 36-52. https://doi.org/10.1109/RBME.2018.2810957
[28] MIT-BIH database. (2023). http://www.physionet.org/physiobank/database/mitdb.
[29] Moody, G. B., Mark, R. G. (2001). The impact of the MIT-BIH arrhythmia database. IEEE Engineering in Medicine and Biology Magazine, 20(3): 45-50. https://doi.org/10.1109/51.932724
[30] Alyasseri, Z.A.A., Khader, A.T., Al-Betar, M.A., Abasi, A.K., Makhadmeh, S.N. (2020). EEG signals denoising using optimal wavelet transform hybridized with efficient metaheuristic methods. IEEE Access, 8: 10584-10605. https://doi.org/10.1109/ACCESS.2019.2962658
[31] Shark, L.K., Yu, C. (2003). Design of optimal shift-invariant orthonormal wavelet filter banks via genetic algorithm. Signal Processing, 83(12): 2579-2591. https://doi.org/10.1016/j.sigpro.2003.07.001
[32] da Silva, A.R.F. (2001). Evolutionary-based methods for adaptive signal representation. Signal Processing, 81(5): 927-944. https://doi.org/10.1016/S0165-1684(00)00272-3
[33] Donoho, D.L., Johnstone, I.M. (1994). Ideal spatial adaptation by wavelet shrinkage. biometrika, 81(3): 425-455. https://doi.org/10.1093/biomet/81.3.425
[34] Aggarwal, R., Singh, J.K., Gupta, V.K., Rathore, S., Tiwari, M., Khare, A. (2011). Noise reduction of speech signal using wavelet transform with modified universal threshold. International Journal of Computer Applications, 20(5): 14-19.
[35] Patil, R. (2015). Noise reduction using wavelet transform and singular vector decomposition. Procedia Computer Science, 54: 849-853. https://doi.org/10.1016/j.procs.2015.06.09
[36] Donoho, D.L., Johnstone, I.M. (1992). Ideal spatial adaptation via wavelet shrinkage. Biometrika. To appear. Also Tech. Report, Department of Statistics, Stanford University.
[37] Dokur, Z., Ölmez, T. (2008). Heart sound classification using wavelet transform and incremental self-organizing map. Digital Signal Processing, 18(6): 951-959. https://doi.org/10.1016/j.dsp.2008.06.001
[38] Naseri, H., Homaeinezhad, M.R. (2012). Computerized quality assessment of phonocardiogram signal measurement-acquisition parameters. Journal of medical engineering & technology, 36(6): 308-318. https://doi.org/10.3109/03091902.2012.684832
[39] Abdallah, A., Billel, B., Nail, A., Abdelkerim, S. (2023). ECG signal denoising based on wavelet transform and genetic algorithm. In 2023 International Conference on Advances in Electronics, Control and Communication Systems (ICAECCS), BLIDA, Algeria, pp. 1-6. https://doi.org/10.1109/ICAECCS56710.2023.10105043
[40] Rakshit, M., Das, S. (2018). An efficient ECG denoising methodology using empirical mode decomposition and adaptive switching mean filter. Biomedical Signal Processing and Control, 40: 140-148. https://doi.org/10.1016/j.bspc.2017.09.020
[41] Vargas, R.N., Veiga, A.C.P. (2020). Electrocardiogram signal denoising by a new noise variation estimate. Research in Biomedical Engineering, 36(1): 13-20. https://doi.org/10.1007/s42600-019-00033-y.
[42] García, M., Martínez-Iniesta, M., Ródenas, J., Rieta, J.J., Alcaraz, R. (2018). A novel wavelet-based filtering strategy to remove powerline interference from electrocardiograms with atrial fibrillation. Physiological Measurement, 39(11): 115006. https://doi.org/10.1088/1361-6579/aae8b1
[43] Condat, L. (2013). A direct algorithm for 1-D total variation denoising. IEEE Signal Processing Letters, 20(11): 1054-1057. https://doi.org/10.1109/LSP.2013.2278339
[44] Keshtkaran, M.R., Yang, Z. (2014). Keshtkaran, M.R., Yang, Z. (2014). A fast, robust algorithm for power line interference cancellation in neural recording. Journal of neural engineering, 11(2): 026017. https://doi.org/10.1088/1741-2560/11/2/026017
[45] Agrawal, S., Gupta, A. (2013). Fractal and EMD based removal of baseline wander and powerline interference from ECG signals. Computer Methods and Programs in Biomedicine, 43(11): 1889-1899. https://doi.org/10.1016/j.compbiomed.2013.07.030