Diarra Mamadou*![]() | Kacoutchy Jean Ayikpa
| Kacoutchy Jean Ayikpa![]() | Abou Bakary Ballo
| Abou Bakary Ballo![]() | Brou Médard Kouassi
| Brou Médard Kouassi![]()
© 2023 IIETA. This article is published by IIETA and is licensed under the CC BY 4.0 license (http://creativecommons.org/licenses/by/4.0/).
OPEN ACCESS
Skin cancer diagnosis forms a critical aspect of medical research, with notable improvements being driven by artificial intelligence (AI), particularly deep learning. This study is focused on a specific, crucial challenge: enhancing the diagnostic accuracy of skin cancer by leveraging the color information inherent in skin lesions. To meet this aim, an innovative method combining convolutional neural networks and deep learning-based image processing techniques was developed. The proposed methodology exploits various color spaces, including RGB, Lab, HSV, and YUV, to meticulously analyze skin lesion color characteristics. A comprehensive exploration of numerous color space combinations revealed the superior performance of the YUV-RGB blend. An impressive accuracy of 98.51% was attained in the detection and classification of different types of skin cancer using this combination, surpassing conventional diagnostic approaches in both speed and precision. These significant findings pave the way for early skin cancer detection, dramatically enhancing treatment possibilities and patient recovery prospects. This study, therefore, provides a substantial contribution to the domain of skin cancer diagnosis by fully harnessing the potential of AI and deep learning.
CNN, color spaces, skin cancer, deep learning, diagnosis
The skin, our body's largest organ, protects us [1] and fights infection. It is exposed to various aggressions throughout our lives, which can remain threatening factors for the skin. Unfortunately, like all organs, the skin can also develop cancer. Cancer has recently become one of the world's major health problems [2, 3]. Skin cancer involves the abnormal growth of skin cells. It is a type of cancer that is difficult to detect, potentially serious, and can appear at any age. It develops mainly in areas of the skin, such as the face, arms, etc., which are most exposed to ultraviolet rays. There are three main types of skin cancer: carcinoma, basal cell or squamous cell carcinoma, and melanoma.
However, whatever the type of cancer, it can be cured, provided it is detected early to avoid fatal consequences. However, there is a major drawback to diagnosing skin cancer. To detect this cancer, doctors have to remove the diseased part of the body for medical examination [4, 5] to determine whether there is any skin infection. This process takes time and can sometimes be very painful for the patient. Today, thanks to computer vision, it is possible to facilitate the diagnosis of skin cancer by analyzing images of affected skin. All that is required is to have these images and to analyze them using artificial intelligence technologies.
Color space exploration techniques can be used to analyze variations in color and texture in skin images. These characteristics can provide valuable information for distinguishing benign from malignant lesions and identifying different types of skin cancer.
Machine learning is an approach that enables algorithms to detect complex patterns and relationships from training data. By feeding these algorithms with numerous annotated images of skin, they can learn to recognize the distinctive features of different types of skin cancer.
Our study aims to apply color space exploration techniques to skin cancer images to assess and classify different types of cancer. These images will be classified using machine learning techniques, making predicting and identifying this disease possible. The aim is to diagnose skin cancer early, giving patients a better chance of treatment and recovery.
The main contributions of the study are as follows:
•We used several color spaces, such as RGB, Lab, HSV, and YUV, to represent and analyze the colors of skin lesions by exploring different color-related information;
•We have used artificial intelligence techniques, particularly Deep Learning and convolutional neural networks, to improve skin cancer diagnosis. These techniques have made it possible to analyze images of skin lesions in an automated and precise manner;
•We proposed an innovative approach by converting the YUV space into RGB space, thus creating a YUV-RGB combination. This combination has shown promising results in improving diagnostic accuracy. By simultaneously utilizing the advantages of both color spaces, this approach allowed for a more comprehensive analysis of skin lesions;
•We evaluated the performance of our approach using a database of skin lesion images called HAM10000, and we compared the performance of the different methods used, including the techniques mentioned in the scientific literature.
The work structure is organized as follows: Section 2 presents the related works, section 3 describes the methodology used, section 4 presents the results and discussion, and finally, section 5 concludes the study.
Skin cancer is one of the most dangerous forms of cancer [6]. Detection of skin cancer is problematic from the skin lesion due to artifacts, low contrast, and similar visualization of a mole, scar, etc. The automatic detection of skin lesions is therefore carried out using lesion detection techniques for accuracy, efficiency, and performance criteria. Vidya et al. [7] proposed a method to extract features using the ABCD rule, GLCM, and HOG feature extraction for early detection of skin lesions. The extracted features are directly fed to classifiers to classify skin lesions between benign and melanoma using different machine learning techniques such as SVM, KNN, and Naïve Bayes. These experiments' results gave an accuracy of 97.8%. Murugan et al. [8] conducted a study to identify skin cancer disease using a median filter and median shift segmentation. GLCM, Moment Invariants, and GLRLM features are extracted in this research work. The extracted features are classified using classification techniques such as support vector machine, probabilistic neural networks, random forest, and combined SVM+FR classifiers. However, the use of non-specific feature extraction techniques: the feature extraction techniques used in this study are the ABCD rule, GLCM and HOG feature extraction. These techniques are not specific to skin lesions. They may therefore be sensitive to other factors, such as lighting or image resolution. Gouda et al. [9] proposed a technique using a learning method through convolutional neural networks (CNN) to detect skin cancer. The Resnet50, InceptionV3, and Inception Resnet algorithms were used for fine-tuning. The results of these experiments gave a better accuracy rate of 85.8% with InceptionV3. However, the results may not be generalizable to larger populations. Daghrir et al. [10] proposed a hybrid method for detecting melanoma skin cancer. The proposed system used a convolutional neural network and two classical machine learning classifiers trained with features describing a skin lesion's edges, texture, and color. These methods are combined to improve their performance using majority voting. The 80.0% accuracy achieved with the combined methods is also promising, but is based on a biased dataset. The dataset consists of images of skin lesions from patients at high risk of melanoma. The results may not be generalizable to lower-risk populations. Mijwil [11] developed a deep learning network trained on 24,000 skin cancer images by a convolutional neural network (ConvNet) model. Three architectures (InceptionV3, ResNet, and VGG19) were used for the classification. The best of the results of these experiments is 87.47% accuracy. Despite being composed of images of skin lesions from patients from different countries and of different races. Results may not be generalizable to specific populations. Srividhya et al. [12] investigated a skin cancer detection model using high-performance image-based machine learning algorithms to run image intensity. This technique relies on the segmentation and feature extraction of the region of interest from the skin surface. The efficiency of this method gave an accuracy of 95%. It would be interesting to study the efficacy of the model on other types of skin cancer, such as melanoma. Rahi et al [13] used transfer learning model include VGG11, ResNet50 and DenseNet121. The results from this experiment give the Resnet architecture an accuracy of 90% as accuracy. But the study does not compare the performance of the different architectures on other computer vision tasks, such as object classification or face detection. Nawaz et al. [14] presented a method to segment skin melanoma at its earliest stage by employing a deep learning-based approach, namely faster region-based convolutional neural networks (RCNNs) equipped with FKM. The experimental results of their method show considerable improvements in the detection and segmentation of melanomas. However, the method is not applicable to all types of melanoma. The study was carried out on a dataset of nodular melanomas. Lentigo malignant and superficial melanomas may have different characteristics, and the method may not be as effective in segmenting them. Gouabou et al. [15] constructed a supervised computer-aided diagnosis system for melanoma. Their approach combined two support vector classifiers trained on features extracted from three extractors. Thus, the deep learning approach applies features extracted from two pre-trained models VGG16 and resnet50, to train two linear SVMs. The scores of these two classifiers are combined using a logistic regression algorithm to obtain the classification. The results of these experiments gave precisions of 78% and 83%, respectively. However, other methods could be explored to improve the accuracy of their system.
Different research works have been conducted in medical analysis to classify medical images by combining convolutional neural network (CNN) architectures and different data sets. For example, Velastegui and Pedersen [16] used an AlexNet CNN to classify colon tissue images to detect tumors. For this task, they also exploited different color spaces such as RGB, XYZ, CIELAB, HSV, and YCbCr. The results of these experiments demonstrated that color spaces provided the best accuracy for medical image classification. However, the method is not applicable to all types of tumour. The study was carried out on a dataset of colorectal tumours. Tumours of other types may have different characteristics and the method may not be as effective in detecting them. Similarly, Daniel S. et al. developed a method for detecting tumor cells using a set of CNNs trained with normalized images using various color adjustment techniques. Their method analyzed eight color spaces and their channels while applying two color normalization methods to mitigate the effects of color variation of histopathological images on the generalization of predictive models [17]. However, it also has many limitations that need to be considered to improve the method and make it more applicable to clinical practice. The proposed method involves using three models of the VGG-19 architecture, each trained on images generated from different sources. Specifically, these models were trained on images generated from the HSV color space, the red color channel of RGB images, and normalized RGB images using the Reinhard method. The results of this work revealed an improved accuracy of 0.9193.
Machine learning offers the possibility of extracting relevant information from existing data and training models that can predict the health status of patients. In this context, Suresh and Hegde [18] investigated a model using Genetic Algorithm (GN) to discover the 16 features related to the heart dataset from a dataset. The results of this model showed an accuracy of 95%.
Riyaz et al. [19] developed a novel ensemble-based deep learning model that has been proposed for the effective prediction of coronary heart disease. The dataset used for this purpose comes from the Framingham Heart Disease Database. Different performance evaluation measures, including precision, accuracy, recall, and f1 score, are used to evaluate the performance of the proposed model. Nevertheless, real data can be subject to variations such as measurement errors or missing data. It would be desirable to have a method that is more robust to data variations. Salim et al. [20] proposed a technique to diagnose diseases early. This method is based on hyperband optimization with the use of a classifier. XGBoost. The results of these experiments showed that the accuracy of the XGB-PCA-HO approach is 97.06%, that of XGB 88.24%, and that of Random Forest 85.29%. Much work has been done on cancer diagnosis, but early detection of cancer remains a major challenge.
Our experiments were performed on a Windows 10 computer with an Intel(R) Core™ i7-8650U processor, 16 GB of RAM, and a graphics card (GPU). Models were configured in Python using Keras API version 2.4.3 with Tensorflow version 2.4, and CUDA/CuDNN dependencies were used to speed up processing on the GPU.
3.1 Dataset
The training data for our work was obtained from two files, HAM10000_part1.zip and HAM10000_part2.zip, which constitute an extensive collection of dermatoscopic images from different sources representing common pigmented skin lesions. The first part of the database contains 5000 images, while the second part contains 5015 [21]. All images are in JPEG format.
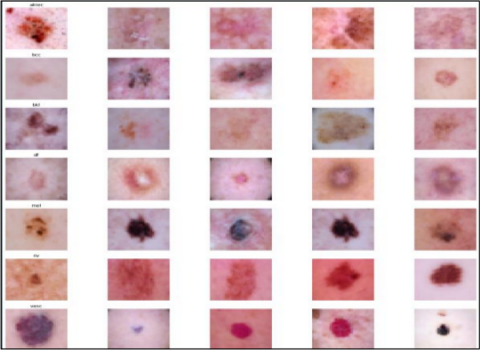
Figure 1. Sample of images from the HAM10000 set by cancer class
The HAM10000_metadata database is composed of seven (7) types of skin cancers, namely: melanocytic nevus (nv), melanoma (mel), benign keratosis-like lesions (bkl), basal cell carcinoma (bcc), actinic keratosis (akiec), vascular lesions (vasc) and dermatofibroma (df). In all, we have 10,015 images of skin cancer observations, as shown in the Figure 1.
3.2 Color space
A color space is a mathematical representation used to describe colors. Each color space has its specific characteristics and uses. In our study, we will use the following spaces: RGB, LAB, HSV, and YUV:
Converting JPEG images into these color spaces can be useful for skin cancer detection for several reasons. The different components of the color spaces may be more sensitive to the characteristics of different types of skin lesions. The LAB color space may be more sensitive to melanocytic lesions, while the V component of the YUV color space may be more sensitive to vascular lesions, while the RGB color space may be sensitive to discrimination between closely related colors, such as red and orange. HSV color space also improves sensitivity for detecting melanocytic lesions.
RGB (Red, Green, Blue): The RGB color space is based on combining the three primary colors of light: red, green, and blue. It is widely used in digital signage and computer imaging applications. Each pixel in the image is represented by a combination of red, green, and blue intensity values, typically between 0 and 255.
LAB (Luminance, a, b): LAB color space is a perceptual color space that separates luminance (L) from chromaticity information (a and b). The L component represents brightness, while the a and b components describe color values ranging from green to red (a-axis) and blue to yellow (b-axis). This color space is used to represent colors independently of the display device.
HSV (Hue, Saturation, Value): The HSV color space represents hue, saturation, and value colors. The hue (H) indicates the dominant color, the saturation (S) represents the intensity or purity of the color, and the value (V) corresponds to the luminosity. This color space is often used in image processing applications to adjust an image's hue, saturation, and lightness.
YUV (Luminance, Blue Chrominance, Red Chrominance): The YUV color space is used to separate luminance (Y) information from chrominance (U and V) information. The Y component represents the brightness, while the U and V components describe the difference between the luminance of blue and red. This color space is commonly used in video and television broadcast systems to separately represent black-and-white images (Y) and color information (U and V).
Each color space has its specific advantages and uses in medical imaging and other areas related to computer vision [22].
3.3 Methods
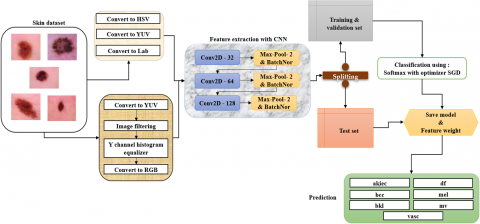
Our approach breaks down into four parts, as illustrated in the figure below. First, we perform image pre-processing, which includes resizing and converting to different color spaces. Then, we extract the features using a convolutional neural network (CNN) composed of three convolutional layers and three max-pooling layers to obtain discriminative representations of the images. In the third step, we classify the different types of skin cancer using the extracted features. Finally, we make predictions on the test data and evaluate the algorithm's performance. The architecture of our study is represented in Figure 2.
Preprocessing: The images from the database used were organized and filed in seven folders corresponding to different types of cancer. Each image has been resized to a size of 150 x 150 pixels. We also applied extraction techniques to target specific areas of cancer in our images. After resizing, the training and test images were converted into arrays, and the values assigned to the pixels of these arrays were adjusted in the interval [0,1]. All images are in the original RGB format.
We performed several conversions and processing to obtain five types of images, including the basic RGB format. These conversions are as follows:
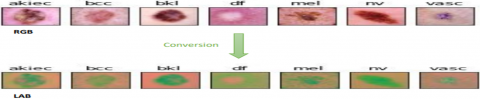
•Conversion to LAB: This operation takes place in two stages. First, RGB images are converted to XYZ, then XYZ are converted to LAB;
•Conversion to HSV: RGB images are converted to HSV to highlight the hue, saturation, and value components of our images;
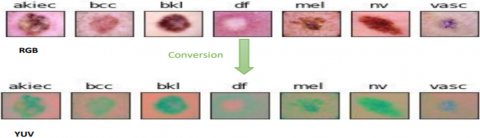
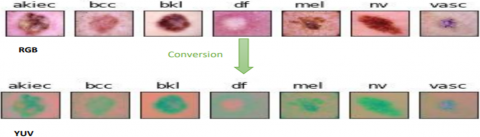
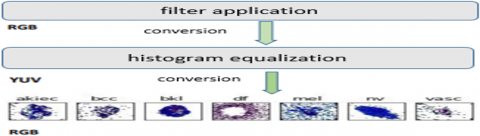
•Conversion to YUV: RGB images are converted to YUV; YUV-RGB combination technique: This technique converts the filtered image into the YUV color space, performs histogram equalization on the luminance component, then converts the image back into the RGB color space.
Our database's different conversions of skin cancer images resulted in training-ready data. They are illustrated in Table 1.
Figure 2. The general architecture of the method used
Table 1. Representation of images in various color spaces
|
Color Space |
Image of Each Color Space |
|
RGB |
|
|
LAB |
|
|
HSV |
|
|
YUV |
|
|
YUV-RGB Combination |
Feature extraction: We used a robust feature extractor, namely a convolutional neural network (CNN), to extract features from images. Our CNN architecture is designed to allow in-depth image analysis. It consists of three layers of convolutions with respectively 32, 64, and 128 filters and allows a rich representation of features. Each convolution layer is followed by a pooling layer to reduce data dimensionality while preserving essential information. After the block of convolutional analysis layers, we added another block of two dense layers. The first dense layer includes 128 neurons, allowing us to learn more abstract representations of previously extracted features. Finally, the last output dense layer contains seven neurons, corresponding to the number of classes of images we are processing (Table 2). This output layer allows us to classify images according to their type of skin cancer.
Using this CNN architecture, we can extract discriminating features from images and use them to classify different types of skin cancer accurately.
Using this CNN architecture, we can extract discriminating features from images and use them to classify different types of skin cancer accurately.
Table 2. CNN architecture parameter
|
Layer |
Output Shape |
|
Convolutional 1 |
32 |
|
Max- Pooling 1 |
2 |
|
Convolutional 2 |
64 |
|
Max- Pooling 2 |
2 |
|
Convolutional 3 |
128 |
|
Max- Pooling 3 |
2 |
The classification: Classification is a fundamental task in machine learning, which involves assigning class labels to examples to solve a specific problem. There are various classification tasks in machine learning, and different specialized modeling approaches can be used for each. As part of our study, we opted to use the SoftMax classifier.
The SoftMax classifier is a generalization of the binary form of logistic regression, and it is commonly used in deep learning, especially in computer vision, to classify extracted feature vectors [23]. Its operation is based on a matching function F designed to take an input data set x and match the output class labels using a dot product between the data x and a matrix W.
The SoftMax classifier is used to obtain class probabilities for each input example. It assigns each class a probability representing the model's confidence in its assignment of that class to the given example. The class with the highest probability is then chosen as the final prediction.
In our study, we use the SoftMax classifier to accurately classify skin cancer images by assigning them the appropriate class labels. The SoftMax classifier uses a score function that assigns a probability to each class based on the calculated final score. The peculiarity of the SoftMax function is that the sum of the probabilities of all the categories is equal to one, which makes it possible to obtain a normalized probability distribution. The formula of the SoftMax classifier is the following [24].
$f_j(z)=\frac{e^{z j}}{\sum_k e^{z k}}$ (1)
Every model we used was trained using this specific architecture, optimized with the SGD (Stochastic Gradient Descent) feature. Each training session was run for 50 epochs (training cycles), with a batch size of 20 images per batch. Table 3 presents the characteristics of the model.
Table 3. Model setup
|
Parameter |
Value |
|
Epoch |
50 |
|
Batch size |
20 |
|
Optimizer |
SGD with Momentum |
|
Learning rates |
0,001 |
|
Loss function |
Categorical cross entropy |
|
Input shape |
150x150x3 |
|
Activation |
Softmax |
3.4 Evaluation metrics
To evaluate the performance of the model of our study, we will use the following metrics:
Accuracy: This performance metric indicates how well the system has classified data into the correct categories or classes.
Precision: It represents the ratio between the number of correctly classified positive images and the total number of genuinely positive images.
Recall: This measures a classifier's ability to identify actual positive results.
The F1 score: It gives the weighted average of precision and recall, thus offering a balanced performance measure.
The Matthews Correlation Coefficient (MCC): It evaluates the quality of classifications in machine Learning, considering false positives and false negatives.
Mean Squared Error (MSE): It measures the average of the squared errors between the estimated values and the true values, thus making it possible to evaluate the precision of the estimates.
Using these metrics, we can quantify the model's performance in our study and assess their ability to classify skin cancer images accurately.
The equations of the different metrics are defined as follows:
Accuracy $=\frac{T P+T N}{T P+F P+T N+F N}$ (2)
Precision $=\frac{T P}{T P+F P}$ (3)
Recall $=\frac{T P}{T P+F N}$ (4)
F1 Score $=2 * \frac{\text { Precision } * \text { Recall }}{\text { Precision }+ \text { Recall }}$ (5)
$\mathrm{MCC}=\frac{T P * T N-F P * F N}{\sqrt{(T P+F p)(T P+F N)(T N+F P)(T N+F N)}}$ (6)
$M S E=\frac{1}{n} \sum_{i=1}^n(\mathrm{Yi}-\hat{\mathrm{Y}} i)^2$ (7)
4.1 Case of RGB space images
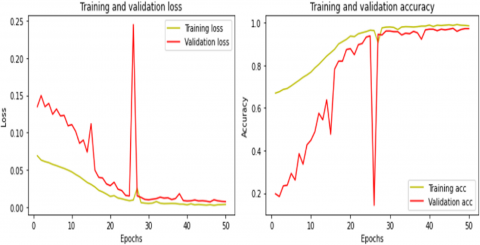
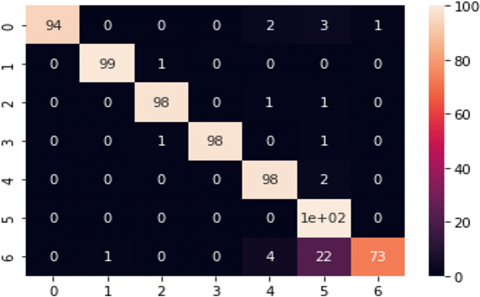
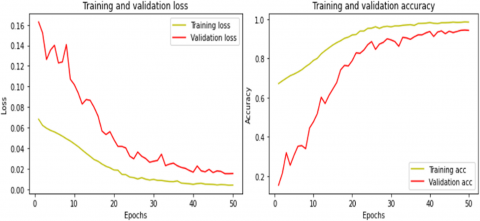
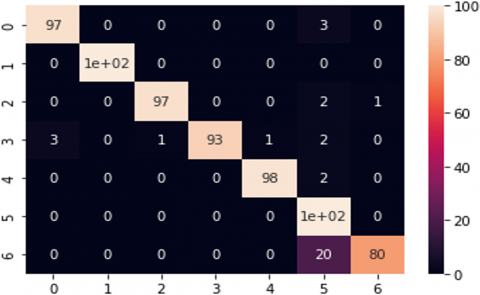
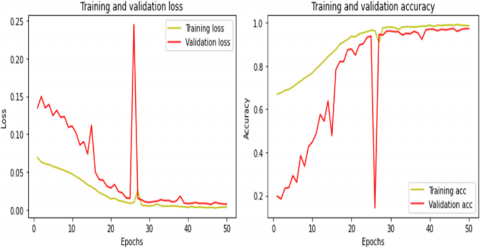
Our first case involved using skin cancer images as initial data in the RGB color space, which is the essential representation of image colorimetry. The results obtained after the testing phase of this model gave an accuracy rate of 97.28% and a precision of 97.39% for the diagnosis of skin cancer. Figure 3 illustrates the curves during the training and validation phase, while Figure 4 presents the confusion matrix.
Figure 3. Learning graph in RGB space
Figure 4. Confusion matrix in RGB space
4.2 Case of LAB space images
In our second case, the initial images loaded into our system were converted from RGB color space to LAB. After the testing phase, the model achieved an accuracy rate of 94% and a precision of 94.61% for diagnosing skin cancer. Figure 5 represents the curves during the training and validation phase, while Figure 6 presents the confusion matrix.
Figure 5. Learning graph in LAB space
Figure 6. Confusion matrix in LAB space
4.3 Case of HSV space images
In the third case, the images used in this model have been converted from RGB color space to HSV color space. The accuracy score obtained during the test phase amounts to 94.28%, with an accuracy of 95.21% for skin cancer diagnosis. Figure 7 illustrates the curves during the training and validation phase, while Figure 8 presents the confusion matrix.
Figure 7. Learning graph in LAB space
Figure 8. Confusion matrix in LAB space
4.4 Case of YUV space images
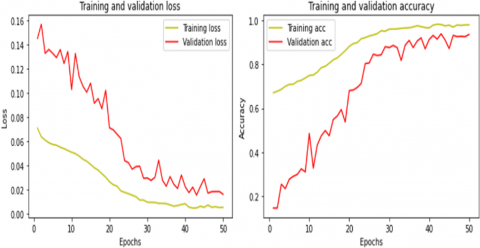
The images were converted from RGB to YUV color space in the fourth case. During training, the accuracy score obtained was 95%, with an accuracy score of 95.89% for skin cancer diagnosis. Figure 9 represents the curves during the training and validation phase, while Figure 10 presents the confusion matrix.
Figure 9. Learning graph in YUV space
Figure 10. Confusion matrix in YUV space
4.5 Case of YUV-RGB combination images
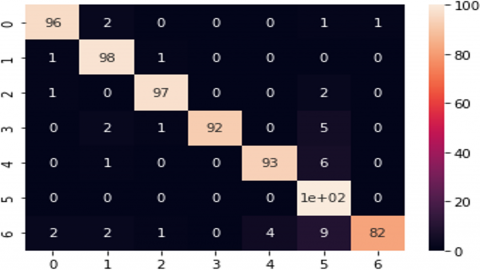
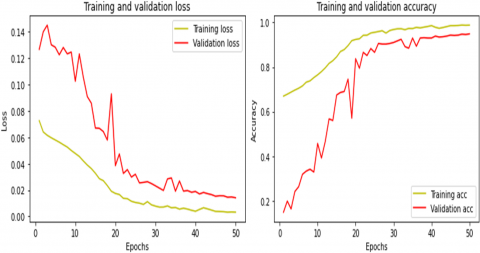
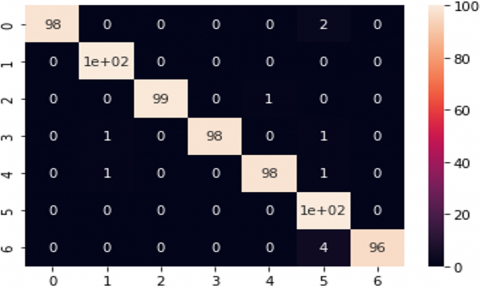
RGB images were filtered and then converted to YUV color space with histogram equalization applied to these images. Then all images were converted back to RGB. The results obtained after the training gave an accuracy score of 98.42% and an accuracy of 98.51% for skin cancer diagnosis. Figure 11 illustrates the curves during the training and validation phase, while Figure 12 presents the confusion matrix.
Figure 11. Learning graph in YUV-RGB Combination
Figure 12. Confusion matrix in YUV-RGB combination
Table 4. The confusion matrix value legend
|
0 |
akiec |
|
1 |
bcc |
|
2 |
bkl |
|
3 |
df |
|
4 |
mel |
|
5 |
nv |
|
6 |
vasc |
Table 5. The general performance of each model
|
Metrics |
Accuracy (%) |
Precision (%) |
F1 Score (%) |
Recall (%) |
MCC (%) |
MSE |
|
RGB |
97.28 |
97.39 |
97.29 |
97.28 |
96.85 |
0.72 |
|
LAB |
94 |
94.61 |
94.02 |
94 |
93.10 |
1.60 |
|
HSV |
94.28 |
95.21 |
94.25 |
94.28 |
93.50 |
1.53 |
|
YUV |
95 |
95.89 |
95.08 |
95 |
94.3 |
1.37 |
|
YUV-RGB Combination |
98.42 |
98.51 |
98.44 |
98,42 |
98.17 |
0.44 |
Table 4 provides the legend of the values used in the confusion matrices of the different cases used in our study. Model performance results and metric values are summarized in Table 5.
The performances of the different methods evaluated for skin cancer diagnosis are revealed by the results in Table 5, based on various performance measures. The method that stands out is the YUV-RGB combination, with an accuracy score of 98.42%, closely followed by the RGB method with 97.28%. These results demonstrate the effectiveness of these methods for precisely classifying the types of skin cancers.
Regarding accuracy, which measures the proportion of true positives among positive predictions, the YUV-RGB combination shows the best result with 98.51%, testifying its ability to minimize false positives. The RGB method closely follows it with an accuracy of 97.39%.
The F1 Score, a harmonic measure that combines accuracy and recall into a single value, is the highest for the YUV-RGB combination at 98.44%. This emphasizes an optimal balance between precision and recall.
The recall measures the proportion of true positives among the true positives. The YUV-RGB combination presents the best result, with 98.42%, while the RGB method achieves a recall of 97.28%. These results highlight their ability to minimize false negatives and effectively detect cases of skin cancer.
The MCC, which measures the correlation between model predictions and actual observations, is highest for the YUV-RGB combination at 98.17%, indicating a strong correlation between predictions and actual observations.
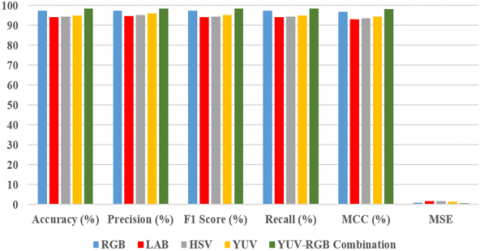
The MSE, which measures the root mean square error between predictions and actual observations, all methods show relatively low values. This indicates a good ability of the model to fit predictions to actual observations. The results highlight that the YUV-RGB combination provides the best overall accuracy, precision, F1 Score, recall, MCC, and MSE performance. However, the other methods, such as RGB and YUV, also show strong performance, suggesting that using specific color spaces can play an important role in accurately diagnosing skin cancer. Figure 13 shows the metric histogram for each model.
Figure 13. Histogram of metrics for each model
4.6 Comparison of different methods
Table 6 compares the performance of the different methods used in our study regarding precision. The different methods are based on the use of different color spaces. Here are the results obtained:
Analyzing the results shows that all the methods obtained high performance.
The RGB color space-based method achieved an accuracy of 97.28% and showed that the model correctly classified 97.28% of skin cancer images by assigning them the appropriate class labels.
The LAB color space showed an accuracy of 94%. Although slightly inferior to RGB, this method still shows promise in terms of performance.
The HSV color space also achieved an accuracy of 94.28%. This method demonstrated a performance similar to that of LAB.
Using the YUV color space, the model achieved 95% accuracy. This method also gave satisfactory results.
The combination of YUV and RGB gave the best performance, with an accuracy of 98.51%. This combined approach has improved the accuracy of the classification of skin cancer images.
Table 6. Comparison of methods used
|
Methods |
Accuracy (%) |
|
RGB |
97.28 |
|
LAB |
94 |
|
HSV |
94.28 |
|
YUV |
95 |
|
YUV-RGB Combination |
98.51 |
The results show that all methods gave a solid performance with high accuracy rates. However, the combination of YUV and RGB produced the best results. It is important to note that other factors, such as the dataset size and the training techniques used, can also influence the performance of the models. These results pave the way for future research and applications in skin cancer image classification.
4.7 Comparison with the state of the art
The results of our experiments gave better results than the state of the art, which are presented in Table 7.
Table 7. Methods comparison table
|
Methods |
Accuracy (%) |
|
Gouda et al. [9] |
85,8 |
|
Rahi et al. [13] |
90 |
|
Vidya et al. [7] |
97,80 |
|
Mijwil [11] |
87,47 |
|
YUV-RGB Combination |
98,51 |
By comparing the results of our study with the state-of-the-art works presented in the table, we can observe the following points:
In the study by Gouda et al. [9], an accuracy was achieved of 85.8%. Our results are significantly higher than this value, demonstrating a significant improvement in classification performance.
Rahi et al. [13] achieved 90% accuracy. Although our results are superior, it presents a good performance.
Vidya et al. obtained an accuracy of 97.80%. Our results are comparable to this study's, demonstrating high performance in classifying skin cancer images.
Mijwil [11] obtained an accuracy of 87.47%. Our results are significantly higher than this value, indicating a noticeable improvement in performance over their study.
Our method, based on the combination of YUV and RGB, achieved an accuracy of 98.51%. This demonstrates outstanding performance in classifying skin cancer images, surpassing all other state-of-the-art works in the table.
Our results significantly improve over state-of-the-art works, with high performance in classifying skin cancer images. The combination of YUV and RGB color space yielded the best results, demonstrating the effectiveness of this approach for accurately classifying skin cancer images. These results confirm the importance of continued research in this area to improve the performance of medical image classification.
In conclusion, our study demonstrates the growing importance of artificial intelligence, particularly Deep Learning, in skin cancer diagnosis. By exploiting color spaces and using convolutional neural networks, we were able to develop a novel method to detect and classify cancer types more accurately. Our approach, based on a combination of the YUV-RGB space, surpassed traditional methods in terms of accuracy, with a rate of 98.51%. This method offers an opportunity for early diagnosis of skin cancer, paving the way for more effective treatments and a better chance of patient recovery. Our work has significant implications for the field of skin cancer diagnosis in the future. Firstly, our method based on artificial intelligence, in particular Deep Learning, paves the way for more accurate and faster early detection of skin cancer. This means that patients could be diagnosed earlier, which in turn would considerably increase their chances of recovery. By detecting skin cancer at an early stage, treatments can be less invasive and more effective.
What's more, our model could also have an impact on patients' quality of life. By enabling earlier and more accurate diagnosis, patients would benefit from fewer painful and invasive medical interventions, improving their comfort and reducing healthcare costs. Ultimately, the application of our method in the medical field could help to reduce the number of deaths from skin cancer, as patients would have better access to early and effective care.
For future research, we will explore other color spaces that are potentially relevant for analyzing images of skin lesions, such as the LCH (Luminance, Chroma, Hue) space, which is an interesting option that merits further study. LCH is derived from the LAB space and also separates luminance from chrominance information while using another representation of chrominance called Chroma, which measures saturation. Using the LCH space could provide additional information about the color and texture of skin lesions, which could improve the ability to distinguish between different types of skin cancer. In addition, the CMYK (Cyan, Magenta, Yellow, Key) space is commonly used in the printing industry and could also be investigated for its potential in analyzing images of skin lesions.
We therefore plan to explore these additional color spaces as part of our future research to determine their relevance and effectiveness in classifying different types of skin cancer. These explorations could enable us to discover valuable new information for the early and accurate diagnosis of this disease.
[1] Montagnat-Rentier, C. (2014). Vieillissement de la peau et les produits cosmétiques anti-âge actuels en pharmacie: la réglementation, leur composition, leur efficacité et l’attente des clients. Sciences Pharmaceutiques. https://core.ac.uk/download/pdf/39991594.pdf.
[2] Amiour, N., Bouhachicha, K., Boussalem, F.Z., Rezzagui, A. (2022). Cancer colorectal: Aspects moléculaires et cellulaires et nouvelles approches thérapeutiques. 2022. PhD Thesis. Université de Jijel.
[3] Mondiale de la SantÉ, Organisation. (2023). Cadre de mise en œuvre de l’initiative mondiale contre le cancer du sein: évaluation, renforcement et amplification des services de détection précoce et de prise en charge du cancer du sein: résumé d’orientation. In Cadre de mise en œuvre de l’initiative mondiale contre le cancer du sein: éValuation, renforcement et amplification des services de détection précoce et de prise en charge du cancer du sein: résumé d’orientation. https://iris.who.int/bitstream/handle/10665/365789/9789240067615-fre.pdf?sequence=1.
[4] Mourad, Z., Fadhila, D., Samira, C. (2021) Conception et implémentation d’un système d’aide au diagnostic du cancer de la peau: application à la classification du mélanome. Université de Larbi Ben M’hidi-Oum Oum El Bouaghi.
[5] Hartinger, A. (2012) Détection du cancer de la peau par tomographie d'impédance électrique. PhD Thesis. École Polytechnique de Montréal.
[6] Risques de cancer de la peau. https://cancer-de-la-peau.ooreka.fr/comprendre/risques-cancer-peau.
[7] Vidya, M., Karki, M.V. (2020). Skin cancer detection using machine learning techniques. In 2020 IEEE international conference on electronics, computing and communication technologies (CONECCT), Bangalore, India, pp. 1-5. https://doi.org/10.1109/CONECCT50063.2020.9198489
[8] Murugan, A., Nair, S.A.H., Preethi, A.A.P., Kumar, K.S. (2021). Diagnosis of skin cancer using machine learning techniques. Microprocessors and Microsystems, 81: 103727. https://doi.org/10.1016/j.micpro.2020.103727
[9] Gouda, W., Sama, N.U., Al-Waakid, G., Humayun, M., Jhanjhi, N.Z. (2022). Detection of skin cancer based on skin lesion images using deep learning. Healthcare, 10(7): 1183. https://doi.org/10.3390/healthcare10071183
[10] Daghrir, J., Tlig, L., Bouchouicha, M., Sayadi, M. (2020). Melanoma skin cancer detection using deep learning and classical machine learning techniques: A hybrid approach. In 2020 5th International Conference on Advanced Technologies for Signal and Image Processing (ATSIP), Sousse, Tunisia, pp. 1-5. https://doi.org/10.1109/ATSIP49331.2020.9231544
[11] Mijwil, M.M. (2021). Skin cancer disease images classification using deep learning solutions. Multi media Tools and Applications, 80(17): 26255-26271. https://doi.org/10.1007/s11042-021-10952-7
[12] Srividhya, V., Sujatha, K., Ponmagal, R.S., Durgadevi, G., Madheshwaran, L. (2020). Vision based detection and categorization of skin lesions using deep learning neural networks. Procedia Computer Science, 171: 1726-1735. https://doi.org/10.1016/j.procs.2020.04.185
[13] Rahi, M.M.I., Khan, F.T., Mahtab, M.T., Ullah, A.A., Alam, M.G.R., Alam, M.A. (2019). Detection of skin cancer using deep neural networks. In 2019 IEEE Asia-Pacific Conference on Computer Science and Data Engineering (CSDE), Melbourne, VIC, Australia, pp. 1-7. https://doi.org/10.1109/CSDE48274.2019.9162400
[14] Nawaz, M., Mehmood, Z., Nazir, T., Naqvi, R.A., Rehman, A., Iqbal, M., Saba, T. (2022). Skin cancer detection from dermoscopic images using deep learning and fuzzy k-means clustering. Microscopy research and technique, 85(1): 339-351. https://doi.org/10.1002/jemt.23908
[15] Gouabou, A.C.F., Heim, F., Damoiseaux, J.L. (2019). Apprentissage profond pour l’aide au diagnostic du mélanome à partir d’exemple. Doctoral dissertation, Université de Haute-Alsace.
[16] Velastegui, R., Pedersen, M. (2021). The impact of using different color spaces in histological image classification using convolutional neural networks. In 2021 9th European Workshop on Visual Information Processing (EUVIP), Paris, France, pp. 1-6. https://doi.org/10.1109/EUVIP50544.2021.9484035
[17] Luz, D.S., Lima, T.J., Silva, R.R., Magalhães, D.M., Araujo, F.H. (2022). Automatic detection metastasis in breast histopathological images based on ensemble learning and color adjustment. Biomedical Signal Processing and Control, 75: 103564. https://doi.org/10.1016/j.bspc.2022.103564
[18] Suresh, R., Hegde, N.P. (2023). Genetic feature selection and naive bayes for efficient heart disease prediction. Journal of Theoretical and Applied Information Technology, 101(12): 4983-4990.
[19] Riyaz, L., Butt, M.A., Zaman, M. (2022). A novel ensemble deep learning model for coronary heart disease prediction. Revue d'Intelligence Artificielle, 36(6): 825-832. https://doi.org/10.18280/ria.360602
[20] Salim, K., Hebri, R.S.A., Besma, S. (2022). Classification predictive maintenance using XGboost with genetic algorithm. Revue d'Intelligence Artificielle, 36(6): 833-845. https://doi.org/10.18280/ria.360603
[21] Papers with Code - HAM10000 Dataset. https://paperswithcode.com/dataset/ham10000-1
[22] Ayikpa, K.J., Mamadou, D., Gouton, P., Adou, K.J. (2023). Classification of cocoa pod maturity using similarity tools on an image database: Comparison of feature extractors and color spaces. Data, 8(6): 99. https://doi.org/10.3390/data8060099
[23] Kowsari, K., Jafari Meimandi, K., Heidarysafa, M., Mendu, S., Barnes, L., Brown, D. (2019). Text classification algorithms: A survey. Information, 10(4): 150. https://doi.org/10.3390/info10040150
[24] Qi, X., Wang, T., Liu, J. (2017). Comparison of support vector machine and softmax classifiers in computer vision. In 2017 Second International Conference on Mechanical, Control and Computer Engineering (ICMCCE), China, pp. 151-155. https://doi.org/10.1109/ICMCCE.2017.49