Pooja Singh*![]() | Neeru Rathee
| Neeru Rathee![]() | Sunanda Sharda
| Sunanda Sharda![]() | Sanoj Kumar
| Sanoj Kumar![]()
© 2023 IIETA. This article is published by IIETA and is licensed under the CC BY 4.0 license (http://creativecommons.org/licenses/by/4.0/).
OPEN ACCESS
Segmentation of tumors from brain Magnetic Resonance Imaging (MRI) imagery is of utmost importance, particularly given their diverse morphologies and contrasts. In this paper, two novel methods of tumor segmentation are proposed, both employing Rough Set Theory in conjunction with clustering techniques: Fuzzy C-Means (FCM) and K-Means. In the first methodology, the cluster centers derived from FCM are incorporated into a Rough Set model to facilitate segmentation. Conversely, the second methodology utilizes cluster centers from K-Means clustering within the Rough Set framework for the same purpose. These techniques have been implemented on two publicly available brain MRI datasets. For preprocessing, an initial thresholding step is executed, followed by extraction of the foreground region via a binary mask. The Rough Set-based FCM is then applied to the binary image, generating cluster centers that are subsequently utilized by the Rough Set to accurately segment the tumor region. A similar approach is employed in the Rough Set-based K-Means clustering methodology. Experimental results indicate that the hybridization of Rough Set Theory with K-Means outperforms standard FCM, K-Means clustering, and FCM clustering in terms of accuracy, precision, recall, f-measure, and computational time. The average accuracy was found to be at a minimum for FCM (53.95%) and at a maximum for K-Means-based Rough Set Theory (95.77%). Moreover, the average clustering time was shortest for K-Means clustering (6.256s), and longest for FCM-based Rough Set Theory (43.27s). This study thus presents significant advancements in the field of tumor segmentation from brain MRI images, with potential implications for improved diagnostic accuracy and patient outcomes.
tumor segmentation, Rough Set Theory, K-Means clustering, Fuzzy C Means, membership function
The most severe types of cancer worldwide are brain tumors [1]. A brain tumor is an abnormal mass of tissue where some cells develop and reproduce uncontrollably. This unregulated growth encroaches on the skull obstructs normal brain function, and harms brain tissue. The most prevalent primary brain tumor, glioma, develops due to glial cell carcinogenesis in the brain and spinal cord [2]. The human brain comprises three types of tissues: white matter, grey matter, and cerebrospinal fluid.
In medicine, Magnetic Resonance Imaging (MRI), a well-known non-invasive technique, is used to identify brain tumors since it generates a substantial and varied array of tissue contrasts in each imaging modality. Protons in tissue are aligned using the magnetic characteristics of atomic nuclei in the MRI imaging technique. The interval between succeeding pulse sequences and the time to echo (TE) represents the interval between the delivery of an RF pulse and the reception of an echo signal impacts the order of RF pulses. The contrast and brightness of the images are calculated using two relaxation durations, T1 and T2. T1-weighted and T2-weighted scans are the two most used MRI sequences. T1-weighted images have short TE and TR times, whereas T2-weighted images have longer TE and TR times. Similar to T2-weighted images, the Flair sequence attenuates CSF fluid, making abnormalities bright and normal fluid dark. This makes the Flair sequence sensitive to pathology and simplifies distinguishing between CSF and abnormalities.
Brain tumor segmentation aims to detect and segment the tumor regions by analysing brain MRI. Segmentation is the method of dividing a collection of nonuniform data into similar groups of types depending on some attribute [3]. This is performed by locating unstable regions compared to normal brain MRI tissue. Clinically, it is challenging to understand the presence of a brain tumor due to the variety in size, position, rate of growth, and pathology. The tumorous brain scan frequently shows a core tumor, necrosis, and oedema in addition to normal tissues [4]. These tissues have similar intensity patterns in structural MRI sequences, including T1-w, T2-w, and FLAIR. tumors, such as meningiomas, can be segmented easily, whereas gliomas and glioblastomas are challenging to locate. Glioblastomas are infiltrative tumors. Thus, they commonly have fuzzy borders, are poorly contrasted, and extend tentacle-like characteristics, making them challenging to distinguish from normal tissues and segments [5, 6]. Another challenge is due to the reason that they can develop anywhere in the brain and can take on nearly any shape or size. Chan [7] stated that in T2-weighted images, most malignant tumors can exhibit inhomogeneous signals. A well-defined mass with homogenous internal signal intensity does not necessarily identify a benign lesion, even though a uniform signal on T2-weighted imaging can be a good indicator of a benign lesion.
Manual segmentation is frequently inaccurate because it differs between observers [8]. Even manual contouring requires much time and is highly variable among and between observers. The one's load on medical practitioners makes it more difficult and inaccurate. Automated segmentation has been suggested to solve this problem [4]. In this paper, we have proposed an algorithm to identify precise and effective boundary curves of brain tumors in medical images.
The image segmentation used so far can be defined in various ways, including edge-based, region-based, threshold-based, and many more.
Sujji et al. [9] used the methods of thresholding for the segmentation of brain MRI. This method for segmenting MRI brain images improved performances in identifying the region of interest. However, it suffered from the drawback of not handling multi-channel images susceptible to noise and homogeneities in intensity. To improve, Manisha et al. [10] used the thresholding and Sobel operator, which resulted in better performance in terms of accuracy and efficacy than thresholding alone. Even the Canny operator performs well for medical images, but these methods take too long time for execution. Shanthi and Kumar [11] segmented the brain tissues into White matter (WM), Gray matter (GM) and Cerebrospinal Fluid (CSF) from the T1-weighted MR Images using threshold and region growth methods. The region-based method performs well when the borders are difficult to distinguish, and the images are noisy. However, it is of limited use due to spatial domain restriction; this procedure also needs to improve [12].
Additionally, conventional techniques, including machine learning methods, are frequently employed in MR image segmentation. The most common supervised learning methods for brain tumor segmentation are Neural networks (NN) [13], Convolutional Neural Networks (CNN) [2, 14] and Support Vector machines (SVM) [15]. These techniques need the user to have prior information on an original dataset, which serves as the training set. Then the algorithms decide how to differentiate between normal and diseased tissues based on the training datasets and apply their findings to experimental, unlabeled test datasets. Unsupervised classification, such as K-Means clustering, fuzzy c-means and self-organisation feature maps, requires no prior information about the given dataset. The term "unsupervised learning" describes techniques for finding patterns in data sets that comprise data points that are neither categorised nor labelled [16]. In general, supervised algorithms perform better than unsupervised ones at the cost of computation time.
Fuzzy C Means is mainly used for the segmentation of medical images. However, it is sensitive to initial cluster centres and takes a long time to compute. Arakeri and Ram Mohana Reddy [17] resolved these issues by using the information about the distribution of grey levels in brain MRI images with tumors. Cluster centres and membership functions are calculated for these grey levels. Moreover, novel objective function accordingly that provides improved cluster stability and compactness. The efficiency and accuracy of this approach are better than conventional FCM. Sreerangappa et al. [18] used a spatial FCM and Level set evolution method to segment the brain tumor from MR images by calculating the Dice and Jaccard coefficients. K-means, a partitional clustering, is widely used to segment the tumor from brain MRI images [19, 20], but its performance determines if the starting clustering centres are inappropriately chosen. To overcome these limitations. K-Means clustering has been combined with FCM and supervised learning methods [21, 22]. To overcome above mentioned limitations of FCM and K Means Clustering. RST-based image segmentation has been applied for medical diagnosis, target recognition, and image segmentation [23].
Inspired by the promising results of RST-based image segmentation techniques, the two methods for segmentation of tumors from brain MRI images. First is Rough Set-based FCM, and the second is Rough Set-based K-Means with little preprocessing. FCM is sensitive to cluster centres. In the proposed method, the obtained cluster centres are updated with the help of a rough set. In K-Means, the number of clusters must be defined in advance, and a wrong number of clusters may affect the clusters. The cluster centres are optimised using a rough set in the proposed method. As a result, RST can be used to determine the number of initial clusters, overcoming the limitation of the K-means algorithm. These methods have been evaluated on two publically available datasets of brain MRI. Then the results are compared in accuracy, precision, recall, f-measure and execution time. The paper is organised as follows: Section 2 presents preliminary knowledge about RST, FCM and K-Means, Section 3 describes the proposed method, Section 4 focuses on simulation and results, and Section 5 depicts the conclusion.
2.1 Rough Set Theory (RST)
RST was first proposed by Pawlak [24]. It is a helpful tool for enhancing the accuracy and reliability of data analysis by reducing the number of attributes while maintaining the classification ability. It is based on indiscernibility, lower and upper approximation, reduction, and other approximations. RST involves several steps example, attribute reduction, rule extraction, value reduction, and decision rule minimisation.
The data in the RST is represented in a decision table. Each sample object has a section tag that identifies its class. The attribute label is a decision attribute, while the remaining attributes are known as conditional attributes. Assume that U represents the set of all objects in the sample space and A represents the set of all their properties [25]. An information system is defined as a pair of sample spaces and properties such that $\mathrm{U} \rightarrow V_a$. $V_a$ is called the value set of a. It approximates an arbitrary set X by a pair of lower approximations and upper approximations. The lower approximation is the collection of samples of U that belong to X. In contrast, the upper approximation is the collection of samples of U that possibly belong to X.
Due to the complexities and correlation of the image information, incompleteness and uncertainty are commonly present in the processing process. As a result, regarding image processing, RST outperforms general hard computing methods. In literature, RST is used in image enhancement, image segmentation, image filtering etc. Image processing based on RST can produce better results.
2.2 Fuzzy C-Means (FCM) Clustering
The fuzzy C-means Clustering (FCM) algorithm is an unsupervised learning algorithm where each data can be assigned to many clusters. Each data is assigned as membership degrees between 0 and 1. Through numerous iterations, it searches for the ideal extremes [26]. FCM uses Euclidean distance as an objective function, which is a distance measure hence the data in the sample space that are close to one other will be grouped. In the case of linear sample spaces, FCM can produce a good clustering effect.
FCM only considers image intensity, which is inefficient in noisy images. As a result, in poor contrast, nonuniformity, and noisy images, this algorithm completely fails. Many algorithms were proposed to make FCM noise resistant, although most were and still are flawless to some level.
FCM is a repetitive technique that finds a solution by repeatedly updating the cluster centre and membership value. Consider the N data samples denoted by $\mathrm{X}=x_1, x_2, x_3, \ldots, x_N$. It must be divided into c-clusters by minimising the following cost function.
$J=\sum_{j=1}^N \sum_{i=1}^c v_{i j}^n\left\|x_j-y_i\right\|^2$ (1)
The membership of $x_j$ with the ith cluster is represented by $v_{i j}$, $y_i$ as the centre of the ith cluster, and n is the fuzzy index [27].
2.3 K-Means clustering
K-Means clustering is one of the most significant unsupervised learning partitional Clustering, which MacQueen invented. This method divides the dataset into k centroid disjoint subsets, with k being the number of clusters previously known. The "centroid" of each cluster in K-means corresponds to the arithmetic mean of the data points assigned to the cluster. This algorithm estimates the distance between all samples and all k centroid clusters iteratively, then places each data in the nearest centroid cluster, after which all k centroid clusters are recalculated and updated. The process continues till the objective function, i.e., the squared error function reduced [28]. K-means is an iterative algorithm that reduces the total distances between each data and its cluster centroid across all clusters.
The steps to implement the K-means algorithm are listed below:
1. The number of clusters and the centre should be defined.
2. Find the Euclidean distance (d) among each pixel ‘$p(x, y)$’ and the cluster centre ‘ $c_k$ ’ using the equation below for each pixel:
$\mathrm{d}(\mathrm{x}, \mathrm{y})=\left\|p(x, y)-c_k\right\|$ (2)
3. Based on the Euclidean distance, allocate every pixel to the nearest centre.
4. Use the equation below to recalculate the centre's location once all the pixels have been allocated.
$c_k=\frac{1}{k} \sum_{y \in c_k} \sum_{x \in c_k} p(x, y)$ (3)
5. Repeat the procedure until the tolerance or error value is reached.
6. Resize and reorganise the cluster pixels to fit the image.
This Clustering is easy to implement, but it has one disadvantage, i.e., a predefined number of clusters is challenging.
The proposed algorithm applies a hybrid of a rough set with K-Means clustering and a rough set with FCM to the two datasets of brain MRI images. During preprocessing, images are enhanced to make a clear boundary between the tumor region and other tissues. FCM is used on the images after preprocessing. The FCM output, or the cluster centres and the clusters, is given as an input parameter. Using RST, the cluster centres are minimised. All of the computed centres from FCM receive the RST. The best minimum subset that preserves the correctness of the initial set is returned. These smaller cluster centres are employed to isolate malignancies on brain MRI.
The proposed algorithm for tumor segmentation from brain MRI is performed by two methods:
(i) Tumor segmentation using RST-based FCM;
(ii) Tumor segmentation using RST-based K-Means.
These methods are implemented on two datasets of brain MRI images. Both methods are divided into image preprocessing, cluster centre and cluster formation calculation, and reduction of initial cluster centres set by RST. The proposed method is applied to two publicly available datasets of brain MRI images.
3.1 Tumor segmentation from brain MRI using RST-based FCM
3.1.1 Image preprocessing
The brain MRI images are often low contrast. In order to improve the quality of an image, contrast stretching is used. To make a clear boundary between the tumor region and other tissues, dilation of an image with a disk-shaped structuring element of radius (R=8) is used on the image. By extending the segmented image's boundaries, this dilation procedure improves segmentation accuracy. The obtained images are binarised using global thresholding to identify the region of interest from the background [29]. This binarised image is divided into [8×8] blocks, and all pixels with a grey value higher than or equivalent to the threshold value are assigned to a single value, and their grey value is set to 255. Otherwise, the grey value is 0, signifying that the background area is present and these pixels are not included in the object area. The following experimental operation must analyse the affected brain region; thus, the mask operation restores the grey value of the affected brain region.
3.1.2 Fuzzy C- Means clustering
After preprocessing, FCM is applied on each 8×8 block as:
$v_{i j}=\frac{1}{\sum_{k=1}^c\,\,\left(d_{i j} / d_{i k}\right)^{2 / m-1}}$ (4)
$y_j=\left(\sum_{i=1}^n\left(v_{i j}\right)^m x_i\right) /\left(\sum_{i=1}^n\left(v_{i j}\right)^m\right)$ (5)
As a result, we get an initial set of clustering centres, each defined by a combination of fuzzy sets [30].
3.1.3 Reducing FCM initial cluster centers set by RST
To reduce the initial cluster centres with the RST, the following steps are followed:
For the initial set of cluster centres, create a decision table
Rough Set uses a table to store data model information. Each row represents one or more information or objects. Inconsistencies between the facts are common. Data tables are known as Information Systems in Rough Set jargon. Input data from any domain are therefore represented in the information table. When a decision characteristic or attributes are present, a decision table is also referred to as such.
Depending upon the degree of similarity (α) between two cluster centres, clusters are assigned as redundant cluster centres [31].
$\begin{gathered}X \leftrightarrow Y, \quad Y \leftrightarrow Z \\ X \leftrightarrow Y \leftrightarrow Z\end{gathered}$ (6)
If redundant cluster centres X and Y and Y and Z are both redundant cluster centres, then X, Y, and Z are all members of the same redundant cluster centre. A decision table is constructed for initial cluster centres using image features, the central point and the radius 'β’ as conditional attributes. Hence, a decision table is computed using the value of π -membership function [25].
Removing redundant cluster centres from the initial set of cluster centres
Reduction theory can be used to optimise the initial cluster centre set. The following four decision rules are applied to remove the redundant cluster centre from the initial cluster centres [32].
Remove the redundant decision samples from the cluster centre's initial setup. Carry out the procedure outlined above for each condition attribute until the condition attribute set remains unchanged. These reduced cluster centres are used for tumor segmentation. To evaluate the cluster quality, accuracy is used. Accuracy is calculated as the total of true positive and false negative out of true positive, false positive, true negative and false negative.
3.2 Tumor segmentation from brain MRI using RST-based K-means
The preprocessing (2.1.1) is applied to the images to segment the tumor using K-Means-based RST. After the preprocessing, K-Means clustering (1.3) is applied to the images. As an input parameter, pass the output of k-means clustering, i.e., cluster centres with the clusters.
The cluster centres are reduced using RST (2.1.3). The RST is applied to all of the computed centres from K-Means clustering. It returns the best minimum subset that maintains the original set's accuracy. These reduced cluster centres are used to segment tumors from brain MRI.
The MATLAB platform was used to implement each simulation experiment. The accuracy of the proposed method has been assessed for two publically available datasets of brain MRI images:
Dataset description
Dataset 1: This dataset is from ‘The Cancer Imaging Archive (TCIA) Public Access brain image database. This dataset of images is in .dicot format [33]. This brain tumor dataset, which includes 3064 T1-weighted contrast-enhanced images from 233 patients with three different types of brain tumors-meningioma (708 slices), glioma (1426 slices), and pituitary tumor (930 slices)-contains three different types of brain tumors of [512×512] size.
Dataset 2: The brain MRI images were selected from an available online dataset of images [34]; these dataset images are in the .mat file. This dataset includes 274 cases of gliomas, including both high-grade and low-grade GBM. The size of the images is [512×512].
RST-based Clustering is studied for brain MRI images with FCM and K-means algorithms. To evaluate the performance of RST based FCM and RST-based K-means algorithm, the accuracy of the segmentation algorithm and clustering time is evaluated on both datasets.
For image segmentation, RST into FCM and RST into K-Means are introduced. This helps the FCM and K-Means algorithms better converge.
We compared the performance measures on the first dataset on FCM-based RST and K-Means clustering-based RST. We observed that K-Means clustering-based RST performed better than FCM-based RST in terms of average accuracy, clustering time, precision, recall and average F-measure. On the first dataset, average accuracy has increased from 97.61 to 98.59, average clustering time is reduced from 43.27 to 30.15, average precision also increased from 0.98 to 0.99, average recall value increased from 0.93 to 0.97, and average F-Measure also increased from 0.93 to 0.96 (Table 1).
Figure 1 compares segmentation findings among proposed FCM-based RST and K-Means clustering-based RST on the first dataset. The first column displays the considered original image; the second column shows the findings of FCM; the third shows the findings of K-Means clustering; the fourth and fifth column shows the findings of FCM-based RST and K-Means-based RST.
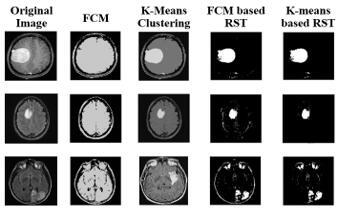
On the second dataset, we again compared average accuracy, average clustering time, average precision, average recall, and average F-measure for traditional FCM, K-Means clustering, FCM-based RST and K-Means clustering-based RST. The average accuracy for FCM is a minimum (of 53.95) and K-Means based RST is a maximum (of 95.77), the average clustering time for K-Means clustering is a minimum (of 6.256s), and FCM-based RST is a maximum (of 43.27s) (Table 2). Figure 2 compares segmentation findings among proposed FCM-based RST and K-Means clustering-based RST on the second dataset. The first column displays the considered original image; the second column shows the ground truth image; the third column shows the image after thresholding; the fourth and fifth column shows the findings of FCM-based RST and K-Means-based RST. Figure 3 presents the findings of traditional FCM, K-Means clustering, FCM-based RST and K-Means-based RST on the second dataset. Figure 4 represents the comparison of different parameters for segmentation under FCM, K-Means Clustering, FCM-based RST and K-Means clustering-based RST on a second dataset of images.
Table 1. Comparison of different parameters for segmentation under FCM-based RST and K-Means clustering-based RST on the first dataset of images
|
S.No. |
Image |
Average Accuracy |
Average Clustering Time (sec) |
Average Precision |
Average Recall |
Average F-Measure |
|
1 |
FCM based RST |
97.61 |
43.27 |
0.98 |
0.93 |
0.93 |
|
2 |
K-means based RST |
98.59 |
30.15 |
0.99 |
0.97 |
0.96 |
Table 2. Comparison of different parameters for segmentation under FCM, K-Means Clustering, FCM-based RST and K-Means clustering-based RST on a second dataset of images
|
S.No. |
Image |
Average Accuracy |
Average Clustering Time (sec) |
Average Precision |
Average Recall |
Average F-Measure |
|
1 |
FCM |
53.95 |
7.245 |
0.99 |
0.51 |
0.67 |
|
2 |
K-Means Clustering |
58.89 |
6.256 |
0.99 |
0.55 |
0.71 |
|
3 |
FCM based RST |
93.45 |
43.27 |
0.97 |
0.96 |
0.96 |
|
4 |
K-Means based RST |
95.77 |
30.15 |
0.99 |
0.98 |
0.98 |
Figure 1. The comparison of FCM-based RST and K-Means clustering-based RST for tumor segmentation on the first dataset of images
Figure 2. The comparison of FCM-based RST and K-Means clustering-based RST for tumor segmentation on the second dataset of images
Figure 3. The comparison of FCM, K-Means, FCM-based RST and K-Means clustering-based RST for tumor segmentation on the second dataset of images
Figure 4. Comparison of different parameters for segmentation under FCM, K-Means Clustering, FCM-based RST and K-Means clustering-based RST on a second dataset of images
This paper suggests tumor segmentation from brain MRI images using FCM-based RST and, in the second method K-Means clustering-based RST with little preprocessing on two publically available datasets of brain MRI images. The K-Means clustering-based RST performs better than traditional FCM, K-Means clustering and FCM-based RST. In preprocessing, the image dilation with a disk of radius(R=8) is used. Then the binary masking is done on the image, which restores the original pixel values more significantly than the threshold value.
Then the FCM is applied to each brain MRI image. FCM gives the different clusters their cluster centres. Then the RST is applied to these clusters to reduce the redundant clusters and confirm the clusters with the help of upper and lower limit values. Similarly, K-means clustering is applied on an image and after preprocessing in the second method. Resulting in a different cluster with their cluster centres; these clusters are verified with the help of RST. The results are compared, and we concluded that computational time for K-Means-based RST is minimum on both datasets. Even the average accuracy, precision, recall and F-measure are minimum for K-Means-based RST compared to the other given methods. The proposed algorithm is applied to grayscale images. As the brain MRI images are 3D, it will be more beneficial if the algorithm works well on them. In future, clustering relational datasets in bioinformatics, data, and web mining, rough fuzzy c medoids can be used.
[1] Aldape, K., Brindle, K.M., Chesler, L., Chopra, R., Gajjar, A., Gilbert, M.R., Gottardo, N., Gutmann, D.H., Hargrave, D., Holland, E.C., Jones, D.T.W., Joyce, J.A., Kearns, P., Kieran, M.W., Mellinghoff, I.K., Merchant, M., Pfister, S.M., Pollard, S.M., Ramaswamy, V., Rich, J.N., Robinson, G.W., Rowitch, D.H., Sampson, J.H., Taylor, M.D., Workman, P., Gilbertson, R.J. (2019). Challenges to curing primary brain tumours. Nature Reviews Clinical Oncology, 16(8): 509-520. https://doi.org/10.1038/s41571-019-0177-5
[2] Ranjbarzadeh, R., Bagherian Kasgari, A., Jafarzadeh Ghoushchi, S., Anari, S., Naseri, M., Bendechache, M. (2021). Brain tumor segmentation based on deep learning and an attention mechanism using MRI multi-modalities brain images. Scientific Reports, 11(1): 10930. https://doi.org/10.1038/s41598-021-90428-8
[3] Mohabey, A., Ray, A.K. (2000). Fusion of rough set theoretic approximations and FCM for color image segmentation. In Smc 2000 Conference Proceedings. 2000 IEEE International Conference on Systems, Man and Cybernetics.'Cybernetics Evolving to Systems, Humans, Organizations, and their Complex Interactions', 2: 1529-1534. https://doi.org/10.1109/ICSMC.2000.886073
[4] Havaei, M., Davy, A., Warde-Farley, D., Biard, A., Courville, A., Bengio, Y., Pal, C., Jodoin, P.M., Larochelle, H. (2017). Brain tumor segmentation with deep neural networks. Medical Image Analysis, 35: 18-31. https://doi.org/10.1016/j.media.2016.05.004
[5] Feng, X., Tustison, N.J., Patel, S.H., Meyer, C.H. (2020). Brain tumor segmentation using an ensemble of 3d u-nets and overall survival prediction using radiomic features. Frontiers in Computational Neuroscience, 14: 25. https://doi.org/10.3389/fncom.2020.00025
[6] Bhandari, A., Koppen, J., Agzarian, M. (2020). Convolutional neural networks for brain tumour segmentation. Insights into Imaging, 11(1): 77. https://doi.org/10.1186/s13244-020-00869-4
[7] Chan, W.P. (2013). Magnetic resonance imaging of soft-tissue tumors of the extremities: A practical approach. World Journal of Radiology, 5(12): 455-459. https://doi.org/10.4329%2Fwjr.v5.i12.455
[8] Veiga-Canuto, D., Cerdà-Alberich, L., Sangüesa Nebot, C., Martínez de las Heras, B., Pötschger, U., Gabelloni, M., Sierra, J.M.C., Taschner-Mandl, S., Düster, V., Cañete, A., Ladenstein, R., Neri, E., Martí-Bonmatí, L. (2022). Comparative multicentric evaluation of inter-observer variability in manual and automatic segmentation of neuroblastic tumors in magnetic resonance images. Cancers, 14(15): 3648. https://doi.org/10.3390/cancers14153648
[9] Sujji, G.E., Lakshmi, Y.V.S., Jiji, G.W. (2013). MRI brain image segmentation based on thresholding. International Journal of Advanced Computer Research, 3(1): 97.
[10] Manisha, Radhakrishnan, B., Suresh, L.K. (2017). Tumor region extraction using edge detection method in brain MRI images. In 2017 International Conference on Circuit, Power and Computing Technologies (ICCPCT), pp. 1-5. https://doi.org/10.1109/ICCPCT.2017.8074326
[11] Shanthi, K.J., Kumar, M.S. (2007). Skull stripping and automatic segmentation of brain MRI using seed growth and threshold techniques. In 2007 International Conference on Intelligent and Advanced Systems. IEEE, pp. 422-426. https://doi.org/10.1109/ICIAS.2007.4658421
[12] Shrimali, V., Anand, R.S., Kumar, V. (2009). Current trends in segmentation of medical ultrasound B-mode images: A review. IETE Technical Review, 26(1): 8-17.
[13] Xiong, S., Wu, G., Fan, X., Feng, X., Huang, Z., Cao, W., Zhou, X., Ding, S., Yu, J., Wang, L., Shi, Z. (2021). MRI-based brain tumor segmentation using FPGA-accelerated neural network. BMC Bioinformatics, 22: 421. https://doi.org/10.1186/s12859-021-04347-6
[14] Wang, G., Li, W., Ourselin, S., Vercauteren, T. (2019). Automatic brain tumor segmentation based on cascaded convolutional neural networks with uncertainty estimation. Frontiers in Computational Neuroscience, 13: 56. https://doi.org/10.3389/fncom.2019.00056
[15] Ayachi, R., Ben Amor, N. (2009). Brain tumor segmentation using support vector machines. In European Conference on Symbolic and Quantitative Approaches to Reasoning and Uncertainty, Berlin, Heidelberg: Springer Berlin Heidelberg, 5590: 736-747. https://doi.org/10.1007/978-3-642-02906-6_63
[16] Barlow, H.B. (1989). Unsupervised learning. Neural Computation, 1(3): 295-311. https://doi.org/10.1162/neco.1989.1.3.295
[17] Arakeri, M.P., Ram Mohana Reddy, G. (2011). Efficient fuzzy clustering based approach to brain tumor segmentation on MR images. In International Conference on Computational Intelligence and Information Technology. Berlin, Heidelberg: Springer Berlin Heidelberg, 250: 790-795. https://doi.org/10.1007/978-3-642-25734-6_141
[18] Sreerangappa, M., Suresh, M., Jayadevappa, D. (2019). Segmentation of brain tumor and performance evaluation using spatial fcm and level set evolution. The Open Biomedical Engineering Journal, 13(1). http://dx.doi.org/10.2174/1874120701913010134
[19] Thylashri, S., Yadav, U.M., Chowdary, T.D. (2018). Image segmentation using k-means clustering method for brain tumour detection. International Journal of Engineering & Technology, 7(2.19): 97-100. https://doi.org/10.14419/ijet.v7i2.19.15058
[20] Dhanalakshmi, P., Kanimozhi, T. (2013). Automatic segmentation of brain tumor using K-Means clustering and its area calculation. International Journal of Advanced Electrical and Electronics Engineering, 2(2): 130-134.
[21] Malathi, M., Sinthia, P. (2018). MRI brain tumour segmentation using hybrid clustering and classification by back propagation algorithm. Asian Pacific Journal of Cancer Prevention: APJCP, 19(11): 3257-3263. https://doi.org/10.31557%2FAPJCP.2018.19.11.3257
[22] Pitchai, R., Supraja, P., Victoria, A.H., Madhavi, M.J.N.P.L. (2021). Brain tumor segmentation using deep learning and fuzzy K-means clustering for magnetic resonance images. Neural Processing Letters, 53: 2519-2532. https://doi.org/10.1007/s11063-020-10326-4
[23] Namburu, A., Samayamantula, S.K., Edara, S.R. (2017). Generalised rough intuitionistic fuzzy c‐means for magnetic resonance brain image segmentation. IET Image Processing, 11(9): 777-785. https://doi.org/10.1049/iet-ipr.2016.0891
[24] Pawlak, Z. (1982). Rough sets. International Journal of Computer & Information Sciences, 11: 341-356. https://doi.org/10.1007/BF01001956
[25] Elmoasry, A.M. (2017). Classification of MR medical images based rough-fuzzy k-means. IOSR Journal of Mathematics, 13(01): 69-77. https://doi.org/10.9790/5728-1301036977
[26] Phellan, R., Falcão, A.X., Udupa, J.K. (2016). Medical image segmentation via atlases and fuzzy object models: Improving efficacy through optimum object search and fewer models. Medical Physics, 43(1): 401-410. https://doi.org/10.1118/1.4938577
[27] Wiharto, W., Suryani, E. (2020). The comparison of clustering algorithms K-means and fuzzy C-means for segmentation retinal blood vessels. Acta Informatica Medica, 28(1): 42-47. https://doi.org/10.5455%2Faim.2020.28.42-47
[28] Elavarasi, S.A., Akilandeswari, J., Sathiyabhama, B. (2011). A survey on partition clustering algorithms. International Journal of Enterprise Computing and Business Systems, 1(1).
[29] Huang, H., Meng, F., Zhou, S., Jiang, F., Manogaran, G. (2019). Brain image segmentation based on FCM clustering algorithm and rough set. IEEE Access, 7: 12386-12396. https://doi.org/10.1109/ACCESS.2019.2893063
[30] Shi, Z., Chao, Y., He, L., Nakamura, T., Itoh, H. (2007). Rough set based FCM algorithm for image segmentation. International Journal of Computational Science, 1(1): 58-68.
[31] Roy, P., Goswami, S., Chakraborty, S., Azar, A., Dey, N. (2014). Image segmentation using rough set theory: A review. International Journal of Rough Sets and Data Analysis. 1. 62-74. https://doi.org/10.4018/ijrsda.2014070105
[32] Halder, A., Dasgupta, A. (2012). Image segmentation using rough set based k-means algorithm. In Proceedings of the CUBE International Information Technology Conference, pp. 53-58. https://doi.org/10.1145/2381716.2381728
[33] Clark, K., Vendt, B., Smith, K., Freymann, J., Kirby, J., Koppel, P., Moore, S., Phillips, S., Maffitt, D., Pringle, M., Tarbox, L., Prior, F. (2013). The cancer imaging archive (TCIA): Maintaining and operating a public information repository. Journal of Digital Imaging, 26: 1045-1057. https://doi.org/10.1007/s10278-013-9622-7
[34] Jun, C. (2017). Brain tumor dataset. Figshare. https://doi.org/10.6084/m9.figshare.1512427.v5