Arunkumar Beyyala*![]() | Rajaram Priya
| Rajaram Priya![]() | Subramani Roy Choudari
| Subramani Roy Choudari![]() | Rajaram Bhavani
| Rajaram Bhavani![]()
© 2023 IIETA. This article is published by IIETA and is licensed under the CC BY 4.0 license (http://creativecommons.org/licenses/by/4.0/).
OPEN ACCESS
Thyroid cancer, the most common endocrine malignancy, has exhibited a steadily increasing incidence worldwide. Recently, ultrasound (US) imaging has been recognized as a potential diagnostic tool for early assessment of thyroid nodules. However, visual interpretation of nodules is subject to the radiologists' subjective evaluations. To address this, a computer-aided Diagnostic (CAD) system has been developed to differentiate between benign and malignant thyroid nodules. The efficiency of this nodule classifier is heavily dependent on the features employed in the classification process. In this study, the efficacy of the RREMI-RF approach, employing the Multi-Channel Convolutional Neural Network (MCNN) and Hybrid Feature Cropping Network (HFCN) techniques, was evaluated. An innovative Follow the Regularised Leader-based Deep Neural Network (FTRL-DNN) technique is proposed for the precise classification of thyroid nodules. In this method, the AlexNet learning-based feature extraction system was utilized to extract features during the classification process. Images from the Digital Database Thyroid Image (DDTI) dataset were classified using the Long Short Term Memory (LSTM) classifier. Performance metrics, including accuracy, sensitivity, specificity, precision, and error rate, were used to assess the effectiveness of the FTRL-DNN algorithm. Compared to the HFCN and MCNN, the FTRL-DNN-based thyroid nodule classification demonstrated superior accuracy, achieving a rate of 98.94%. This research presents a significant advancement in the automated classification of thyroid nodules, potentially improving early detection and treatment of thyroid cancer.
AlexNet, feature selection, follow the regularized learning based deep neural NETWORKTHYROID nodule classification, random forest classifier
One of the most common endocrine tumours in the human body today is thyroid cancer. Up to 68% of symptomatic individuals in the general population have thyroid nodules. 7-15% of thyroid nodules are affected by thyroid cancer, which is the disease with the highest rate of growth across all populations [1]. The thyroid gland, an endocrine gland, secretes thyroid hormones. These hormones largely control protein synthesis and metabolic rate. They also have a number of other effects, particularly those that are connected to the growth of the human body [2]. Their prevalence is very important to reduce the risks its depends on identification method used. A CAD technology that is based on image properties is the ultrasound approach to image categorization. utilising Deep Learning (DL) and cloud technologies to create an intelligent diagnosis model based on image classification [3]. The classification challenge for thyroid nodule CAD can be stated as a machine learning problem where the model automatically identifies between benign and malignant nodules on ultrasound images [4]. By decreasing effort and diagnostic variances across doctors, ultrasound can offer a trustworthy, consistent, highly effective, and repeatable ultrasound diagnosis pathway for thyroid nodules [5]. Recently, a number of researchers have conducted extensive research in the field of CAD to reduce the impact of subjective factors on physician diagnosis and improve diagnostic precision. The attributes are used to create a validation model, which is then examined to determine the applicability of each attribute selected for categorization [6, 7].
Techniques for thyroid nodule testing have significantly improved during the past 20 years. Ultrasound (US) imaging is frequently used as the primary point of diagnosis and for the evaluation of thyroid nodules because it successfully pictures and visualises soft tissue features [8]. It is also the most widely used and economical imaging technique, free of ionising radiation. The structure and characteristics of nodules can be learned through a thyroid ultrasound scan [9, 10]. As a result, thyroid issues such echogenicity, texture, a lack of microcalcification, a halo, and intra-nodular blood flow can be more easily found. Numerous machine learning-based techniques have been proposed [11] for autonomously identifying and assessing thyroid nodules in ultrasound images. These methods are separated into two groups: radionics and DL-based techniques. A radionics-based technique was introduced to extract quantitatively high throughput image features from medical images, such as the Gray-Level Co-occurrence Matrix (GLCM), Histograms of Oriented Gradients, and Grey level run-length matrix [12, 13]. Recently, computer-aided diagnosis systems have performed as well as or better than radiologists at making diagnoses from medical images as a result of the advancement of DL, notably Convolutional Neural Network (CNN) [14]. The complex nodule detection model utilising DL requires a hyper parameter adjusting technique to improve system performance. It is occasionally required to tune the hyperparameters to make the smart search algorithm faster than random search. The suggested model used an optimisation strategy for hyper parameter adjustment to address this issue [15]. The current techniques are unable to classify thyroid nodules accurately. Additionally, the approaches used to choose useful criteria for thyroid nodule classification are ineffective. The suggested Regularised Learning based Deep Neural Network (FTRL-DNN) approach aims to address the shortcomings of existing systems. The contribution of the research are as follows:
The remaining of the paper is mentioned as follows: Section 2 provides the existing work information about thyroid nodule classification. The clear details about the FTRL-DNN based thyroid nodule classification is given in section 3. Section 4 provides the outcome of the FTRL-DNN whereas the conclusion is presented in section 5.
To obtain a feature model of the nodule in pictures, Zhao et al. [1] created an automated thyroid ultrasound nodule diagnostic method based on CNN. The first step is to collect both positive and negative samples, normalise the images, then segment the nodule region to build an ultrasound thyroid nodule dataset. Second, texture features are extracted, features are chosen, and data dimensionality is decreased to construct a texture features model. A plethora of prior medical knowledge is included in the suggested strategies for nodule texture information, which might aid the computer in producing better results. The suggested approach won't, however, result in longer computation times for the fusion weights.
Using deep learning, Li et al. [2] developed a patch-based approach to swiftly identify thyroid nodules from intraoperative frozen sections. The approaches suggested for thyroid patch classification models, which need the right annotating information. We use the Region of Interests (ROI) approach to decrease the annotation work by annotating three different types of locations. The proposed method was used to improve the model's generalisation abilities and, as a result, to change the classification model. However, in data augmentation, the images are enhanced utilising slower techniques like flipping, rotating, and blurring.
To effectively detect and identify thyroid nodules, Ma et al. [16] developed a YOLOv3-Dense Multi-Receptive Fields (DMRF). In order to keep conveying edge and texture properties to deeper layers, the DMRF-CNN was developed by combining dilated convolution with different dilation rates. Two different scale detection layers are utilised to distinguish between thyroid nodules of different sizes. As a result, the suggested solutions performed better in terms of Mean Average Precision (MAP) and detection time than earlier object detection frameworks. The model is over fitted on the training data since the performance on the testing data is insufficient.
Hybrid feature cropping network with a multi-branch structure was proposed by Song et al. [17] to extract features and identify ultrasound pictures of thyroid nodules. To obtain global characteristics, use the global branch. The addition of the feature cropping method in the other branch is intended to lessen the detrimental impacts of the close local resemblances between benign and malignant nodules of the same time, feature vectors of various scales are produced as a result of the two branch cropping frames' various sizes. The outcome demonstrates its superiority to the current mainstream networks.
Multi-channel convolutional neural network architectures were constructed by Zhang et al. [18] for the diagnosis of thyroid cancer. The Xception neural network is used as the basis of the current study's practical framework [19], which consists of three flexible multi-channel architectures that have been successfully tested on real-world data sets. The suggested structure also includes interpretable results as proof, which can increase practitioners' confidence. The radionics features, however, did not apply the Fourier transformation or the gray-level size zone matrix, which to some part represent statistical data.
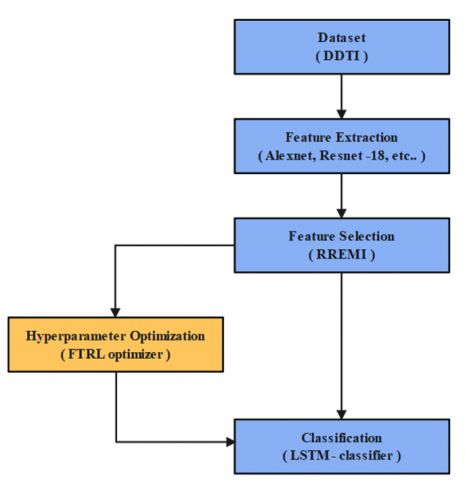
The block diagram of the proposed research was shown in Figure 1. Database, Feature Extraction, Feature Selection, Hyper Parameter Optimization and Classification using LSTM classifier are described below.
Figure 1. Block diagram of the proposed work
3.1 Dataset collection
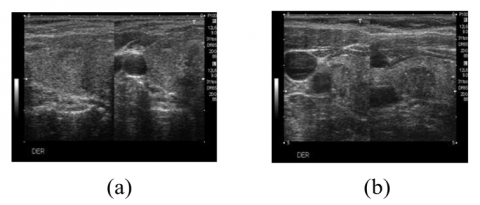
The Digital Database of Thyroid Images (DDTI) dataset, provided by Columbia National University, is used in this study to classify thyroid nodules [20]. This collection includes 480 US pictures from 400 thyroid illness patients. After ignoring the 480 faulty images, 427 US images are all that are left. Based on the placement of thyroid nodules in each class of the different (TI-RADS) standard, the thyroid pictures in this dataset are divided into six classes: 2, 3, 4A, 4B, 4C, and 5. According to the TI-RADS recognition concept, the classes "2, 3" are designated as benign nodules and "4A, 4B, 4C, 5" are designated as malignant nodules. Then, the sample images of benign and malignant nodules are shown in the Figure 2 (a) and Figure 2 (b) respectively.
Figure 2. Sample images: (a) Benign nodules; (b) Malignant nodules
3.2 Feature extraction
After gathering the data, AlexNet and ResNet-18 were used to effectively extract the features. Eight successive layers make up the AlexNet model, the first five of which are convolutional layers and the final three of which are fully connected layers. The greater number of hidden layers included in the network allows the AlexNet to extract features effectively. The bias layer of the ResNet-18 CNN is a convolutional layer, and it passes the input picture through a convolutional filter to produce a characteristic map. The kernel designates the 55 shaped matrix that had to be transformed into the input pattern matrix. The convolutional layer's output is shown in Eq. (1).
$x_j^l=f\left(\sum_{a=1}^N W_j^{l-1} * Y_a^{l-1}+b_j^l\right)$ (1)
where, the feature map $j$ at $l$ th layer is represented as $x_j^l$; the activation function is represented as $f()$; total amount of features on the layer $l-1$ is denoted as $N$; the kernel on the layer $l-1$ is $W_j^{l-1}$; the feature map at $l-1$ layer is denoted as $Y_a^{l-1}$; the convolution mode is denoted as (*) and the bias value of the convolutional layer is denoted as $b_j^l$. The second layer after the convolution layer is pooling layer which used to perform the down-sample to input feature data. Moreover, the data's space size and parameter quantity for model's each layer are decreased by accomplishing the pooling operation. The maximum value of the neural unit is taken by max-pooling layer at certain field, therefore the new feature from the pooling kernel is expressed in Eq. (2).
$x n_j^l=\beta_i^l \operatorname{down}\left(x_j^{l-1}\right)+b_j^l$ (2)
where, the $j$ th multiplication of $l$ th layer is denoted as $\beta_j^l$ and the pooling function is represented as down(.).
The crucial CNN layer is a fully interconnected layer that functions as a multilayered perception. Since it was designed to address the gradient vanishing problem, this connected layer uses the Rectified Linear Unit (ReLU) described in Eq. (3) as an activation function.
$\operatorname{ReLU}(x)= \begin{cases}0, & x<0 \\ x, & x \geq 0\end{cases}$ (3)
3.3 Feature selection
In order to choose the best features from the feature set $(\mathrm{xn})$, the input feature extraction is sent to the feature selection process using the RREMI algorithm. When utilising the traditional Relief approach, the feature is solely selected based on its weight, which is calculated using the closest target. Here, just the 0 s and 1 s (i.e., weight values) are taken into account when choosing the features, which causes even the features with the greatest solutions to be overlooked. In order to lessen the redundancy of the features, the Renyi entropybased mutual information is combined with the weight values of traditional Relief. Consider the following: the subset has N_s features, the feature subspace is indicated by the letter s, and the dataset contains $M$ samples with labels. Hence, the sample data $m(1 \leq m \leq M)$ with labels in the dataset is expressed as vectors $x n^{(m)}=\left(x n_1^{(m)}, \ldots, x n_N^{(m)}\right)$ in the space which is generated by $N$ amount of features from complete feature set. Moreover, the $x n_s^{(m)}$ denotes the certain sample data $m$ with the labels in the dataset at the $N_s$ dimensional feature subspace.
Eq. (4) shows the computed distance between the two points in the subspace $S$ chosen by the feature subsets. Here, the normalization method is used to normalize the results.
$\begin{aligned} & d\left(x n_s^{\left(m_1\right)}, x n_s^{\left(m_2\right)}\right) =d_M\left(x n_s^{\left(m_1\right)}, x n_s^{\left(m_2\right)}\right) \exp \left(-\frac{d_M\left(x n_s^{\left(m_1\right)}, x n_s^{\left(m_2\right)}\right)}{d i s t_{\max }}\right)\end{aligned}$ (4)
where, $1 \leq m 1 ; m 2 \leq M$; the Manhattan distance between two different vectors is denoted as $d_M$ and the $dist_{\max }$ is expressed in the following Eq. (5).
$d i s t_{\max }=\max d\left(x n_s^{(m)}, x n_s^{(k)}\right) \\m \neq k, m, k \in\{1, \ldots, M\}$ (5)
3.4 Hyper parameter optimization using FTRL-DNN
After feature selection, we used FTRL-DNN to classify data utilising hyper parameter optimisation to fine-tune the hyper parameters. The assigned records and variable data were utilised to forecast the solar array output power using the FTLR-DNN algorithm. The learning rate value is one of the additional factors that must be given for the optimisation process. By testing a set of parameters first and then adding new ones to check if the optimisation approach performs better, the FTRL-DNN method of obtaining the hyperparameters is manual. Traditional manual tuning takes a long time, and it needs a domain expert to speed things up. To apply the FTRL-DNN algorithm in the predication process, first some notations was established. $\left(g_t, y_t\right)$ is the instances in the recorded sample data. It represents input vector of the prediction model and there are $d$ entries including irradiance profile and the switch state with ith entry denoted by $g_t$. Besides, $y_t$ describes the photovoltaic array of output power in the instance which is expected by the prediction model. The prediction of $y_t$ is described by $h_t(w)=\sum w_t x_t$. Moreover, the function is defined in Eq. (6),
$J_t(w)=\frac{1}{2}\left(b_t(w)-y_t\right)^2$ (6)
To decide the weights w, the FTRL-DNN was used. Besides, to fasten the calculation, L1 and L2 regularization are added. The FTRL-DNN based regression prediction model is then operated with two parts, that is prediction process and model updating was showed in Eq. (7).
$w_{t, i}=\left\{\begin{array}{c}0|z| \leq \lambda_t, \\ -\left(\frac{\beta+\sqrt{n_i}}{\alpha}+\lambda_2\right)\left(z_i-\operatorname{sgn}\left(z_i\right) \lambda_1\right) \text { otherwise },\end{array}\right.$ (7)
where,
$\alpha \rightarrow$ learning rate
$\beta \rightarrow$ Smoothing parameter for adaptive learning rate $\lambda_1, \lambda_2 \rightarrow L_1, L_2$, regularization
$Z_1, n_i, \rightarrow$ Initialized to be 0
3.5 Long Short Term Memory (LSTM)
The LSTM classifier is provided the feature selection to show performance when huge datasets are managed. Large datasets demand more memory to use, which raises the computational difficulty. To address the aforementioned downgrades, the developed model uses the Firefly Algorithm with LSTM-produced hyper parameters. Key factors like the number of epochs and hidden layers must be optimised in order to surpass the LSTM model. The LSTM unit computing process is described in the following points.
Here, the patient memory cell $\widetilde{c_t}$ is computed, $b_c$ is represented as bias, and $W_c$ is denoted as weight matrix, as indicated in Eq. (8).
$\widetilde{c_t}=\tanh \left(W_c \cdot\left[h_{t-1}, x_t\right]+b_c\right)$ (8)
As illustrated in Eq. (9), the input gate $i_t$ is computed, present input data update of memory cell state value is controlled by the input gate, $b_i$ is stated as bias, $W_i$ is stated as weight matrix, and $\sigma$ is defined as sigmoid function.
$i_t=\sigma\left(W_i \cdot\left[h_{t-1}, x_t\right]+b_i\right)$ (9)
The value of forget gate $f_t$ is computed, forget gate handles a memory cell state value depends historical data update, $b_f$ is stated as bias, $W_f$ is stated as weight matrix, as shown in Eq. (10).
$f_t=\sigma\left(W_i \cdot\left[h_{t-1}, x_t\right]+b_f\right)$ (10)
The LSTM model is easy to update, reset, read, and store long-term data since it relies on memory cells and control gates. The internal parameter sharing mechanism of the LSTM operates the output dimensions in accordance with the setups for the weight matrix dimensions. The class probabilities are determined from the data, and the deep co-learning approach identifies labels based on phrases that were not previously detected.
This section explains the results of the FTRL-DNN optimizer technique. The FTRL-DNN optimizer method is created and implemented in Python 3.7. The i7 processor and 16GB RAM configurations are used to execute this thyroid nodule categorization. The DDTI dataset, which is used to randomised the percentage of training and testing data, is the dataset used to analyse the thyroid nodule classification. Eqs. (11) to (15) reflect the accuracy, sensitivity, specificity, precision, and error rate performances that are used to analyse the FTRL-DNN optimizer method.
Accuracy $=\frac{T P+T N}{T N+T P+F N+F P} \times 100$ (11)
Sensitivity $=\frac{T P}{T P+F N} \times 100$ (12)
Specificity $=\frac{T N}{F P+T N} \times 100$ (13)
Precision $=\frac{T P}{T P+F P} \times 100$ (14)
Error rate $=100-$ Accuracy (15)
where, $T P$ is true positive; $T N$ is true negative; $F P$ is false positive and $F N$ is false negative.
4.1 Performance analysis of FTRL-DNN method
Figure 3. Graphical representation of FTRL-DNN without feature selection
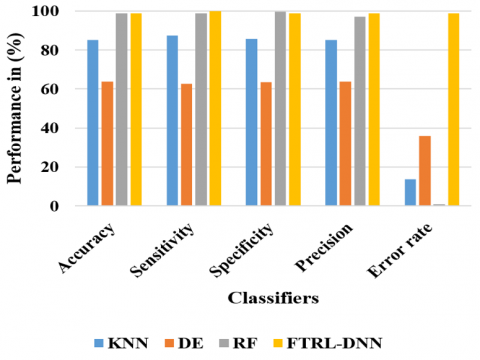
In this part, the effectiveness of the FTRL-DNN is examined using two alternative methods, namely classification with and without RREMI. K-Nearest Neighbour (KNN) and Decision Tree (DE) are two more classifiers that were utilised for the investigation. Table 1 displays the performance analysis of RF, KNN, and DE both with and without RREMI. The graphical representations of RREMI without and with feature selection are shown in Figure 3 and Figure 4, respectively. When compared to the KNN, DE, and RF, the FTRL-DNN's capacity for larger variance or bias elimination aids in the achievement of an improved classification between benign and malignant thyroid nodules. In comparison to other classifiers, it has the best 99% accuracy, 99.99% sensitivity, 99% precision, and 0.99 error rate.
Figure 4. Graphical representation of FTRL-DNN with feature selection
Figure 5. Graphical representation of FTRL-DNN for different feature selection approach
The suggested FTRL-DNN is examined using the traditional Relief method, Particle Swarm Optimisation (PSO), and Artificial Bee Colony (ABC) feature selection approaches. Table 2 and Figure 5 display the results of the performance analysis of the FTRL-DNN with PSO, ABC, Relief, and RREMI. This investigation demonstrates that FTRL-DNN outperforms PSO, ABC, and Relief in terms of performance. Due to the use of mutual information based on Renyi entropy and nearest target weight computation, the FTRL-DNN is able to reach classification accuracy of 98.94%. In comparison to other feature selection algorithms, it provides the best accuracy of 99%, best sensitivity of 99%, precision of 99%, and error rate of 1.01.
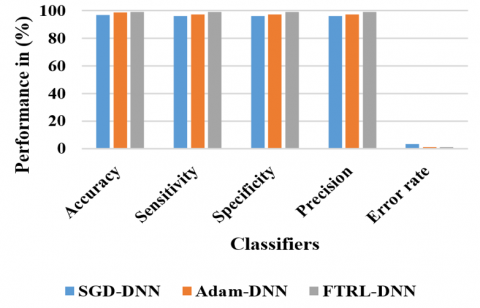
Figure 6. Graphical representation with various classifiers
The Stochastic Gradient Descent-DNN (SGD-DNN) and Adaptive Moment estimation-DNN (Adam-DNN) algorithms are used to analyse the proposed FTRL-DNN. Table 3. and Figure 6. display the performance study of the FTRL-DNN with various feature selections. This investigation demonstrates that the FTRL-DNN outperforms the SGD-DNN and Adam-DNN in terms of performance. To obtain superior classification accuracy of 98.94%, the FTRL-DNN is used. Compared to other optimisation techniques, it provides the best accuracy of 99%, best sensitivity of 99%, precision of 99%, and error rate of 1.01.
Table 1. Performance analysis of FTRL-DNN for different classifiers
|
Feature Selection |
Classifiers |
Accuracy (%) |
Sensitivity (%) |
Specificity (%) |
Precision (%) |
Error Rate (%) |
|
RREMI |
KNN |
86.15 |
87.37 |
85.70 |
85.19 |
13.85 |
|
DE |
63.94 |
62.73 |
63.49 |
63.79 |
36.06 |
|
|
RF |
98.94 |
98.88 |
99.69 |
97.14 |
1.06 |
|
|
FTRL-DNN |
99.00 |
99.99 |
99.00 |
99.00 |
99.00 |
Table 2. Performance analysis of FTRL-DNN for different feature selection approaches
|
Feature Selection Approaches |
Accuracy (%) |
Sensitivity (%) |
Specificity (%) |
Precision (%) |
Error Rate (%) |
|
PSO |
92.38 |
90.88 |
93.08 |
92.16 |
7.62 |
|
ABC |
93.71 |
92.62 |
94.99 |
91.08 |
6.29 |
|
Relief |
94.28 |
95.75 |
94.72 |
93.28 |
5.72 |
|
RREMI |
98.94 |
98.88 |
99.69 |
97.14 |
1.06 |
|
FTRL-DNN |
99.00 |
99.00 |
99.00 |
99.00 |
1.01 |
Table 3. Performance analysis of FTRL-DNN for different optimizer methods
|
Optimizer Methods |
Accuracy (%) |
Sensitivity (%) |
Specificity (%) |
Precision (%) |
Error Rate (%) |
|
SGD-DNN |
96.80 |
96.00 |
96.00 |
96.00 |
3.20 |
|
Adam-DNN |
98.61 |
97.00 |
97.00 |
97.00 |
1.06 |
|
FTRL-DNN |
99.00 |
99.00 |
99.00 |
99.00 |
1.01 |
Since thyroid nodules have irregularly shaped external surfaces and a variety of interior components, it is challenging to classify them. As a result, the RREMI algorithm-based feature selection and AlexNet and ResNet-18 based feature extraction are created for accurate detection of benign and malignant thyroid nodules. The redundant features are removed from the entire feature set in accordance with the closest target using the suggested method FTRL-DNN. The LSTM classifier then categorises thyroid nodules as benign or malignant based on the chosen features from the FTRL-DNN method. According to the findings, the FTRL-DNN outperforms the Adam-DNN and SGD-DNN in terms of performance. When compared to the RF, DE, and KNN, the accuracy of FTRL-DNN-based thyroid nodule categorization is high at 98.94%. Compared to other methodologies, it provides the best accuracy, sensitivity, precision, and error rate. Therefore, it is a better method for classifying thyroid nodules.
[1] Zhao, X., Shen, X., Wan, W., Lu, Y., Hu, S., Xiao, R., Du, X., Li, J. (2022). Automatic thyroid ultrasound image classification using feature fusion network. IEEE Access, 10: 27917-27924. https://doi.org/10.1109/ACCESS.2022.3156096
[2] Li, Y., Chen, P., Li, Z., Su, H., Yang, L., Zhong, D. (2020). Rule-based automatic diagnosis of thyroid nodules from intraoperative frozen sections using deep learning. Artificial Intelligence in Medicine, 108: 101918. https://doi.org/10.1016/j.artmed.2020.101918
[3] Peng, S., Liu, Y., Lv, W., Liu, L., Zhou, Q., Yang, H., Ren, J., Liu, G., Wang, X., Zhang, X., Du, Q., Nie, F., Huang, G., Guo, Y., Li, J., Liang, J., Hu, H., Xiao, H., Liu, Z., Lai, F., Zheng, Q., Wang, H., Li, Y., Alexander, E.K., Wang, W., Xiao, H. (2021). Deep learning-based artificial intelligence model to assist thyroid nodule diagnosis and management: A multicentre diagnostic study. The Lancet Digital Health, 3(4): e250-e259. https://doi.org/10.1016/S2589-7500(21)00041-8
[4] Hang, Y. (2021). Thyroid nodule classification in ultrasound images by fusion of conventional features and res-GAN deep features. Journal of Healthcare Engineering, 2021: 1-7. https://doi.org/10.1155/2021/9917538
[5] Ajilisa, O.A., Jagathyraj, V.P., Sabu, M.K. (2020). Computer-aided diagnosis of thyroid nodule from ultrasound images using transfer learning from deep convolutional neural network models. In 2020 Advanced Computing and Communication Technologies for High Performance Applications (ACCTHPA). IEEE, pp. 237-241. https://doi.org/10.1109/ACCTHPA49271.2020.9213210
[6] Zhao, Z., Ye, C., Hu, Y., Li, C., Li, X. (2019). Cascade and fusion of multitask convolutional neural networks for detection of thyroid nodules in contrast-enhanced CT. Computational Intelligence and Neuroscience, 2019. https://doi.org/10.1155/2019/7401235
[7] Aboudi, N., Guetari, R., Khlifa, N. (2020). Multi‐objectives optimisation of features selection for the classification of thyroid nodules in ultrasound images. IET Image Processing, 14(9): 1901-1908. https://doi.org/10.1049/iet-ipr.2019.1540
[8] Ma, L., Ma, C., Liu, Y., Wang, X. (2019). Thyroid diagnosis from SPECT images using convolutional neural network with optimization. Computational Intelligence and Neuroscience, 2019. https://doi.org/10.1155/2019/6212759
[9] Kumar, V., Webb, J., Gregory, A., Meixner, D.D., Knudsen, J.M., Callstrom, M., Fatemi, M., Alizad, A. (2020). Automated segmentation of thyroid nodule, gland, and cystic components from ultrasound images using deep learning. IEEE Access, 8: 63482-63496. https://doi.org/10.1109/ACCESS.2020.2982390
[10] Liu, T., Guo, Q., Lian, C., Ren, X., Liang, S., Yu, J., Niu, L., Sun, W., Shen, D. (2019). Automated detection and classification of thyroid nodules in ultrasound images using clinical-knowledge-guided convolutional neural networks. Medical Image Analysis, 58: 101555. https://doi.org/10.1016/j.media.2019.101555
[11] Huang, F.Q., Li, J., Jiang, L., Wang, F.X., Alolga, R.N., Wang, M.J., Min, W.J., Ma, G., Zhao, Y.J., Wang, S.L., Yu, Y., Chen, X., Zhu, D., Zhu, J., Wang, G., Xia, T., Sang, J.F., Lai, M.D., Li, P., Zhu, W., Qi, L.W. (2019). Serum‐plasma matched metabolomics for comprehensive characterization of benign thyroid nodule and papillary thyroid carcinoma. International Journal of Cancer, 144(4): 868-876. https://doi.org/10.1002/ijc.31925
[12] Al-Chalabi, H., Karthik, S., Vaidyanathan, S. (2019). Radiological-pathological correlation of the british thyroid association ultrasound classification of thyroid nodules: A real-world validation study. Clinical Radiology, 74(9): 702-711. https://doi.org/10.1016/j.crad.2019.05.026
[13] Mugasa, H., Dua, S., Koh, J.E., Hagiwara, Y., Lih, O.S., Madla, C., Kongmebhol, P., Ng, K.H., Acharya, U.R. (2020). An adaptive feature extraction model for classification of thyroid lesions in ultrasound images. Pattern Recognition Letters, 131: 463-473. https://doi.org/10.1016/j.patrec.2020.02.009
[14] Naqi, S.M., Sharif, M., Jaffar, A. (2020). Lung nodule detection and classification based on geometric fit in parametric form and deep learning. Neural Computing and Applications, 32: 4629-4647. https://doi.org/10.1007/s00521-018-3773-x
[15] Khamparia, A., Gupta, D., de Albuquerque, V.H.C., Sangaiah, A.K., Jhaveri, R.H. (2020). Internet of health things-driven deep learning system for detection and classification of cervical cells using transfer learning. The Journal of Supercomputing, 76: 8590-8608. https://doi.org/10.1007/s11227-020-03159-4
[16] Ma, J., Duan, S., Zhang, Y., Wang, J., Wang, Z., Li, R., Li, Y., Zhang, L., Ma, H. (2020). Efficient deep learning architecture for detection and recognition of thyroid nodules. Computational Intelligence and Neuroscience, 2020. https://doi.org/10.1155/2020/1242781
[17] Song, R., Zhang, L., Zhu, C., Liu, J., Yang, J., Zhang, T. (2020). Thyroid nodule ultrasound image classification through hybrid feature cropping network. IEEE Access, 8: 64064-64074. https://doi.org/10.1109/ACCESS.2020.2982767
[18] Zhang, X., Lee, V.C., Rong, J., Liu, F., Kong, H. (2022). Multi-channel convolutional neural network architectures for thyroid cancer detection. PLoS One, 17(1): e0262128. https://doi.org/10.1371/journal.pone.0262128
[19] Pedraza, L., Vargas, C., Narváez, F., Durán, O., Muñoz, E., Romero, E. (2015). An open access thyroid ultrasound image database. In 10th International Symposium on Medical Information Processing and Analysis. SPIE, 9287: 188-193. https://doi.org/10.1117/12.2073532
[20] Akbar, S.B., Thanupillai, K., Sundararaj, S. (2022). Combining the advantages of AlexNet convolutional deep neural network optimized with anopheles search algorithm based feature extraction and random forest classifier for COVID‐19 classification. Concurrency and Computation: Practice and Experience, 34(15): e6958. https://doi.org/10.1002/cpe.6958