Abdul Fadlil![]() | Imam Riadi
| Imam Riadi![]() | Izzan Julda D.E Purwadi Putra*
| Izzan Julda D.E Purwadi Putra*![]()
© 2023 IIETA. This article is published by IIETA and is licensed under the CC BY 4.0 license (http://creativecommons.org/licenses/by/4.0/).
OPEN ACCESS
Batik is a work of art from Indonesia that has many types and pattern. One of the batik producing areas is Surakarta, the famous pattern in this area are Sawat, Sementrante, and Satriomanah. The problem that arises is the difficulty of distinguishing the three existing pattern because they have a high level of similarity. Therefore, this research aims to solve these problems using NB and RF methods. As a feature extraction, a Gray Level Co-occurrence Matrix is used as a texture feature extraction. The research phase includes methods for dataset collection, preprocessing, feature extraction, and classification. These two methods, RF and NB, can be used as methods for batik fabric classification. The most accurate result obtained by the RF method was 97.91% accurate in dataset A, while the NB method was 96.66% accurate on the same dataset. According to the research results, it is found that the RF method outperforms the NB method in classifying the types of batik patterns.
classification, GLCM, Naïve Bayes, Random Forest, Surakarta Batik Pattern
Indonesia has many kinds of culture and local arts, which are well known by many other countries worldwide, including Batik. UNESCO recognized that Batik was a cultural heritage from Indonesia on October 2, 2009 [1, 2]. Several studies on the categorization of batik images based on color, type, shape, and texture quality continue to help the batik image documentation process [3]. It is difficult to distinguish the many types of batik fabric pattern because they have many unique and different pattern in each region of Indonesia. One of them is Surakarta batik, which has its characteristics, namely differences in design elements, colors, and patterns [4]. One of the fields used in vision machines in image processing techniques is the identification and examination of data in the form of moving images or still images [5, 6]. Image processing techniques can facilitate better resolution than traditional techniques [7]. Another methods such as Decision Tree, K-Nearest Neighbor, Linear Regression, Back-Propagation, Support Vector Machines, Logistic Regression, Rocchio Method, Naive Bayes (NB), Random Forest, and Neural Network, can also be used as a classification technique using image processing data [8]. Batik image recognition aims to transform and analyze image data into information. Part of image recognition includes data acquisition, image recovery, segmentation, and recognition [9]. There have been several previous studies that have examined batik fabric pattern. One of them is about combining otsu and canny methods to identify the characteristics of Surakarta batik [4]. By applying the method, the data used is 100 image data and obtain an accuracy rate of 93%.
Surya et al. [10] researched identifying batik images using the ANN-Backpropagation method and Gray Level Co-Occurrence Matrix (GLCM) feature extraction, managed to get the highest accuracy rate of 91.2% in Sogan batik. Research conducted by Zaw et al. [11] regarding brain tumor detection based on NB classification with an accuracy rate of 81.25%, successfully detected MRI images of brain tumors and predicted the parts of the brain affected by the tumor. Arsa and Susila [1] use VGG16 method in batik classification, succeeded identifying the type of batik with ±97% accuracy based on the Random Forest (RF) classifier. Bansal et al. [12] conducted image classification using VGG19 with caltech-101 image dataset using ImageNet imagery and several classification techniques, it obtained an accuracy rate of 92.05% in the NB classification and 93.73% in the RF classification.
The fundamental difference from the previous research is that it uses two classification techniques, namely NB and RF, and uses 6 feature extraction features in terms of texture and viewed from 4 angles.
Therefore, this study used texture feature extraction (GLCM) and compared two classification techniques using WEKA tools. The dataset obtained uses data augmentation techniques to enrich the image sample. The results contain the accuracy value of each classification technique. The implementation of both classification techniques achieved the highest accuracy of 97.22% in the RF method and 96.66% in the NB method. This paper contains information on the proposed approach to classifying batik pattern including introduction, methodology, results and discussion, and conclusion.
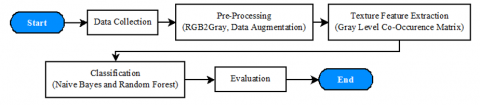
Data collection, pre-processing, feature extraction, and evaluation are all included in the methods proposed by the study. Block diagram in this research is shown in Figure 1.
Based on Figure 1, the image is modified after getting the batik image using pixel resizing, data augmentation, and conversion to grayscale from RGB. Pre-processing is followed by classification using NB and RF methods. To find out the success rate of this research, an evaluation was carried out.
Figure 1. Block diagram of batik pattern classification system
2.1 Data collection
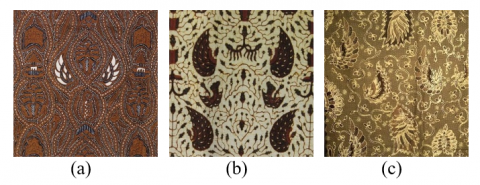
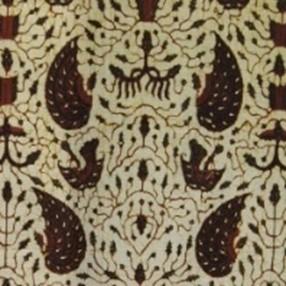
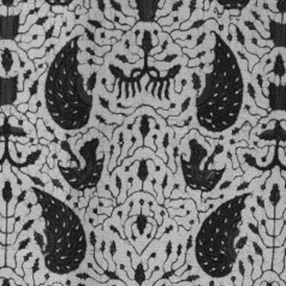
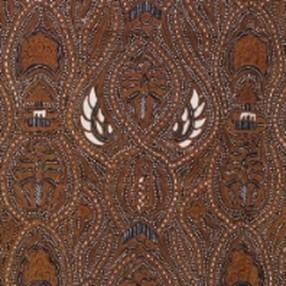
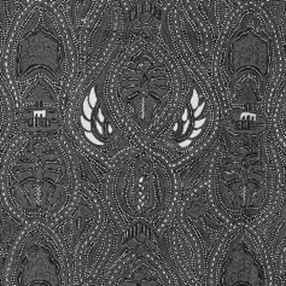
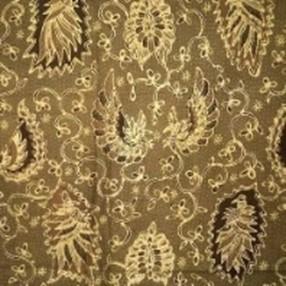
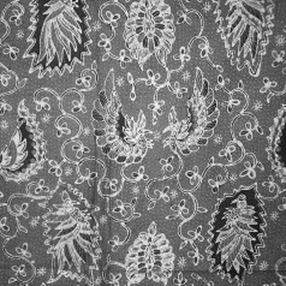
This research, data for classifying Surakarta batik fabric pattern were obtained by scraping data from the internet, especially from websites that provide special types of Surakarta batik. The limitations of the type of batik used are the typical Surakarta batik fabric pattern, namely sawat, sementrante, and satriomanah. Examples of types of batik can be seen in Figure 2.
Figure 2. Batik Types (a) Sawat, (b) Semenrante, (c) Satriomanah
In Figure 2 is a type of batik fabric pattern. The pattern was chosen because it has a fairly high level of similarity. The number of datasets is 600 images. 600 datasets were used due to limitations on collection and processing, as well as to reduced overfitting. Divided into 200 pictures for the Sawat class, 200 pictures for the Semenrante class, and 200 pictures for the Satriomanah class. The batik fabric pattern dataset is divided into training and test data with compositions of 60%:40%, 70%:30%, 80%:20%.
2.2 Pre-processing
First, the image of the type of batik fabric is grouped based on the type of pattern. Then the batik image is converted from an RGB image to a grayscale image using Eq. (1).
$Gray$$=(0.289 \mathrm{R}+0.587 \mathrm{G}+0.114 \mathrm{~B})$ (1)
In addition, data augmentation was used in this study to diversify data variations. A process called "data augmentation" involves manipulating the rotation, brightness, cropping, and reversal of images [13, 14].
2.3 Feature extraction
Feature extraction aims to identify pattern differences and differentiate class groupings during further classification [15]. Examples of feature extraction can be identified from color, shape, geometry, size, and texture [16]. To obtain feature data, this study used texture feature extraction using GLCM. The technique of extracting values from GLCM is performed using the Python programming language. The possibility of a close relationship between two pixels at a certain distance (d) and the right angle (θ) is calculated using this technique to generate statistical values of the 2nd order [15], [17-19]. In this study, the GLCM feature extraction was seen from 4 angles, namely 0°, 45°, 90°, and 135° and the 6 GLCM features used were dissimilarity (L1), correlation (L2), homogeneity (L3), contrast (L4), ASM (L5), and energy (L6) shown in Eqns. (2) to (7).
L1 measures the dissimilarity of textures in an image, and the resulting value will be large if the pattern is random and small if the pattern is uniform. Eq. (2) shows the Equation of dissimilarity.
$Dissmilarity$$=\sum_{i, j}^{\text {Levels-1 }} P_{i, j}|i-j|$ (2)
L2 is an equation for measuring linearity in pixel pairs. The correlation equation is shown in Eq. (3).
$Correlation$$=\sum_{i, j}^{\text {Levels-1 }} P_{i, j}\left[\frac{\left(i-\mu_i\right)\left(j-\mu_{j)}\right.}{\sqrt{\left(\sigma_i^2\right)\left(\sigma_j^2\right)}}\right]$ (3)
L3 is a measure of image similarity. The value is high if all pixels have the same value. The homogeneity equation is shown in Eq. (4).
$Homogenity$ $=\sum_{i, j=0}^{\text {Levels }-1} \frac{P_{i, j}}{1+(i-j)^2}$ (4)
L4 measure of the spatial frequency of the image. The contrast equation is shown in Eq. (5).
$Contrast$$=\sum_{i, j=0}^{\text {Levels-1 }} P_{i, j}(i-j)^2$ (5)
L5 or Angular Second Moment measures the uniformity of pixels in an image. The ASM equation is shown in Eq. (6).
$A S M=\sum_{i, j=0}^{\text {Levels-1 }} P_{i, j}^2$ (6)
L6 is an equation of the gray-level inequality in an image. The energy equation is shown in Eq. (7).
${Energy}=\sqrt{A S M}$ (7)
where, i is the matrix row, j is the matrix column, and P(i,j) is the general matrix element of row (i) and column (j). μi, μj is the average of the matrix's row and column elements. σi, σj are the standard deviations in the rows and columns of the matrix.
The GLCM matrix is calculated using Eqns. (2) to (7) so that it can accurately represent images with fewer parameters. Python supports all available GLCM value extraction techniques. The output of the extraction process is stored in (. CSV) format.
2.4 Classification techniques
Classification is predicting an unknown data type [20]. This study uses machine learning (ML) to classify the types of batik fabric pattern, namely NB and RF. One of the tools that provide many ML features is WEKA Environment tools. The WEKA tool is a program that provides tools for data preparation, association rule mining, grouping , classification, regression, and visualization in addition to a set of machine learning algorithms for data mining tasks [21, 22].
2.4.1 Random Forest (RF)
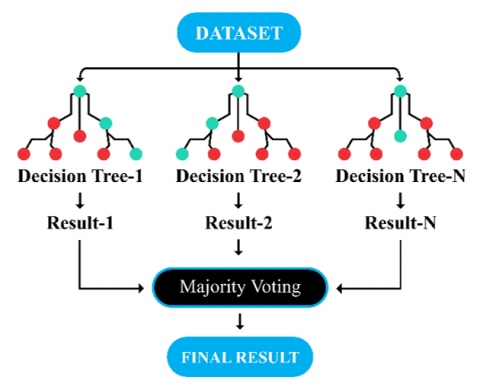
RF is one of the ML techniques, a classification of decision trees enhanced from the Classification and Regression Trees (CART) method [23]. RF is capable of handling large datasets and has large input features [24]. Picture of the RF classifier workflow as shown in Figure 3.
Figure 3. Visualization of the RF classifier
Figure 3 is a dataset that will be trained to produce several decision trees from the decision tree model. Then in each decision tree, the data that has been trained will be categorized as a label. The most votes in voting will determine the final decision on the RF algorithm.
2.4.2 Naïve Bayes (NB)
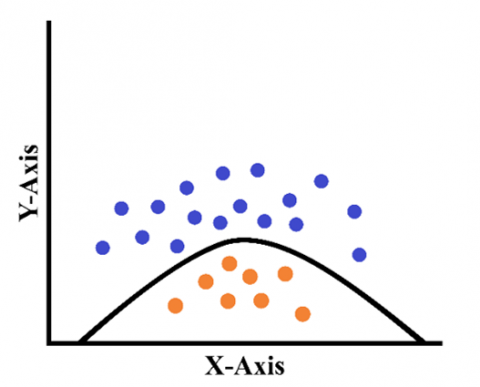
A probabilistic learning model based on the Bayes theorem, NB is one of the machine learning techniques used to predict the phenomenon of classifying several different classes [22], [25-27]. Equation for NB classifier shown in Eq. (8).
$P(K \mid L)=\frac{P(L \mid K) P(K)}{P(L)}$ (8)
P(K) represents the prior probability, which indicates the likelihood that K will occur, and P(L) is the marginal probability, which implies the likelihood that Y will occur. The probabilities of K and L were separate quantities that had no impact on one another. The posterior probability, also known as P(K|L), is the likelihood that K will occur after L has already occurred. Last, P(K|L) is identified as the likelihood probability, representing the likelihood that L will occur if K is true [28]. The theorem states that the intrinsic probability, which is calculated based on the facts currently available, is multiplied to determine the probability of an event occurring, as shown in Figure 4.
Figure 4. Graphic visualization of NB classifier
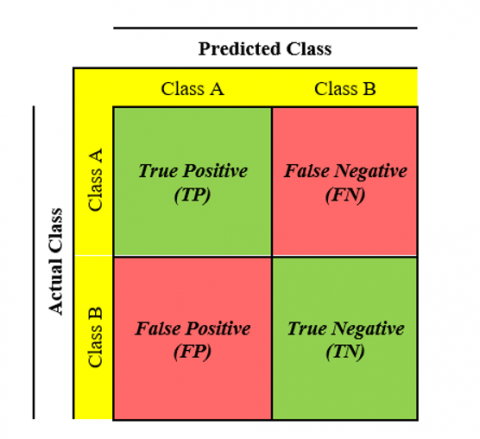
Confusion Matrix (CM), a technique used in this study to measure classification accuracy using NB and RF approaches. To evaluate the precision of the classification model, CM contains predictions and actual conditions of classification outcomes [29]. Figure 5 shows the confusion matrix.
Figure 5. Confusion matrix
This section displays the results of the proposed method, which includes pre-processing, feature extraction, and classification. Pre-processing is done using the python programming language and classification techniques are implemented using WEKA tools version 3.8.6.
3.1 Pre-processing
Batik pattern have different types. Different pattern can be used as indicators to detect different batik fabric pattern. The pre-processing results change the color image to grayscale image. Then each image is converted to 50 x 50 pixels to simplify the computation process. The following step after converting pixels is to apply the augmentation data by using rotation, zoom, swipe, flip vertical, and flip horizontal to make the data more diverse. Pre-processing steps performed with the python programming language. Table 1 is the result of the RGB image converted to grayscale.
Based on Table 1, each batik image is changed from a color image to a grayscale image. The primary function of grayscale is to speed up image classification by reducing object features from RGB images that are not needed because the color does not affect the classification of batik fabric pattern [30].
3.2 Feature extraction
GLCM feature extraction produces 24 features in each image, with six feature parameters, namely L1, L2, L3, L4, and L5. The GLCM feature generates 24 values from each angle. The results of the GLCM feature extraction at an angle of 90° are shown in Table 2.
Table 1. RGB to grayscale image
|
Type of Batik |
Color Image |
Grayscale Image |
|
Sawat |
||
|
Semenrante |
||
|
Satriomanah |
Table 2. Texture feature extraction results at an angle of 90°
|
Texture Feature Extraction Results at an Angle of 0° |
||||||
|
Dissimilarity |
Correlation |
Homogeneity |
Contrast |
ASM |
Energy |
Class |
|
45.048 |
45.60775047 |
0.047898395 |
0.055240694 |
0.094510388 |
0.068508877 |
Satriomanah |
|
51.47911111 |
52.24763705 |
0.063063819 |
0.040174667 |
0.115009638 |
0.070957903 |
Satriomanah |
|
49.67777778 |
51.40926276 |
0.058520792 |
0.090811508 |
0.09869812 |
0.040074417 |
Satriomanah |
|
45.79777778 |
46.73676749 |
0.097699314 |
0.07632575 |
0.095053963 |
0.061044649 |
Satriomanah |
|
60.14755556 |
71.09546314 |
0.015172227 |
0.010530841 |
0.211599564 |
0.00275415 |
Sawat |
|
59.26444444 |
67.80718336 |
0.04139436 |
0.113103039 |
0.249128169 |
0.104301708 |
Sawat |
|
58.552 |
65.61672968 |
0.021875788 |
0.066433226 |
0.224280763 |
0.092154813 |
Sawat |
|
62.59911111 |
66.09546314 |
0.187196081 |
0.176979542 |
0.235503639 |
0.162961042 |
Sawat |
|
41.27644444 |
41.33506616 |
0.019199326 |
0.00355137 |
0.02194828 |
0.06858046 |
Semenrante |
|
43.16222222 |
40.81758034 |
0.032989894 |
0.051611365 |
0.082826933 |
0.086246578 |
Semenrante |
|
45.04177778 |
45.58837429 |
0.080022279 |
0.050227639 |
0.138111203 |
0.081224043 |
Semenrante |
|
36.56222222 |
37.73771267 |
0.006272633 |
0.008842833 |
0.054262309 |
0.005443449 |
Semenrante |
Based on Table 2, the test was run using texture feature extraction, namely GLCM. The numerical results of each homogeneity, contrast, ASM, and energy feature in the GLCM, when viewed from a 90° angle, are displayed in each column. The GLCM method extracts the texture of batik fabric for each type of satriomanah, sawat, and semenrante class.
3.3 Classification and evaluation
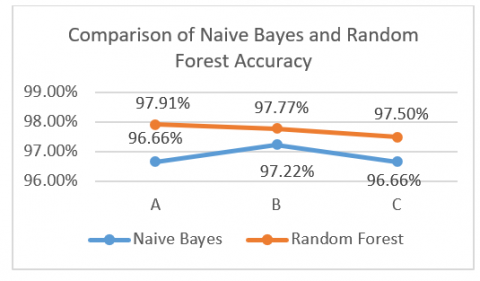
The classification technique uses two methods, NB and RF, with a data sample of 600 images from each class. Classification uses WEKA tools by dividing the dataset using a percentage split. The Percentage split used in this research was labeled A, B, and C. A is a percentage split with a dataset of 60% for training data and 40% for testing data. B is a percentage split with a dataset of 70% for training data and 30% for testing data. while C is a percentage split with a dataset of 80% for training data and 20% for testing data. The accuracy results are shown in Figure 6.
Based on Figure 6. The highest accuracy is shown in the RF classification technique with an accuracy of 97.91% in percentage split A, while the lowest accuracy is obtained in the NB classification technique with 96.66% in percentage split A and C. The confusion matrix results, according to Figure 5 with the NB method, are shown in Table 3.
Figure 6. Comparison of NB and RF accuracy chart
Table 3. Results of NB confusion matrix classification
|
Dataset Split |
Class |
Confusion Matrix |
Accuracy (%) |
Precision |
Recall |
||
|
A |
Satriomanah |
79 |
0 |
0 |
96.66 |
0.91 |
1.00 |
|
Sawat |
0 |
80 |
0 |
1.00 |
1.00 |
||
|
Semenrante |
8 |
0 |
73 |
1.00 |
0.901 |
||
|
Avg. |
|
96.66 |
96.66 |
96.66 |
|||
|
B |
Satriomanah |
60 |
0 |
0 |
97.22 |
0.92 |
1.00 |
|
Sawat |
0 |
62 |
0 |
1.00 |
1.00 |
||
|
Semenrante |
5 |
0 |
53 |
1.00 |
0.91 |
||
|
Avg. |
|
97.22 |
97.22 |
97.22 |
|||
|
C |
Satriomanah |
41 |
0 |
0 |
96.66 |
0.91 |
1.00 |
|
Sawat |
0 |
42 |
0 |
1.00 |
1.00 |
||
|
Semenrante |
4 |
0 |
33 |
1.00 |
1.00 |
||
|
Avg. |
|
96.66 |
96.66 |
96.66 |
|||
Based on Table 3, the best classification results among the distribution of datasets using a percentage split were obtained in dataset B. Accuracy, precision, and recall for this model averaged 97.22, 97.22, and 97.22 by using the equation shown in Table 5. The confusion matrix results, according to Figure 4 with the RF method, are shown in Table 4.
Table 4 shows the best classification results obtained in dataset A. He showed that the average values for accuracy, precision, and recall were 97.91, 97.91, and 97.91 by using the equation shown in Table 5.
Based on Table 5 accuracy, recall, and precision are classification evaluation metrics used to assess the performance of machine learning models.
The RF method outperforms the NB classifier method in recognizing batik pattern using the GLCM feature, according to the performance value of the classification process in data testing. This result is due to the advantages and disadvantages of both methods.
Table 4. Results of RF confusion matrix classification
|
Dataset Split |
Class |
Confusion Matrix |
Accuracy (%) |
Precision |
Recall |
||
|
A |
Satriomanah |
79 |
0 |
0 |
97.91 |
0.94 |
1.00 |
|
Sawat |
0 |
80 |
0 |
1.00 |
1.00 |
||
|
Semenrante |
5 |
0 |
76 |
1.00 |
0.94 |
||
|
Avg. |
|
97.91 |
97.91 |
97.91 |
|||
|
B |
Satriomanah |
60 |
0 |
0 |
97.77 |
0.94 |
1.00 |
|
Sawat |
0 |
62 |
0 |
1.00 |
1.00 |
||
|
Semenrante |
5 |
0 |
53 |
1.00 |
0.96 |
||
|
Avg. |
|
97.77 |
97.77 |
97.77 |
|||
|
C |
Satriomanah |
41 |
0 |
0 |
97.50 |
0.93 |
1.00 |
|
Sawat |
0 |
42 |
0 |
1.00 |
1.00 |
||
|
Semenrante |
4 |
0 |
33 |
1.00 |
0.91 |
||
|
Avg. |
|
97.50 |
97.50 |
97.50 |
|||
Table 5. The equation to calculate the effectiveness of classification
|
Equation |
Focus |
|
$Accuracy$ $=\frac{T P+T N}{T P+T N+F P+F N}$ |
Effectiveness of whole classification |
|
$Precision$ $=\frac{T P}{T P+F P}$ |
The data labels classified as match as the positive labels |
|
$Recall$ $=\frac{T P}{T P+F N}$ |
Defined as the proportion of positive cases that are accurately predicted with all other positive cases |
The study of classifying the types of batik fabric pattern using the RF and NB methods has been carried out using 600 images of batik images used as a dataset, with each type of batik having 200 data samples. Classifying the types of batik fabric pattern includes collecting batik fabric images, preprocessing, and texture feature extraction, followed by the classification process by dividing the entire dataset using the percentage split method. This research shows that these two methods can classify the types of batik fabric pattern. The RF method has the highest accuracy rate of 97.91% in dataset A, while the NB method in the same dataset has an accuracy rate of 96.66%. Based on the results of this accuracy, it is stated that the RF method is better at classifying the types of batik fabric pattern. This result is also affected because RF does not require a large number of datasets. Future research can use more variety batik datasets, another classification technique, and other data collection techniques with various environmental conditions to be compared with this paper.
[1] Arsa, D.M.S., Susila, A.A.N.H. (2019). VGG16 in batik classification based on Random Forest. In Proceedings of the 2019 International Conference on Information Management and Technology (ICIMTech 2019), Jakarta/Bali, Indonesia, pp. 295-299. https://doi.org/10.1109/ICIMTech.2019.8843844
[2] Girsang, N.D. (2021). Literature study of convolutional neural network algorithm for batik classification. Brilliance: Research in Artificial Intelligence, 1(1): 1-7. https://doi.org/10.47709/brilliance.v1i1.1069
[3] Rangkuti, A.H., Harjoko, A., Putra, A. (2021). A novel reliable approach for image batik classification that invariant with scale and rotation using MU2ECS-LBP algorithm. Procedia Computer Science, 179(2019): 863-870. https://doi.org/10.1016/j.procs.2021.01.075
[4] Kusanti, J., Suprapto, A. (2019). Combination of otsu and canny method to identify the characteristics of solo batik as Surakarta traditional batik. In Proceedings of the 2019 2nd International Conference on Computer, Informatics, Engineering, and Artificial Intelligence: Roles in Industrial Revolution 4.0 (IC2IE 2019), Banyuwangi, Indonesia, pp. 63-68. https://doi.org/10.1109/IC2IE47452.2019.8940884
[5] Azarmdel, H., Mohtasebi, S.S., Jafari, A., Rosado Muñoz, A. (2019). Developing an orientation and cutting point determination algorithm for a trout fish processing system using machine vision. Computers and Electronics in Agriculture, 162: 613-629. https://doi.org/10.1016/j.compag.2019.05.005
[6] Tian, H., Wang, T., Liu, Y., Qiao, X., Li, Y. (2020). Computer vision technology in agricultural automation —A review. Information Processing in Agriculture, 7(1): 1-19. https://doi.org/10.1016/j.inpa.2019.09.006A.
[7] Yudhana, A., Umar, R., Saputra, S. (2022). Fish freshness identification using machine learning: Performance comparison of k-NN and Naïve Bayes classifier. Journal of Computer Science and Engineering, 16(3): 153-164. https://doi.org/10.5626/JCSE.2022.16.3.153
[8] Nugroho, K., Winarno, E. (2022). Spoofing detection of fake speech using deep neural network algorithm. International Seminar on Application for Technology of Information and Communication. https://doi.org/10.1109/iSemantic55962.2022.9920401.
[9] Suteja, F.N., Hidayat, E.W., Widiyasono, N. (2020). Implementation of image enhancement algorithm for image forensics using mathlab. Journal of Online Informatics, 4(2): 79. https://doi.org/10.15575/join.v4i2.314
[10] Surya, R.A., Fadlil, A., Yudhana, A. (2019). Identification of Pekalongan batik images using backpropagation method. Journal of Physics: Conference Series, 1373(1). https://doi.org/10.1088/1742-6596/1373/1/012049
[11] Zaw, H.T., Maneerat, N., Win, K.Y. (2019). Brain tumor detection based on Naïve Bayes classification. In Proceedings of the 5th International Conference on Engineering, Applied Sciences and Technology (ICEAST 2019), Luang Prabang, Laos, pp. 1-4. https://doi.org/10.1109/ICEAST.2019.8802562
[12] Bansal, M., Kumar, M., Sachdeva, M., Mittal, A. (2021). Transfer learning for image classification using VGG19: Caltech-101 image data set. Journal of Ambient Intelligence and Humanized Computing. Advance online publication. https://doi.org/10.1007/s12652-021-03488-z
[13] Khasanah, C.U., Utami, E., Raharjo, S. (2020). Implementation of data augmentation using convolutional neural network for batik classification. 2020 8th International Conference on Cyber and IT Service Management (CITSM 2020), Luang Prabang, Laos, pp. 20-24. https://doi.org/10.1109/CITSM50537.2020.9268890
[14] Shorten, C., Khoshgoftaar, T.M. (2019). A survey on image data augmentation for deep learning. Journal of Big Data, 6(1). https://doi.org/10.1186/s40537-019-0197-0
[15] Humeau-Heurtier, A. (2019). Texture feature extraction methods: A survey. IEEE Access, 7: 8975-9000. https://doi.org/10.1109/ACCESS.2018.2890743
[16] Achievements, I.M. (2022). Classification based on machine learning methods for identification of image matching achievements. Jurnal RESTI (Rekayasa Sist. dan Teknol. Informasi), 6(2): 198-206. https://doi.org/doi.org/10.29207/resti.v6i2.3826
[17] Öztürk, Ş., Akdemir, B. (2018). Application of feature extraction and classification methods for histopathological image using GLCM, LBP, LBGLCM, GLRLM and SFTA. Procedia Computer Science, 132: 40-46. https://doi.org/10.1016/j.procs.2018.05.057
[18] Priyanka, Kumar, D. (2020). Feature extraction and selection of kidney ultrasound images using GLCM and PCA. Procedia Computer Science, 167: 1722-1731. https://doi.org/10.1016/j.procs.2020.03.382
[19] Riadi, I., Fadlil, A., Julda, I., Putra, D.E.P. (2023). Batik pattern classification using naïve bayes method based on texture feature extraction. Khazanah Informasi Jurnal Ilmu Komputer dan Informasi, 9(1): 9. https://doi.org/https://doi.org/10.23917/khif.v9i1.21207
[20] Fadlil, A., Prayogi, D. (2022). Face recognition using machine learning algorithm based on raspberry Pi 4b. International Journal of Artificial Intelligence Research, ISSN(1): 2579-7298. https://doi.org/10.29099/ijair.v7i1.321
[21] Geyik, B., Erensoy, K., Kocyigit, E. (2021). Detection of phishing websites from URLs by using classification techniques on WEKA. In Proceedings of the 6th International Conference on Inventive Computation Technologies (ICICT 2021), Coimbatore, India, pp. 120-125. IEEE. https://doi.org/10.1109/ICICT50816.2021.9358642
[22] Alpan, K., İlgi, G.S. (2020). Classification of diabetes dataset with data mining techniques by using WEKA approach. International Symposium on Multidisciplinary Studies and Innovations in Technology. https://doi.org/10.1109/ISMSIT50672.2020.9254720
[23] Yadav, D.C., Pal, S. (2020). Prediction of thyroid disease using decision tree ensemble method. Human-Intelligent Systems Integration, 2(1-4): 89-95. https://doi.org/10.1007/s42454-020-00006-y
[24] Shrivas, A.K., Dewangan, A.K., Ghosh, S. M. (2021). Robust text classifier for classification of spam e-mail documents with feature selection technique. Ingénierie des Systèmes d’Information, 26(5): 437-444. https://doi.org/10.18280/isi.260502
[25] Yudhana, A., Riadi, I., Ridho, F. (2018). DDoS classification using neural network and Naïve Bayes methods for network forensics. International Journal of Advanced Computer Science and Applications, 9(11): 177-183. https://doi.org/10.14569/ijacsa.2018.091125
[26] Patil, B.M., Burkpalli, V. (2021). A perspective view of cotton leaf image classification using machine learning algorithms using WEKA. Advances in Human-Computer Interaction, 2021: 9367778. https://doi.org/10.1155/2021/9367778
[27] Yudhana, A., Sulistyo, D., Mufandi, I. (2021). GIS-based and Naïve Bayes for nitrogen soil mapping in Lendah, Indonesia. Sensors and Bio-Sensing Research, 33: 100435. https://doi.org/10.1016/j.sbsr.2021.100435
[28] Villavicencio, C.N., Macrohon, J.J.E., Inbaraj, X.A., Jeng, J.H., Hsieh, J.G. (2021). Covid-19 prediction applying supervised machine learning algorithms with comparative analysis using WEKA. Algorithms, 14(7). https://doi.org/10.3390/a14070201
[29] Taheri-Garavand, A., Fatahi, S., Banan, A., Makino, Y. (2019). Real-time nondestructive monitoring of common carp fish freshness using robust vision-based intelligent modeling approaches. Computers and Electronics in Agriculture, 159: 16-27. https://doi.org/10.1016/j.compag.2019.02.023
[30] Abdulrahman, A., Varol, S. (2020). A review of image segmentation using MATLAB environment. 8th international symposium on digital forensics and security (ISDFS 2020), Beirut, Lebanon, pp. 8-12. https://doi.org/10.1109/ISDFS49300.2020.9116191