Hiba Mahdi Falhi![]() | Hussain Kareem Khleaf*
| Hussain Kareem Khleaf*![]()
© 2023 IIETA. This article is published by IIETA and is licensed under the CC BY 4.0 license (http://creativecommons.org/licenses/by/4.0/).
OPEN ACCESS
Electrocardiogram (ECG) monitoring is now becoming part of everyday health life. Through ECG characteristics such as patient’s heartbeats, heart conditions, and heart disease can be analyzed. This paper presents the design and implementation of a system for analyzing and filtering the ECG signal and allowing its remote monitoring based on the use of deep learning algorithms, this algorithm is Convolution Neural Network (CNN), where the network was built in MATLAB and training using the dataset (PhysioNet 2017). when, the ESP NODE MCU microcontroller was used with the AD8232 sensor in designing a system that records the ECG signal from the patient in real time and filtering it using FIR filter that will be designed in MATLAB, then transmits it to the network that has been trained to be classified as whether it is normal or abnormal. Then, this result is transmitted locally to be displayed in monitoring side, the results showed high accuracy in classifying the signal and in filtering different Noise, as well as its speed in responding to a change in the condition of the signal and giving a warning to the observer. This contributes to speeding up the detection of the deterioration of the patient's condition in a timely manner.
CNN, ECG, ESP NODE MCU, AD8232, FIR filter
More people die every year due to cardiovascular disease according to world health organization and one of the diseases associated with the human heart is arrhythmia [1]. The electrocardiogram (ECG) is an important diagnostic tool in cardiology for determining and analysis of cardiac conditions of patients most especially life-threatening heart diseases and abnormalities such as arrhythmia [2]. Arrhythmia is the irregularity and abnormality of heartbeat rhythm [3, 4]. It happens when the heart does not pump blood effectively throughout the body [5]. However, Cardiology specialists, sometimes fail to distinguish between normal and arrhythmic beats due to human nature and the muscular structure of the heart [6]. Therefore, exploration and innovation in this area of biotechnology has shown that there is an easier way to detect arrhythmias, In recent years, many automated analysis and interpretation of arrhythmias in ECG have been proposed but a machine learning subset that learns based on deep learning using Convolution Neural Network technique is increasingly being used in this area and it has proven to be an efficient method for the analysis of ECG signal data [7]. However, deep learning especially Convolutional Neural Network has been successfully used for the detection and classification of ECG signal [8, 9], which means it does not require pre-processing before network training except normalizing the dataset [10].
In this paper, ECG sensor and microcontroller are used to design and implement the smart ECG Monitoring System. The proposed system sensed the patient’s ECG through 3 lead electrode system via ECG sensor which amplifies minor and small bio-signals to the microcontroller which processes them, The ESP NODE MCU and AD8232 sensor are used to record the ECG signal from the patient. The AD8232 is an operational amplifier to obtain clear signals [11, 12]. This signal is loaded with many noises such as Power line interference, Baseline wander results from the patient inhaling and compels a baseline shifting of the ECG signals, Electrode contact noise that results from a deficiency in the contiguity between the electrode and skin, Electrode motion artifacts that result from variations in the electrode-skin impedance with electrode motion [13]. Therefore, in order to overcome this noise, we presented in this paper a filter design that overcomes most of it to obtain a signal that can be classified in the classification stage. The dataset selected from Physionet2017 [14] database used to train the convolutional neural network that will be built it by four layers: convolution layer, pooling layer, flatting layer and soft max layer [15]. Finally, the result of ECG classification is normal or abnormal will be display on GUI interface that will be design in MATLAB.
The main aims of the proposed system are:
Many research on the axis of classification and analysis of the ECG signal, where the paper [15] presented a classification system based on CNN that classifies the ECG signal into five classifications and adopted PhysioNet MIT-BIH data set, and the results showed an accuracy rate of 93.4%. While [12, 16] presented a monitoring system for the ECG signal based on the Internet of Things, where the reading of the signal is recorded using the AD8232 and Arduino Uno, and this data is sent to the phone application, which allows the patient to be monitored periodically from a distance. Also, for researchers in [17, 18] integrated systems have been designed to monitor the patient remotely using medical sensors and microcontrollers whose results can be adopted in the medical application. The paper [19] presented an evaluation study for the classification of the ECG signal using different algorithms, namely, CNN, SVM, LSTM, based on a data set. The paper discussed a good review of all these algorithms and their results. Zahid et al. [20] proposed an approach to classify the ECG signal using 1D self-on through morphological information and timing of heartbeats using the MIT-BIH database, and the research achieved very accurate results. The study [21] trained deep convolutional neural networks to identify different numbers of heart diseases by splitting the signal into parts of 5 seconds and using dwt to remove noise, and the results achieved an improvement in the performance of the convolutional neural network model and an improvement in the performance of signal classification. The research [22] builds convolutional neural networks based on the features of time and frequency to classify the ECG into a normal state or 7 abnormal states, the first part of the research regulates frequencies, reduces noise, and cuts the signal, while the other part is designing a 1D-CNN model consisting of 12 layers, and the experimental results showed excellent performance and accuracy Rating.
Table 1 shows the summary evaluation of the many techniques used by researchers in the design and implementation of the ECG monitoring systems concerning the most significant design stages.
Table 1. Summary of the previous works
|
Author |
Microcontroller |
Classification |
Transmission |
Display data |
Discusion |
|
[12] |
Arduino Uno |
--- |
Internet |
phone app |
The data is not classified |
|
[23] |
NODE MCU |
Fuzzy |
Wi-Fi |
IoT-Blynk platform |
adoption of the Internet only |
|
[24] |
Arduino Mega |
--- |
Wi-Fi |
Thing Speak |
The platform doesn’t free |
|
[25] |
Raspberry |
CNN |
LoRa |
---- |
The signal is not displayed |
|
[26] |
ESP32 |
--- |
Bluetooth |
LCD |
limited range to transmitted data |
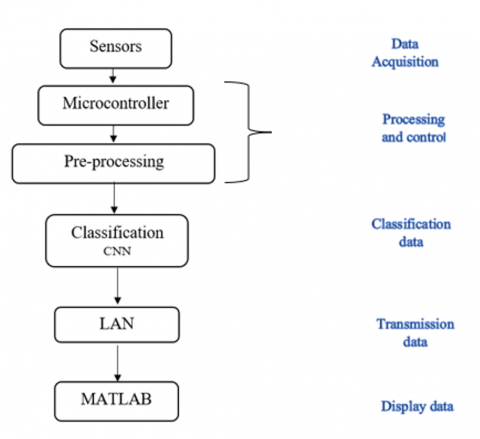
The proposed system for ECG monitoring system consists of several stages to collect vital information from the patient and that requires medical knowledge and the mechanism of action of the sensors to obtain accurate and actual data that can be relied upon, and then choosing the microcontroller that meets the purpose of the system to be able to analyze and classify this data. In order to display these signals as soon as possible, Figure 1 shows the main planned framework of this paper. The planning framework involves five main stages: data acquisition stage, processing and control stage, classification stage, transmission data stage and display data stage.
Figure 1. The main stages of the proposed system
3.1 Data acquisition
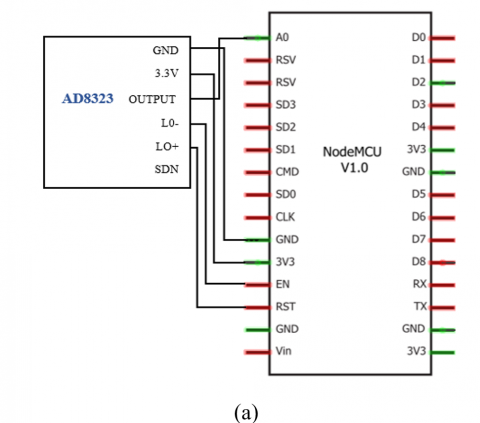
In part concerned with data collection, special sensor used to measure the vital information of ECG signal, this signal is very accurate and subject to noise. Therefore, to obtain a signal with the highest accuracy, the AD8323 sensor is connected in conditions that reduce noise by keeping it away from electrical waves to avoid interference and ensuring that the sensor is fed, which should not exceed 3.3v [27]. To connect this sensor with the microcontroller, connect the GND pin of the sensor to the ground pin in ESP NODE MCU and the power pin to 3.3v; OUTPUT is the data output pin connected to the A0 pin in the microcontroller, L0-, LO+ are comparator out pins connected to RST and EN pins. the SDN is the shutdown pin of the sensor that is not used; the connection shown in Figure 2.
3.2 Processing and control data
The processing techniques is the second stage in the work, after the data acquisition, a pre-processing is carried out to come out in a (more stable, accurate, and fastest time with the least signal losses), The recorded ECG signals often suffer from several types of noises, affecting the time- and frequency-domain visualization. The most common filters used in Digital Signal Processing (DSP) Finite Impulse Response (FIR), FIR bandpass filters are more suitable to achieve a linear phase and lower sensitivity to filter coefficient quantization errors [28, 29]. There are many design methods for the FIR filters, the method that used in this paper done by write the code in the MATLAB using the function “FIR1”. The following steps show the FIR Window for Bandpass filter designed:
• Step 1: Set the Sampling Frequency equal to 200Hz
• Step 2: Set the suitable FIR Order equal to 256
• Step 3: Set First and Second Cutoff Frequency 1-40 Hz
• Step 4: Enter the Sampling Flag (scale)
• Step 5: Create the window vector for the design algorithm.
Figure 2. Connecting the ECG sensor (a) Schematic diagram (b) Experimental setup
3.3 Classification data
The classification stage was acting a significant part in a biomedical diagnosis, through which a well-organized, systematic classification method is identified that supports an accurate assessment of a person's health. The convolution neural network (CNN) is one of a deep learning algorithm. CNNs are more often utilized for classification and computer vision tasks. Before building the network, the dataset is prepared, which will be trained on the network, here a data was used that exists via the Internet, which is the Physio-Net 2017.
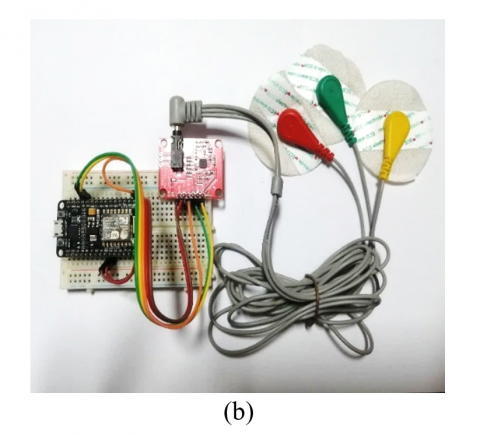
Figure 3. Data profile for the training set
This data set was recorded for different cases of people, and for different periods of time. The cases are normal case that were recorded for healthy people, the AF case is the most abnormal diagnosis of ECG, and other rhythm for other unstable conditions and signals were recorded in case the noise affected the ECG wave. Figure 3 shows the size of the data set for each type of recording.
Figure 4 shows the shape of the signals for each type in the data set.
Figure 4. Sorts of the ECG waveforms
The data set is ready to be introduced into the network that will be built. Convolutional networks can learn signal features over time steps of sequence data. uses the Convolutional layer, as it looks at the sequence and searches for the desired patterns. The network is made up of four layers, convolution layer, Pooling layer, fully connected layer and SoftMax layer. The first 2 layers are in charge of features extraction, while the (fully connected) is responsible for the classification. the output of the soft max layer is vector with two classes, N and AFib.
Used Eq. (1) to calculate the output size of the convolution layer:
$\gamma=\frac{w-k+2 p}{s}+1$ (1)
when,
w =Input size, k =Filter size, s =Stride, p =Padding
the dimension of output result after a pooling layer is calculate by Eq. (2):
$d=\frac{n_h-k+1}{s} * \frac{n_w-k+1}{s} * n_c$ (2)
$n_h$ =height of feature map
$n_w$ =width of feature map
$n_c$ =number of channels in the feature map
Eq. (3) defined the output of the fully connected layer:
$y_{i k}=f \sum_{i=1}^n w_{j k} x_i+w_{j 0}$ (3)
when, w =weights matrix, xi= the input vector, w0= the bias term.
The standard SoftMax function is defined by the Eq. (4): KN.
$\sigma(z) i=\frac{e^{z i}}{\sum_{j=1}^k e^{z j}}$ (4)
Z=input a vector
k=real numbers
Figure 5 shows the structural design of CNN which is architecture for the task of classification:
Figure 5. The structural design of CNN
These layers built by determining the size and number of filters, the filter size will be used is nine and number of filters is 16 doubled for the subsequent convolution layers. These numbers were adopted after the try and error. The command instructs the 4-layer Convolution network to mapping the input set into 128 features. The output of the pooling layer reduces the output features by fifty percent, finally the output of the soft max layer is vector with two classes. N represents the normal ECG signal and AFib which represent abnormal ECG signal.
To training the classifier, Set the Epochs to 20 to allow the network to make 20 passes through the training data. And Mini Batch Size of 220 and (Initial Learn Rate) of 0.001 helps speed up the training process. Figure 6 shows network training:
Figure 6. Training of CNN for fysionet2017 dataset
3.4 Transmission data
LAN (Local Area Network) is basically a Data Communication Network. In this type of Network, data travels over Ethernet inside protocol units called frames. Like any other Networks, Ethernet LAN uses Ethernet cables to connect the devices in a network. The coverage area is less than 10 kms. Higher level network protocols like Internet Protocol (IP) use Ethernet as their transmission medium, Determine the network's IP address range for the function of IP address assignment. which may be accomplished by opening Command Prompt on Windows and typing "ipconfig" in the command line. which is the default output of the Windows "ipconfig" command. Here, the IPv4 Address is 192.168.0.11, so the microcontroller can select any address between 192.168.0.2 and 192.168.0.254 that is not 192.168.0.11. Thus, choose the address 192.168.0.16, we will appoint to write the code, the steps of the code are:
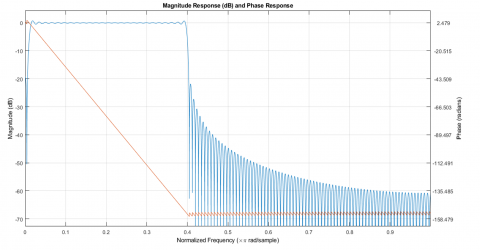
The pre-processing stage included filtering the ECG signal as the most important step to obtain an accurate and stable signal that can be classified with high accuracy using a FIR filter. The figures below show the Magnitude and Phase response of the filter and an example filtering of a noisy ECG signal. This filter highly attenuates the lower cut-off frequency as shown in the Figure 7, and the frequencies below 1 Hz have the lowest gain. No baseline wandering can be observed in the plots in the Figure 8, confirming that the baseline wanders frequencies are totally attenuated. As a result, these make 256 order filter is excellent.
Figure 7. Magnitude and Phase response plot
Figure 8. Filtered and denoised plot
The results of this filter were able to process the signal from the noise generated by Power line interference and the Baseline wander.
The result of network training and education reaching a sorting accuracy above 90% which is a very satisfactory result for the system. Also, overfitting appeared around 6%, which is also relatively good for a network.
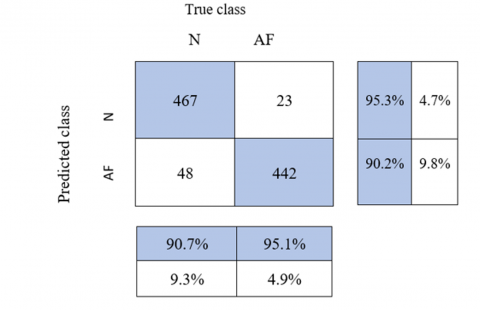
We make a test for the trained network by using the special part of the dataset, which was divided into 80% for training and 20% for test, and the results of the test also showed a high accuracy of 92.76% according to performance metrics that shown in Figure 9 and obtained as following:
accuracy $=\frac{\mathrm{TP}+\mathrm{TN}}{\mathrm{FP}+\mathrm{FN}+\mathrm{TP}+\mathrm{TN}}=92.76 \%$ (5)
when,
Figure 9. confusion matrices to the testing classification performance
Sensitivity $=\frac{\mathrm{TP}}{\mathrm{TP}+\mathrm{EN}}=95.1 \%$ (6)
Specificity $=\frac{\mathrm{TN}}{\mathrm{FP}+\mathrm{TN}}=90.7 \%$ (7)
Precision $=\frac{\mathrm{TP}}{\text { TP }+\mathrm{FP}}=90.2 \%$ (8)
Negative Predictive Value:
$N P V=\frac{\mathrm{TN}}{\mathrm{TN}+\mathrm{FN}}=95.3 \%$ (9)
False Positive Rate $=\frac{\mathrm{FP}}{\text { FP }+\mathrm{TN}}=9.3 \%$ (10)
False Discovery Rate $=\frac{\mathrm{FP}}{\mathrm{TP}+\mathrm{FP}}=9.8 \%$ (11)
False Negative Rate $=\frac{\mathrm{FN}}{\mathrm{TP}+\mathrm{EN}}=4.9 \%$ (12)
False Discovery Rate $=\frac{\mathrm{FN}}{\mathrm{FN}+\mathrm{TN}}=4.7 \%$ (13)
$F 1$ Score $=\frac{2 \mathrm{TP}}{2 \mathrm{TP}+\mathrm{FP}+\mathrm{EN}}=92.57 \%$ (14)
This makes the network ready to receive the ECG signal in real time and classify it into normal and abnormal called AFib. And send the classification result via LAN as we explained in the previous section to be displayed in GUI interface.
Added signal filtration and the adoption of a large dataset that made the network training accurate in the classification of the result, as well as testing the delay time of the system that does not exceed 15 seconds made the performance of the system superior.
Figure 10 shows the reading of the ECG signal from the data set, and the signal was normal, according to the approved data base classification. This is considered as an experiment for the system where a button has been inserted that downloads an ECG signal from the data base after choosing the number of this signal. The classification result appears below the ECG signal plot on the right of the display interface with a clear result that is easy to understand directly by the controller, even if it is not competent.
Figure 10. Reading of the ECG signal from the data base
The ECG signal represents the voltages, which are about 1 volt or 1000 mV relative to the time that is in seconds, it is designed to read a signal every second, this gives the system a high response speed and actual monitoring that contributes to detecting the deterioration in the moment in order to intervene in time.
The observer was also enabled to control the signal display time between 3 seconds to a minute to be aware of the patient's condition during that period and not only in the actual moment. To the left of the display interface, a pop-up window has been inserted to choose the port on which the microcontroller has been linked, which helps the system to work for more than one patient, with a button to update the system. Below it is a selector button for the baud rate that has been worked with.
When choosing the port and press the connect button, the interface will be linked in the MATLAB program to read the data from the microcontroller in the IDE program and filter and classify the signal, then by clicking on the plot button, this signal is drawn in real time on the interface, the way the proposed system works gives great ease in dealing with it by the observer.
Now connected the sensor with healthy person to show the performance of the classifier and filter in real time. This result is shown in Figure 11:
Figure 11. Result on MATLAB interface for healthy person
The result was reviewed by a specialist doctor where the classification showed an identical result and the signal is clear to read with delay in time was not effect. Figure 12 was taken for a healthy person while the ECG signal was taken from the sensor by connecting the electrodes to a place other than Correct.
Figure 12. Result on MATLAB interface without connect ECG sensor correctly
The classification of the ECG signal depends on the number of features include the heart beats relative to the time and the amplitude of the QRS signal, taking into account the patient's age and sex.
This is identical to the classification of the data base used. It is possible to rely on the results of research to develop the system to be able to diagnose heart disease as a future work.
The paper introduces the design and implementation of a highly efficient and low-cost intelligent system for remote ECG signal monitoring. Where the system achieved an accuracy of 92.76%, and the work was compared with previous research and the study showed the superior performance of the system. In this work, GUI application has been proposed that can receive ECG signals from the acquisition device using LAN after detect QRS complexes, and filter the signal using FIR bandpass filter, then classify it using CNN to normal or abnormal result and plot the real-time ECG signal. This system proposes an effective heart attack detection system that helps to reduce deaths caused by heart attacks as the main cause of deaths from heart attacks is due to delay in proper treatment. this can be avoided as with the ECG report, the system will notify the doctor.
Further expansion of this theory may include the suggestions future works such as the possibility of diagnosing heart disease, the possibility of sending data over the Internet to include a wider range and make the system decide on the patient's condition as well as alarm in case the condition deteriorates.
|
y |
output size of the convolution layer |
|
w |
Input size |
|
k |
Filter size |
|
s |
Stride |
|
P |
Padding |
|
d |
dimension of output result after a pooling layer |
|
nh |
height of feature map |
|
nw |
width of feature map |
|
nc |
number of channels in the feature map |
|
yik |
output of the fully connected layer |
|
xi |
input vector |
|
W0 |
the bias term |
|
z |
input a vector |
|
Greek symbols |
|
|
$\sigma$ |
standard SoftMax function |
[1] https://www.who.int/healthtopics/cardiovascular-diseases/#tab=tab_1.
[2] Berkaya, S.K., Uysal, A.K., Gunal, E.S., Ergin, S., Gunal, S., Gulmezoglu, M.B. (2018). A survey on ECG analysis. Biomedical Signal Processing and Control, 43: 216-235. https://doi.org/10.1016/j.bspc.2018.03.003
[3] Elhaj, F.A., Salim, N., Harris, A.R., Swee, T.T., Ahmed, T. (2016). Arrhythmia recognition and classification using combined linear and nonlinear features of ECG signals. Computer methods and programs in biomedicine, 127: 52-63. https://doi.org/10.1016/j.cmpb.2015.12.024
[4] Madan, P., Singh, V., Singh, D.P., Diwakar, M., Pant, B., Kishor, A. (2022). A hybrid deep learning approach for ECG-based arrhythmia classification. Bioengineering, 9(4): 152. https://doi.org/10.3390/bioengineering9040152
[5] Ullah, A., Rehman, S.U., Tu, S., Mehmood, R.M., Ehatisham-Ul-Haq, M. (2021). A hybrid deep CNN model for abnormal arrhythmia detection based on cardiac ECG signal. Sensors, 21(3): 951. https://doi.org/10.3390/s21030951
[6] Teijeiro, T., García, C.A., Castro, D., Félix, P. (2017). Arrhythmia classification from the abductive interpretation of short single-lead ECG records. In 2017 Computing in cardiology (CINC), pp. 1-4. https://doi.org/10.22489/CinC.2017.166-054
[7] Haroon, M.A. (2020). ECG arrhythmia classification Using deep convolution neural networks in transfer learning. Metropolia University of Applied Sciences, 47.
[8] Mathunjwa, B.M., Lin, Y.T., Lin, C.H., Abbod, M.F., Sadrawi, M., Shieh, J.S. (2022). ECG recurrence plot-based arrhythmia classification using two-dimensional deep residual CNN features. Sensors, 22(4): 1660. https://doi.org/10.3390/s22041660
[9] Aljumah, A. (2021). IoT-based intrusion detection system using convolution neural networks. PeerJ Computer Science, 7: e721. https://doi.org/10.7717/peerj-cs.721
[10] Acharya, U.R., Fujita, H., Oh, S.L., Hagiwara, Y., Tan, J.H., Adam, M. (2017). Application of deep convolutional neural network for automated detection of myocardial infarction using ECG signals. Information Sciences, 415: 190-198. https://doi.org/10.1016/j.ins.2017.06.027
[11] Rahman, M.M., Rimon, M.A.H., Hoque, M.A., Sammir, M.R. (2019). Affordable smart ecg monitoring using arduino & bluetooth module. In 2019 1st International Conference on Advances in Science, Engineering and Robotics Technology (ICASERT), pp. 1-4. Dhaka, Bangladesh. https://doi.org/10.1109/ICASERT.2019.8934498
[12] Meraj, M., Singh, S.P., Johri, P. (2020). Smart health care monitoring system based on iot framework using wearable devices: Novel approach. International Journal of Electrical Engineering and Technology, 2020: 166-177. https://doi.org/10.34218/IJEET.11.5.2020.020
[13] Hampton, J., Hampton, J. (2019). The ECG made easy e-book. Elsevier Health Sciences.
[14] Clifford, G.D., Liu, C., Moody, B., Li-wei, H.L., Silva, I., Li, Q., Mark, R.G. (2017). C recording: The PhysioNet/computing in cardiology challenge 2017. In 2017 Computing in Cardiology (CinC), pp. 1-4. Rennes, France. https://doi.org/10.22489/CinC.2017.065-469
[15] Kachuee, M., Fazeli, S., Sarrafzadeh, M. (2018). ECG heartbeat classification: A deep transferable representation. In 2018 IEEE international conference on healthcare informatics (ICHI), pp. 443-444. New York, NY, USA. https://doi.org/10.1109/ICHI.2018.00092
[16] Senthamilarasi, C., Rani, J.J., Vidhya, B., Aritha, H. (2018). A smart patient health monitoring system using IoT. International Journal of Pure and Applied Mathematics, 119(16): 59-70.
[17] Uddin, M.S., Alam, J.B., Banu, S. (2017). Real time patient monitoring system based on Internet of Things. In 2017 4th International conference on Advances in Electrical Engineering (ICAEE), pp. 516-521. Dhaka, Bangladesh. https://doi.org/10.1109/ICAEE.2017.8255410
[18] Marathe, S., Zeeshan, D., Thomas, T., Vidhya, S. (2019). A wireless patient monitoring system using integrated ecg module, pulse oximeter, blood pressure and temperature sensor. In 2019 International Conference on Vision Towards Emerging Trends in Communication and Networking (ViTECoN), pp. 1-4. Vellore, India. https://doi.org/10.1109/ViTECoN.2019.8899541
[19] Ali, O.M.A., Kareem, S.W., Mohammed, A.S. (2022). Evaluation of electrocardiogram signals classification using CNN, SVM, and LSTM algorithm: A review. In 2022 8th International Engineering Conference on Sustainable Technology and Development (IEC), pp. 185-191. Erbil, Iraq. https://doi.org/10.1109/IEC54822.2022.9807511
[20] Zahid, M.U., Kiranyaz, S., Gabbouj, M. (2022). Global ECG classification by self-operational neural Networks with feature injection. IEEE Transactions on Biomedical Engineering, 70(1): 205-215. https://doi.org/10.1109/TBME.2022.3187874
[21] Li, Y., Qian, R., Li, K. (2022). Inter-patient arrhythmia classification with improved deep residual convolutional neural network. Computer Methods and Programs in Biomedicine, 214: 106582. https://doi.org/10.1016/j.cmpb.2021.106582
[22] Zhang, Y., Yi, J., Chen, A., Cheng, L. (2023). Cardiac arrhythmia classification by time–frequency features inputted to the designed convolutional neural networks. Biomedical Signal Processing and Control, 79: 104224. https://doi.org/10.1016/j.bspc.2022.104224
[23] Rahman, M.Z., Akbar, M.A., Leiva, V., Tahir, A., Riaz, M.T., Martin-Barreiro, C. (2023). An intelligent health monitoring and diagnosis system based on the internet of things and fuzzy logic for cardiac arrhythmia COVID-19 patients. Computers in Biology and Medicine, 154: 106583. https://doi.org/10.1016/j.compbiomed.2023.106583
[24] Patil, V., Thakur, S.S., Kshirsagar, V. (2018). Health monitoring system using internet of things. In 2018 Second International Conference on Intelligent Computing and Control Systems (ICICCS), pp. 1523-1525. Madurai, India. https://doi.org/10.1109/ICCONS.2018.8662915
[25] Rincon, J.A., Guerra-Ojeda, S., Carrascosa, C., Julian, V. (2020). An IoT and fog computing-based monitoring system for cardiovascular patients with automatic ECG classification using deep neural networks. Sensors, 20(24): 7353. https://doi.org/10.3390/s20247353
[26] Sangeethalakshmi, K., Preethi, U., Pavithra, S. (2021). Patient health monitoring system using IoT. Materials Today: Proceedings, 80: 2228-2231. https://doi.org/10.1016/j.matpr.2021.06.188
[27] AD8232, D.S. (2013). Single-lead, heart rate monitor front end. Analog Devices, 2020. https://www.farnell.com/datasheets/2250557.pdf.
[28] Litwin, L.R., Endres, T.J., Hulyalkar, S.N., Zoltowski, M.D. (1999). The effects of finite bit precision for a VLSI implementation of the constant modulus algorithm. In 1999 IEEE International Conference on Acoustics, Speech, and Signal Processing. Proceedings. ICASSP99 (Cat. No. 99CH36258), 4: 2013-2016. Phoenix, AZ, USA. https://doi.org/10.1109/ICASSP.1999.758323
[29] Nachiar, C.C., Ambika, N., Moulika, R., Poovendran, R. (2020). Design of cost-effective wearable sensors with integrated health monitoring system. In 2020 Fourth International Conference on I-SMAC (IoT in Social, Mobile, Analytics and Cloud)(I-SMAC), pp. 1289-1292. Palladam, India. https://doi.org/10.1109/I-SMAC49090.2020.9243462