Seethiraju L.V.V.D. Sarma*![]() | Dorai Venkata Sekhar
| Dorai Venkata Sekhar![]() | Gudipati Murali
| Gudipati Murali![]()
© 2023 IIETA. This article is published by IIETA and is licensed under the CC BY 4.0 license (http://creativecommons.org/licenses/by/4.0/).
OPEN ACCESS
Forecasting and pattern recognition are increasingly important in unpredictable of the stock market. No system can consistently deliver correct predictions; complex machine learning approaches are required. Many research initiatives from numerous disciplines have been carried out to address the difficulties of stock market forecasting. In order to predict stock values, a significant amount of machine learning research has been conducted. Many machine learning techniques have been applied to this form of forecasting, and the results were satisfactory. In this study, we'll utilize web scraping to get all the actual data from the National Stock Exchange (NSE) and Long Short Term Memory (LSTM) Networks with prior data mining techniques to try and forecast the value of the stock market on a certain day. The results of this study show the potential of LSTM Networks for examining historical stock price data and obtaining useful guidance through trend forecasting with the appropriate economic parameters. To determine if a company's stock price is heading upward or lower, should also gather all the most recent commentary from the pertinent websites and apply noise reduction, a classifier, and an algorithm to analyze the sentiment polarity. Using this method, the proposed system represents the current condition of specific stock information.
stock market, neural networks, sentiment analysis, forecasting
Several decades earlier, share market estimating has become one of the most intensively studied topics. However, due to its extreme volatility and complexity, anticipating emerging outcomes is quite challenging [1]. The stock market is also important to a country's financial system. India's economy is significantly impacted by the share market despite becoming a developing nation [2]. NSE reports that in 2015, the market capitalization of NSE-listed businesses exceeded $40 billion. The stock market is specifically correlated to a state's financial operations [3]. Accurate forecasting may optimize investment returns while also advising the political structure to prepare for possible financial recessions. To evaluate the share market's characteristics, various analytical and macroeconomic methodologies are used [4]. All of these processes pertain to different sequences and pieces of data that people can notice. It is a difficult task to predict the price because the stock market is changing. We examine LSTM Neural Networks, a type of recurrent neural network, in our research [5]. By utilizing various values for every memory to determine the forecast, LSTM is capable of resolving the issue of differentiating between current and historical information [6]. Predict LSTM should become able to remember brief patterns better than other Recurrent Neural Networks (RNN).
As a source of details for our system, we draw on historical data from the NSE (NSE). The system will be trained, evaluated, and try to predict whether a significant portion of the price will increase or decrease in the future after being provided with the dataset [7].
In addition, there are additional variables that affect stock price movement, and the other one is how people feel about the information. Sentiment analysis moved to the top of the list of study topics of interest as a result of rising internet usage and the prevalence of news providers. It is simple to show the character and history of the stock with the aid of sentiment research analysis [8]. Sentiment analysis can be used to anticipate the direction of the stock market. Sentiment analysis aids in determining whether news regarding the stock market is good, negative, or neutral. In essence, sentiment analysis includes both the syntactic and semantic examination of those statements and their positive or negative polarity [9]. The primary aspect of this research is the development of a novel share market forecasting model utilizing LSTM neural networks, validation of the system using actual information from the NSE, and retraining prediction using sentiment analysis [10]. Our proposed methodology will assist individuals in making stock market investments based on a wide range of elements.
2.1 Recent studies on stock forecasting
In the last decade and a half, forecasting and stock price projections have emerged as notable areas of study. This is an extremely difficult and interesting area of study. There has been discussion regarding the share market's dependability because it is unpredictable, complicated, and dynamic by nature [11]. For forecasting the share market, many different variants have been utilized. Many conventional methods based on statistics are used for time series training, including linear regression, exponential moving, and auto-regression [12]. Researchers' proposed term: auto-relapse Changing Constantly system that can control the sequence, with some of the components being Auto-relapse and several being Moving Average Automatic regression, the Auto-Regressive Conditional Heteroskedasticity (ARCH) method, also referred to as the Integrated Moving Average model is suitable for handling non-stationary time - series data since it can recreate several time series data [13, 14].
2.2 Recent studies on temporal signal prediction based on deep learning algorithms
For time series assessment, certain other conventional techniques are also used. For assessing share value, many applications of ANN are used. One of the most precise methods for estimating stock patterns is ANN [15]. These models have various limitations based on the available data provided. The traditional temporal arrangement methods primarily used recorded stock information as the data are taken. In any instance, a wide range of factors, such as prevailing economic conditions and environmental effects, influence stock prices [16]. The standard temporal arrangement methods' direct application of complicated recorded data tends to reduce predicting capability, and consequently the final results [17]. As a result, many experts would generally downplay the information's complexity. For instance, head component analysis is recommended to decompose the initial data into simpler parts or higher-level elements to increase the predictive model's potential [18]. Additionally, these methods just take the previous data gathered as information factors without taking into account how the stock's state may affect the projection, such as the exuberant tendency of financial advisors.
In addition, some researchers view stock value variables as distinct variations rather than temporal sequences. Different specialists offer different stock value variations a great deal of consideration as a time series, but they agree that time arrangements either have limited or permanent memory. As was previously noted, the problems with LSTM are not adequately addressed [19]. In our research project, we proposed a method based on LSTM to predict stock price movements by taking input from various historical information. To achieve a precise predictive performance, use the information and a variety of technical analyses and perform various techniques. Our primary goal in writing this article is to provide a stock market prediction method that combines LSTM with current sentiment to determine if our share market predictive model is effective or over-fitted.
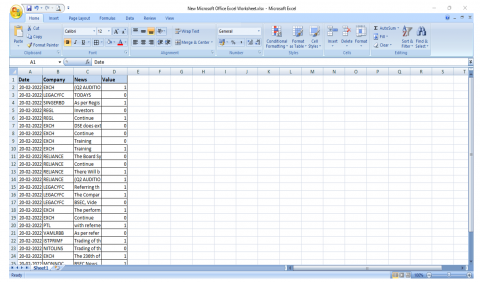
On the contrary hand, the collection of data for sentiment analysis was identical to the LSTM, but the data type was unique [20]. Therefore, use a Python script to collect all media opinions, and created an excel file to track news sentiment. This excel document contains the response to each company's news item. After that, we used sentiment data analysis to determine whether the stock price would be higher or lower the following day, similar to LSTM trend prediction. Eventually, using these two techniques, we supported the stock price forecast for the following session.
3.1 LSTM approach
Data Source: Estimating stock value is our major goal, and achieving it using the stock's historical pricing and patterns. It also places a strong emphasis on data mining methods about stock market historical information. A reliable source is required to obtain historical data and key data sets. The NSE website and the information obtained from https://www.NSEbd.org/ as our primary sources of information. For every financial firm, the NSE portal divides its categories into elements like share variation, closing, and opening prices, greatest available and cheapest prices, and expansion or decrease stock rates. Furthermore, it provides the typical India Stock Exchange results and corporate success in remarkable areas. The website is refreshed daily, and it is used to forecast potential stock prices by using previously recorded data [21].
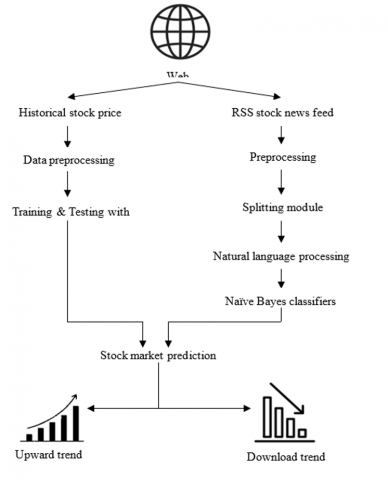
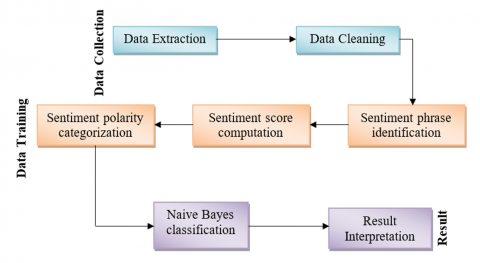
Data prepossessing and Feature Extraction: Initially integrated the information into the data folders and normalized the information. Once the transition process had begun, the datasets were split into training sets and test sets to evaluate the procedure. Sets of data go through a transition process to become clear, smooth data, and historical facts from these datasets are then categorized based on time series characteristics like access, closure, strong, decrease, and quantity shown in Figure 1.
Figure 1. Proposed methodology
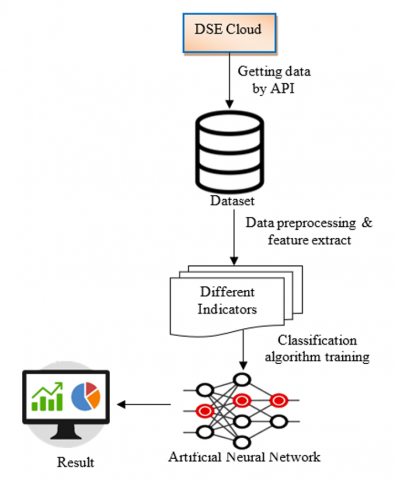
Our proposed approach receives all the information collected from past datasets and analyses it all using random biases and weights before beginning the training phase [22]. This method comprises a dense layer with ReLU activation, two LSTM levels, continuous input nodes, and finally dense output units with a linear activation function shown in Figure 2. The ADAM optimizer is used to carry out this learning. It runs on default values and a fixed learning rate to finish the learning.
Figure 2. Methodology for LSTM
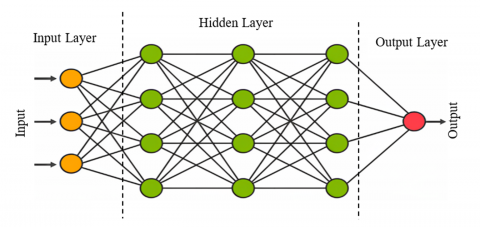
A scientific model named an ANN is used to simulate the ability of the human neural system to prepare data that has gained a lot of attention in the instance arrangement problem. Information is categorized into layers, including input, hidden, and output layers [23]. After transiting through the hidden units, the original level transitioned into the output layers. A similar approach, called forward propagation passes from one step to another. Since an MLP's output may be determined solely by its current input and is not dependent on either prior data or prospective input, MLP is appropriate for instance description. Based on various values, a single MLP can perform effectively in a variety of testing sectors. It has been shown that an MLP with a large number of components can predict any permanent capability with arbitrary accuracy. MLP also goes by the name "universal function approximation" as a consequence. RNN permits the connection of the systems to form a cycle, in contrast to the feed forward neural networks sparked by MLP.
Figure 3. Artificial neural network
Even though there is not much of a variation between RNN and MLP, the influence of RNN on time arrangement training is substantial. For certain, an RNN with a layer and a sufficient amount of hidden layers can fail to inexact any quantitative sequence to-arrangement mapping to qualitative preciseness, similar to the all-inclusive capability assumption. The method is designed to "remember" the data state of a previous system because of the repeated correlations of a concealed layer shown in Figure 3. One of RNN's key characteristics is its ability to outline the whole sequence of inputs to every yield. RNN is referred to as a short-term memory system because the effects degrade with a period as information sources override the training of the hidden units. The key characteristic of LSTM networks is the avoidance of long-term interdependence.
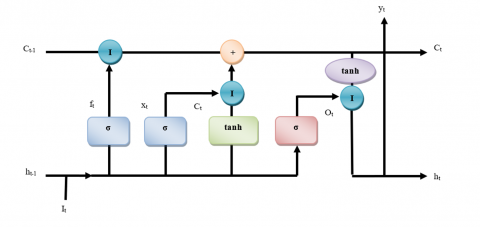
Figure 4. Long short-term memory
This network system was specifically created to address the drawbacks of RNN by learning long-term interdependence and diminishing and bursting edges. Memory cells are the convolution layer that makes up the LSTM shown in Figure 4. Input, output, and memory gates work together to alter and sustain those forgotten cells. These gates are built using several methods, including such input gates that show what information is added to the cell, output gates that show what information is now being used from the cell state, and memory gates that show what information is removed from the cell entryway. The exponential entryways enable LSTM to access more configuration information than RNN, hence resolving the disappearance of the angle problem.
3.2 Batch size
The amount of training information we used within a network is represented by the batch size. For training the model in the study, a sizable quantity of data must be used. The management of such a large quantity of datasets is challenging. To discover a solution, split the total amount of information into many batches. In addition, the amount of iterations depends on the total amount of batches [24]. Consider the scenario where 100 training data and separate the 100 training data points into 20 groups. It implies that five repetitions have been required for one round of learning the first batch size of 50.
Root Mean Square Error (RMSE) is the measure used to determine the residuals' standard deviation and to examine the model's efficiency. The disparity only between the objective and the achieved output value can be reduced by correctly utilizing the RMSE value [25]. The assessment of residuals determines how much further apart from the linear regression pieces of data are. The usage of RMSE is remarkably common, and it creates a fantastically useful error measure for numeric projections. RMSE is a frequently utilized method in climatology, forecast projection, and linear regression for confirming experimental data. Mean Absolute Error (MAE) and other massive errors are actively and severely rejected by RMSE.
$R M S E_{f o}=\left(\sum_{x=1}^N\left(z_{f x}-z_{o x}\right)^2 / N\right)^{1 / 2}$ (1)
3.3 Sentiment analysis approach
In this approach, we use RSS news sources to gather information from news from several stock markets shown in Figure 5. The RSS feed person receives the necessary new articles from the specified internet pages and arranges them into XML reports. On the foundation of headlines from several websites, an XML document is formed. After putting up the site variable, the final depiction information is grabbed [26]. Finally, it decodes the XML file from the collection of RSS channels. This RSS feed compiles information about the stock market exchange as an information source for reference purposes.
Figure 5. Architecture of RSS
In this Figure 6, the data is cleansed by deleting any redundant, erroneous, or incorrect values. It conducts noise removal by completing incomplete data, leveling noisy information, and identifying and removing exclusions [27-30]. The preprocessed data is then given to the following stage after this phase is finished.
Figure 6. Data source for sentiment analysis
Components for phrase separation using information already separated into multiple sections. These facts are gathered in a text file for experimental purposes. The technique used to control the content of a research session is sentiment analysis [31]. Text analysis and natural language processing are both employed to find and extract emotional information from source documents. In addition to identifying the words that convey sentiment, this process looks for relationships among words, making it easier to recognize emotions. Positive and negative statements are rated differently as positive and negative ideas, respectively.
3.4 Naive Bayes’ classifiers
The Bayes theorem provides the likelihood in conditional probability based on past events. A and B are two possible outcomes. P(A) represents situation A, while P(B) indicates situation B. For instance, the Naive Bayes classifier uses corpus information from news portals that are rich in both positive and negative terms. If we used natural language processing to divide these phrases into two classes, one would be for good terms and the other for negative ones. By evaluating the positive and negative attitudes, we can then determine the likelihood of a particular category. We must pre-classify the data set based on sentiment to train the information. As a result, sentiment can be used to describe the variables in the dataset, and P (sentiment - sentence) can be used to indicate the likelihood that a factor would happen based on the evidence in the phrase [32].
If we consider a word or phrase to be a symbol and the sentiment of a phrase to be the consequence of the token's sentiment, then we can use the token to indicate how many times a word occurs in a phrase. Count = P(token - Sentiment) (this token in class) +1/count(all class tokens) + count (all tokens) Here, multiplying by one is referred to as increasing one smoothly, which will lessen the likelihood of zero multiplication. The classifier, therefore, determines the posterior distribution. Based on the positivity and negativity of phrases that were used as instances, this likelihood shows the possibility of a positive or negative past. After the tokens have been combined, the overall information ratio - positive and negative - is revealed.
3.5 Training data
Table 1. Training sample data set
|
Data |
Company |
News |
Value |
|
6-8-22 |
Company A |
Positive |
1 |
|
6-8-22 |
Company A |
Negative |
0 |
|
6-8-22 |
Company A |
Positive |
1 |
|
6-8-22 |
Company A |
Negative |
0 |
|
7-8-22 |
Company A |
Negative |
0 |
|
7-8-22 |
Company A |
Positive |
1 |
|
7-8-22 |
Company A |
Positive |
1 |
|
7-8-22 |
Company A |
Negative |
0 |
Sentence Level Sentiment Score Algorithm was used to explore the entire outcome. Here, the research methodology is related to every single text before the results are condensed to provide the overall impact of the collection. For every dataset, the result typically falls between 0.0 and 1.0, with 1.0 being the total. The Part-of-Speech tagger is initially attached for every phrase in this sentence, and it shows the tagging as an item and an intensifier in a way that puts them equivalent to phrases in Table 1. A rating and an incentive for every phrase word to determine the sentence's total. If each segment's score value is determined by how favorable or negative that statement appears. If the conclusion is 0.0, it is considered a negative section, and if the outcome is 1, it is considered a positive portion.
3.6 Software and hardware
Python 3.5 was used to analyze and arrange the dataset, and this strategy makes extensive use of tools like NumPy and pandas. The entire model was built using the powerful library Keras and tensor flow, which is utilized for the large-scale heterogeneous system.
RMSE is used to evaluate precision and distinguish between an operation's projected and real costs. Since every model's variance must be kept to a minimum, RMSE is crucial. The frequency of RMSE differentiation among learning data and testing data for a general framework must be as low as possible. In the absence of this, the system underperformed throughout testing and training shown in Table 2.
Table 2. Epoch batch with neuron 50 result analysis
|
Epoch |
Size of batch |
RMSE training value |
RMSE testing value |
|
50 |
50 |
0.00823 |
0.00889 |
|
100 |
50 |
0.00598 |
0.00675 |
|
200 |
50 |
0.00575 |
0.00658 |
|
400 |
50 |
0.00639 |
0.00805 |
|
50 |
100 |
0.00759 |
0.00908 |
|
100 |
100 |
0.00657 |
0.00722 |
|
200 |
100 |
0.00582 |
0.00647 |
|
400 |
100 |
0.00708 |
0.00798 |
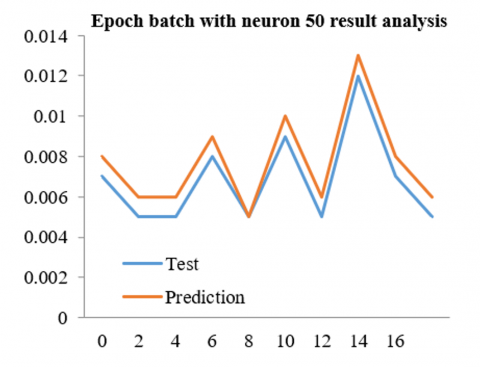
Table 2 shows the results of our analysis using 50 neurons and a variety of variables, including batch size and epoch. By using 400 epochs and 400 groups, we were able to obtain results with an initiating RMSE of 0.00639 and a leading RMSE of 0.00694 after running a variety of experiments.
Table 3. Epoch batch with neuron 100 result analysis
|
Epoch |
Size of batch |
RMSE training value |
RMSE testing value |
|
50 |
50 |
0.00653 |
0.00746 |
|
100 |
50 |
0.00619 |
0.00810 |
|
200 |
50 |
0.00633 |
0.00845 |
|
400 |
50 |
0.00514 |
0.00877 |
|
50 |
100 |
0.00761 |
0.00867 |
|
100 |
100 |
0.00637 |
0.00722 |
|
200 |
100 |
0.00592 |
0.00743 |
|
400 |
100 |
0.00539 |
0.00789 |
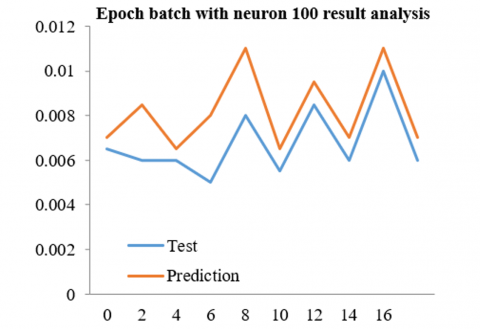
Table 3 shows the results of our analysis using 100 neurons and various settings, including epoch and batch size. After running several simulations, we discovered that using 200 epochs and 200 batches produced results with a leading RMSE of 0.00693 and an assisting RMSE of 0.00609.
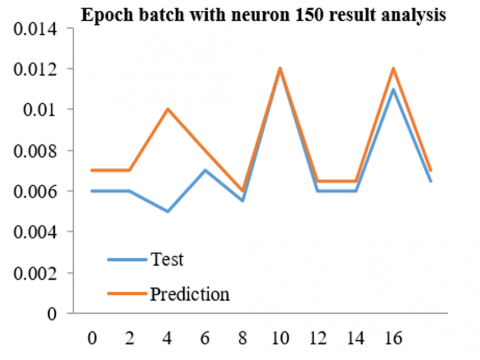
Table 4 shows the results of our analysis using 150 neurons and a variety of variables, including epoch and batch size. After running several calculations, we found that using 100 epochs and 100 batches produced results with an initial RMSE of 0.00612 and a leading RMSE of 0.00680. We use RMSE to analyze the effectiveness of the system. By using RMSE evaluation, the difference between the goal and the target variable is kept to a minimum. The root means square error, or RMSE, is the square of the proportion of the errors. The usage of RMSE is remarkably common, and it creates a tremendously useful error measurement for numeric assumptions. When compared to Mean Absolute Error, RMSE improves and rejects major errors.
Table 4. Epoch batch with neuron 150 result analysis
|
Epoch |
Size of batch |
RMSE training value |
RMSE testing value |
|
50 |
50 |
0.00639 |
0.00733 |
|
100 |
50 |
0.00648 |
0.00715 |
|
200 |
50 |
0.00556 |
0.00768 |
|
400 |
50 |
0.00552 |
0.01035 |
|
50 |
100 |
0.00706 |
0.00802 |
|
100 |
100 |
0.00614 |
0.00682 |
|
200 |
100 |
0.00557 |
0.00665 |
|
400 |
100 |
0.00531 |
0.00775 |
4.1 Sentimental analysis
Figure 7. Epoch batch with neuron 50 result analysis based on 400 epochs
Figure 8. Epoch batch with neuron 100 result analysis based on 200 epochs
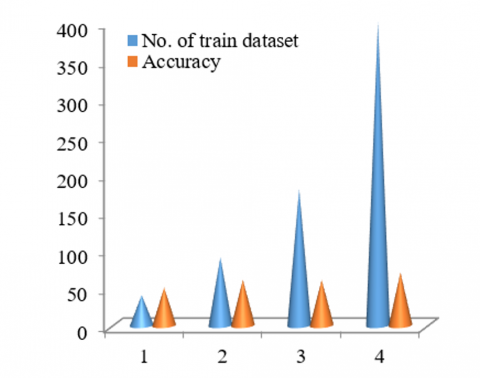
The three approaches of precision, specificity, and recall are utilized to perform sentiment classification. These techniques for sentiment classification are quite powerful. Although it will employ the other two approaches for a more effective outcome, precision is the primary determinant of the outcome. In contrast, if the accuracy is less, there are more positive results. A higher precision indicates fewer false positives. It increases specificity by lowering Recall and it was utilized in our system to assess the performance measures. Fewer false negatives result from a high recall, whereas more false negatives result from a lower recall. We determine the accuracy, specificity, and recall value for both the positive and negative term sets. To compute all proportions using various formulas and following comparability, we created the dataset with varying factors such as positive, true positive, negative, and true negative. The final results using various learning dataset sizes are shown in Figures 7-10.
Figure 9. Epoch batch with neuron 150 result analysis based on 100 epochs
Figure 10. Accuracy result
The latest market information indicates that the stock market pattern is increasing, which draws numerous academics to alternative techniques of forecasting employing innovative techniques. The forecasting technique benefits scholars and investors and anyone else who might benefit from having a general understanding of stock movement and market dynamics. A forecasting model with high precision is needed, together with sentiment analysis of stock news, to aid in the prediction of stock indexes. We used the most precise forecasting technology-LSTM neural network-in our system since it can resolve issues by differentiating between current and historical values. Our methodology could give investors, experts, or anybody concerned with stock market trading the information they need on stock prices and market trends. The proposed system creates a system that can forecast market changes less precisely.
[1] Terra Vieira, S., Lopes Rosa, R., Zegarra Rodríguez, D., Arjona Ramírez, M., Saadi, M., Wuttisittikulkij, L. (2021). Q-meter: Quality monitoring system for telecommunication services based on sentiment analysis using deep learning. Sensors, 21(5): 1880. https://doi.org/10.3390/s21051880
[2] Shang, L., Xi, H., Hua, J., Tang, H., Zhou, J. (2023). A Lexicon enhanced collaborative network for targeted financial sentiment analysis. Information Processing & Management, 60(2): 103187. http://dx.doi.org/10.1016/j.ipm.2022.103187
[3] Correia, F., Madureira, A.M., Bernardino, J. (2022). Deep Neural Networks applied to stock market sentiment analysis. Sensors, 22(12): 4409. http://dx.doi.org/10.3390/s22124409
[4] Patel, R., Choudhary, V., Saxena, D., Singh, A.K. (2021). LSTM and NLP based forecasting model for stock market analysis. In 2021 First International Conference on Advances in Computing and Future Communication Technologies (ICACFCT), Meerut, India, pp. 52-57. http://dx.doi.org/10.1109/ICACFCT53978.2021.9837384
[5] Nawaz, Z., Zhao, C., Nawaz, F., Safeer, A.A., Irshad, W. (2021). Role of artificial neural networks techniques in development of market intelligence: A study of sentiment analysis of eWOM of a women’s clothing company. Journal of Theoretical and Applied Electronic Commerce Research, 16(5): 1862-1876. http://dx.doi.org/10.3390/jtaer16050104
[6] Sable, R., Goel, S., Chatterjee, P. (2022). Targeted evaluation of context-sensitive sentiment analysis models for prediction of stock trends. In Proceedings of Third International Conference on Intelligent Computing, Information and Control Systems, pp. 477-489. http://dx.doi.org/10.1007/978-981-16-7330-6_36
[7] Balamurugan, K., Latchoumi, T.P., Ezhilarasi, T.P. (2022). Wearables to improve efficiency, productivity, and safety of operations. In Smart Manufacturing Technologies for Industry 4.0, pp. 75-90. http://dx.doi.org/10.1201/9781003186670-9
[8] Lin, Y. L., Lai, C. J., Pai, P.F. (2022). Using deep learning techniques in forecasting stock markets by hybrid data with multilingual sentiment analysis. Electronics, 11(21), 3513. http://dx.doi.org/10.3390/electronics11213513
[9] Garikapati, P., Balamurugan, K., Latchoumi, T. P. (2022). K-means partitioning approach to predict the error observations in small datasets. International Journal of Computer Aided Engineering and Technology, 17(4): 412-430. http://dx.doi.org/10.1504/IJCAET.2022.126601
[10] Manjunath, C., Balamurugan, M., Ghosh, B., Krishna, A.V. (2021). A review of stock market analysis approaches and forecasting techniques. Smart Computing, pp. 368-382. http://dx.doi.org/10.1201/9781003167488-42
[11] Dhanasekaren, K., Aluri, S.T., Karthikeyan, N., Baskaran, S.H., Selvanambi, R. (2023). A study on the impact of sentiment analysis on stock market prediction. Recent Advances in Computer Science and Communications (Formerly: Recent Patents on Computer Science), 16(1): 73-93. https://doi.org/10.2174/2666255815666220315153545
[12] Truică, C.O., Apostol, E.S., Șerban, M.L., Paschke, A. (2021). Topic-based document-level sentiment analysis using contextual cues. Mathematics, 9(21): 2722. https://doi.org/10.3390/math9212722
[13] Latchoumi, T.P., Swathi, R., Vidyasri, P., Balamurugan, K. (2022). Develop new algorithm to improve safety on wmsn in health disease monitoring. In 2022 International Mobile and Embedded Technology Conference (MECON), Noida, India, pp. 357-362. http://dx.doi.org/10.1109/MECON53876.2022.9752178
[14] Cristescu, M.P., Nerisanu, R.A., Mara, D.A., Oprea, S.V. (2022). Using market news sentiment analysis for stock market prediction. Mathematics, 10(22): 4255. http://dx.doi.org/10.3390/math10224255
[15] Alexandridis, G., Varlamis, I., Korovesis, K., Caridakis, G., Tsantilas, P. (2021). A survey on sentiment analysis and opinion mining in Greek social media. Information, 12(8): 331. http://dx.doi.org/10.3390/info12080331
[16] Cao, Y., Sun, Z., Li, L., Mo, W. (2022). A study of sentiment analysis algorithms for Agricultural Product Reviews Based on Improved BERT model. Symmetry, 14(8): 1604. http://dx.doi.org/10.3390/sym14081604
[17] Khattak, A., Asghar, M.Z., Ishaq, Z., Bangyal, W.H., Hameed, I.A. (2021). Enhanced concept-level sentiment analysis system with expanded ontological relations for efficient classification of user reviews. Egyptian Informatics Journal, 22(4): 455-471. http://dx.doi.org/10.1016/j.eij.2021.03.001
[18] Yin, Z., Shao, J., Hussain, M.J., Hao, Y., Chen, Y., Zhang, X., Wang, L. (2022). DPG-LSTM: An enhanced lstm framework for sentiment analysis in social media text based on dependency parsing and GCN. Applied Sciences, 13(1): 354. http://dx.doi.org/10.3390/app13010354
[19] Chandio, B.A., Imran, A.S., Bakhtyar, M., Daudpota, S.M., Baber, J. (2022). Attention-based RU-BiLSTM sentiment analysis model for roman Urdu. Applied Sciences, 12(7): 3641. http://dx.doi.org/10.3390/app12073641
[20] Srijiranon, K., Lertratanakham, Y., Tanantong, T. (2022). A hybrid framework using PCA, EMD and LSTM methods for stock market price prediction with sentiment analysis. Applied Sciences, 12(21): 10823. http://dx.doi.org/10.3390/app122110823
[21] Ahmed, K., Nadeem, M.I., Li, D., Zheng, Z., Ghadi, Y. Y., Assam, M., Mohamed, H.G. (2022). Exploiting stacked autoencoders for improved sentiment analysis. Applied Sciences, 12(23): 12380. http://dx.doi.org/10.3390/app122312380
[22] Štrimaitis, R., Stefanovič, P., Ramanauskaitė, S., Slotkienė, A. (2021). Financial context news sentiment analysis for the Lithuanian language. Applied Sciences, 11(10): 4443. http://dx.doi.org/10.3390/app11104443
[23] Alanazi, S.A., Khaliq, A., Ahmad, F., et al. (2022). Public’s mental health monitoring via sentimental analysis of financial text using machine learning techniques. International Journal of Environmental Research and Public Health, 19(15): 9695. http://dx.doi.org/10.3390/ijerph19159695
[24] Karn, A.L., Karna, R.K., Kondamudi, B.R., Bagale, G., Pustokhin, D.A., Pustokhina, I.V., Sengan, S. (2022). Customer centric hybrid recommendation system for E-Commerce applications by integrating hybrid sentiment analysis. Electronic Commerce Research, 23: 279-314. http://dx.doi.org/10.1007/s10660-022-09630-z
[25] Nitha, K.P., Sivakumari, S. (2021). Sentimental analysis for Sensex stocks using Vader algorithm-an approach for investment recommendations in Indian stock market. Turkish Online Journal of Qualitative Inquiry, 12(6): 1700-1707.
[26] Chen, W.K. (1993). Linear Networks and Systems. Wadsworth, Belmont.
[27] Costa, T., Zarante, P., Sodré, J. (2013). Simulation of aldehyde formation in ethanol fuelled spark ignition engines. In: Sens, M., Baar, R. (eds). Engine Processes. Expert Verlag, Berlin.
[28] Bentley, R.E. (1998). Handbook of Temperature Measurement Vol. 3: The Theory and Practice of Thermoelectric Thermometry. Springer Science & Business Media.
[29] Williams, J.O. (1993). Narrow-band analyzer. Ph.D. dissertation. Department of Electronic Engineering, Harvard University, Cambridge, Massachusetts, USA.
[30] SIMUL8 Corporation. (2015). SIMUL8 – Process Simulation Software. http://www.simul8.com/.
[31] Reber, E.E., Michell, R.L., Carter, C.J. (1988). Oxygen absorption in the earth’s atmosphere. Technical Report TR-0200 (4230-46)-3. Aerospace Corporation, Los Angeles, California, USA.
[32] Motorola Semiconductor Data Manual. (1989). Motorola Semiconductor Products Inc., Phoenix, USA.