Jagruti Meshram | Seeta Devi![]() | Gaikwad Sachin Ramnath
| Gaikwad Sachin Ramnath![]() | Lily Podder*
| Lily Podder*![]() | Harikrishnan R
| Harikrishnan R![]()
© 2023 IIETA. This article is published by IIETA and is licensed under the CC BY 4.0 license (http://creativecommons.org/licenses/by/4.0/).
OPEN ACCESS
This GESTOSIS scale is a validated tool which aids in predicting high risk women for pregnancy-induced hypertension (PIH). This study aimed to use machine learning algorithms to determine the efficacy of the GESTOSIS score in predicting PIH. A prospective observational study was conducted on 70 pregnant women. The features in GESTOSIS scale classified as mild, moderate, or severe. The results showed that the Adaptive Boosting (AB) model precisely predicts the PIH with an accuracy range between 97% to 99% based on the results of regression and classification prediction models respectively with a true -positive rate (TPR) of 90%. The GESTOSIS score is concluded to be a simple scale that can be administered by all front-line health workers in the community without intrusive procedures.
GESTOSIS score, machine learning, prediction, pregnancy induced hypertension
Hypertensive disorders in pregnancy are identified after the 20 weeks of gestation, impacting multi-systems within the body. The diagnostic criteria include raised blood pressure to the extent of 140/90 mmHg, high albumin levels, and pathological edema [1]. Pregnancy Induced Hypertension leads to many complications such as preeclampsia, eclampsia, HELLP syndrome, renal and liver failure, retinal detachment, cardiac disorders, and pulmonary edema [2]. If preeclampsia is not treated on time, it leads to the complication of eclampsia, which is the leading cause of maternal mortality and morbidity. Approximately 19 % of deaths are occurring due to PIH among all maternal deaths (WHO 2014) [1], irrespective of mothers espousing health-seeking behaviors to obtain relevant health care services from health care centers/healthcare professionals [3, 4].
According to the short-term statistics of the National Eclampsia Registry (NER 2013), FOGSI, ICOG, prevalence of pre-eclampsia, and eclampsia are 10.3% and 1.9%, respectively. Approximately 50% of these cases [5] are found during antepartum, while 13% of patients are reported in postpartum. About 4-6% of maternal deaths occur due to eclampsia. The causes of maternal mortality [6] in PIH are as follows; 1) Myths and misapprehensions of family members regarding pregnancy, 2) Poor socio-economic status that privations to proper medical care during pregnancy. 3) Lack of transportation facilities to commute the patient to the health care centers in case of any emergency. 4) Lack of medical professionals, i.e., multidisciplinary medical team at community centres and 5) Lack of PIH predictive tools [7].
The universal existing screening tests direct the prediction of PIH. However, most of them are invasive procedures and can be administered only by a physician/ medical officers, and they cannot be administered by all grass-root level health care professionals such as nursing officers/ ANMs, etc. In India, approximately 70% of the population [8] lives in rural communities. Thus, it is important to develop a simple scale to predict the PIH that all healthcare professionals can administer; therefore, early identification, referral, and proper care can be reached for indigent antenatal women. Preeclampsia prediction aids [1] in the prevention of perinatal and neonatal morbidity and mortality [9, 10]. Preterm birth is common in women with preeclampsia. Preterm newborns who were admitted to NICU significantly contribute to neonatal deaths at 95% confidence interval; however, aspirin administration beginning in the 11th week of pregnancy can reduce complications such as preterm deliveries, neonatal deaths, and maternal deaths [11].
Mandrupkar and team of FOGSI-GESTOSIS-ICOG developed the GESTOSIS score [12]. It helps to categorize the risk factors of pre-eclampsia and design predictive practices and preventive dealings. These methodologies allow the clinician to plan and provide systematic care in pregnancy to prevent eclampsia and other complications by adopting certain standardized clinical management protocols.
1.1 Machine learning algorithms' role in the prediction of preeclampsia
Because of the increasing development of artificial intelligence in various fields, machine-learning algorithms were developed and are now used in the medical profession. Machine learning or artificial intelligence mimics human function when processing the data [13]. Massive data and essential evidence-based information are mined using machine learning methods to create relevant models. According to Sonia Pereira et al., reports that pregnancy-related factors were used to predict accurate delivery techniques in order to determine how better services can be provided to antenatal women in order to prevent the anticipated complications. In this study, five machine learning algorithms were used to diagnose the physical condition of the foetus [13].
Prospective studies can be conducted by recruiting women with PIH using the GESTOSIS score's criteria. Three machine-learning algorithms were used to detect preeclampsia early on: Deep Neural Networks (DNN), Logistic Regression (LR), and Support Vector Machine (SVM). The GESTOSIS parameters include maternal biodata, obstetrical characteristics, antenatal lab reports, and ultrasonography. Cross-validation was used to assess the calibration and discrimination under the receiver-operating curve (AUROC).
1.2 Novelty and contribution
According to the authors' review, currently, there hasn't been any research work done by using the GESTOSIS score and machine learning tools to predict pregnancy-induced hypertension. As a result, the current study encourages clinicians and grassroot health care professionals to use this tool to screen pregnant women high-risk for PIH. In addition, in this study, the problem-based learning techniques use machine learning algorithms to understand better prediction models, which are most fit to envisage the PIH accurately. This study will become the first to combine the literature of relevant studies on the GESTOSIS score. The current study guides new researchers to acquire basic skills in other engineering fields. The investigators from the field of Nursing conducted this study in collaboration with experts in engineering fields who had the skills to apply the machine learning predictive models. Machine learning tools are part of engineering, usually done either by coding or without coding.
To explain this study more specifically, tools-based simulation is considered an accurate method for visualizing and analyzing the data without having coding skills. The researchers in this study trained thorougly with the tools and analysis done with engineering skills. These machine-learning tools are also simple to use for novice researchers and scientists to analyse their data.
In view of the above description, the following are the objectives of the current original study.
We used the purposive sampling technique to enroll 70 antenatal women who had completed 20 weeks of gestational age. This study excluded antenatal women who had already been diagnosed with PIH. The final calculated sample size was 70, based on 10% of the estimated prevalence rate of PIH among all pregnancies at a 95% confidence level and 5% error at the margin.
2.1 Data correlation
Table 1. Significant input attributes with PIH target attribute
|
Sr. No. |
Attribute |
Correlation Coefficient |
Association |
|
1. |
Risk_score_sum |
+0.919 |
Very strong association |
|
2. |
History of PIH |
+0.941 |
Very strong association |
|
3. |
Pre-eclampsia family history |
+0.690 |
Moderate association |
|
4. |
GDM |
+0.519 |
Moderate association |
|
5. |
Chronic Hypertension |
+0.317 |
Weak Association |
Table 2. Correlation between risk factor score of PIH and maternal demographics
|
Parameters |
GESTOSIS Score |
Total |
Chi-square |
p value |
|
|
At risk (≥3) |
Not at risk (<3) |
||||
|
Age in years |
|
|
|
3.82 |
0.01 |
|
18 – 25 |
12 |
26 |
38 |
||
|
26 – 30 |
14 |
15 |
29 |
||
|
31 – 35 |
0 |
3 |
3 |
||
|
Gestational age in weeks |
|||||
|
20 – 25 |
8 |
3 |
11 |
7.36 |
0.04 |
|
26 – 30 |
5 |
12 |
17 |
||
|
31 – 35 |
6 |
16 |
22 |
||
|
36 – 40 |
7 |
13 |
20 |
||
Table 3. Association between target variable (PIH) and other input multi variables
|
Sr. No. |
Input variables |
P value |
S value |
|
1 |
Risk_Score_Sum |
+0.919 |
+0.882 |
|
2 |
Pre-eclampsia family history |
+0.690 |
+0.659 |
|
3 |
GDM |
+0.519 |
+0.515 |
|
4 |
Women with CAD |
+0.372 |
+0.398 |
|
5 |
Increased weight gain in pregnancy |
+0.330 |
+0.334 |
|
6 |
Chronic Hypertension |
+0.317 |
+0.302 |
|
7 |
Age interval |
-0.263 |
-0.287 |
|
8 |
Below 19 |
+0.255 |
+0.272 |
|
9 |
Dylipidemia |
+0.234 |
+0.203 |
|
10 |
Women with SGA |
+0.234 |
+0.203 |
|
11 |
hypothyroidism |
+0.234 |
+0.203 |
|
12 |
Pregnancy with IVF |
+0.223 |
+0.247 |
|
13 |
Anemia |
+0.183 |
+0.165 |
|
14 |
Primigravida |
+0.169 |
+0.203 |
|
15 |
Pitting oedem |
+0.141 |
+0.143 |
|
16 |
PCOD |
+0.129 |
+0.129 |
|
17 |
Obesity |
+0.119 |
+0.100 |
|
18 |
Above 35 |
+0.095 |
+0.109 |
Note: P value = Pearson correlation, S value= Spearman correlation
Identifying the correlation between the two variables is imperative to understand the significance between those variables. The values of correlation and chosen variables can affect the predicting tools. The linear relationship between two variables is determined by Pearson Correlations (PC) and Spearman correlations (SC). The correlation coefficient cascades between -1 and +1; -1 indicates a strong negative association among two variables, +1 indicates a robust positive association, while 0 indicates no linear association. A correlation value of less than 0.3 designates a weak association, while values between 0.3 and 0.7 specify a moderate association. If the value is greater than 0.7, it specifies a sturdy association among two variables [14, 15].
Table 1 depicts the correlation between variables such as family history of Pre-eclampsia, Gestational Diabetes Mellitus (GDM), and Chronic Hypertension. In Table 1, all variables show positive values, which are generated using the Orange tool. Family history of preeclampsia, and GDM show moderate association (+0.690 and +0.519), whereas the previous history of PIH has very strong association.
Table 2 indicated that the age of the pregnant women and gestational age had a significant correlation with the PIH risk score.
Table 3 presented the ‘P’ and ‘S’ values of the target variables of pregnancy-induced hypertension in comparison to the other input multi variables.
2.2 GESTOSIS score scale
Table 4 indicated that GESTOSIS scale consists of 24 items, with scores ranging from 1 to 13 for mild symptoms, and each item has a score of 1. Items from 14–17 are classified as having moderate PIH symptoms, and each item has a score of 2. Items from 20 to 24 are classified as severe PIH symptoms, and each item receives a score of 3. The score is alloted based on the woman's responses and the clinician's assessment.
Table 4. GESTOSIS score for prediction of pregnancy induced hypertension
|
Sr. No. |
Risk Factors |
Score |
|
1 |
Age above 35 years |
1 |
|
2 |
Age below 19 years |
1 |
|
3 |
Maternal Anemia |
1 |
|
4 |
Obesity (BMI >30) |
1 |
|
5 |
Pregnant for the first time |
1 |
|
6 |
Short duration of sperm exposure |
1 |
|
7 |
Woman born as small for gestational age |
1 |
|
8 |
Family history of cardiovascular disease |
1 |
|
9 |
Polycystic ovary syndrome |
1 |
|
10 |
Inter pregnancy interval more than 7 years |
1 |
|
11 |
Conceived with Assisted Reproductive (IVF/ ICSI) Treatment |
1 |
|
12 |
Chronic vascular disease (Dyslipidemia) |
1 |
|
13 |
Excessive weight gain during pregnancy |
1 |
|
14 |
Maternal hypothyroidism |
2 |
|
15 |
Family history of pre-eclampsia |
2 |
|
16 |
Gestational diabetes mellitus |
2 |
|
17 |
Obesity (BMI > 35 kg/M2) |
2 |
|
18 |
Multifetal pregnancy |
2 |
|
19 |
Hypertensive disease during previous pregnancy |
2 |
|
20 |
Mental disorders |
3 |
|
21 |
Inherited / Acquired Thrombophilia |
3 |
|
22 |
Maternal chronic kidney disease |
3 |
|
23 |
Autoimmune disease (SLE / APLAS / RA ) |
3 |
|
24 |
Pregnancy with Assisted Reproductive (OD or Surrogacy) Treatment |
3 |
Pattern of risk scoring
When the total score is =/> 3; pregnant woman was marked as ‘At risk
Professionals translated the GESTOSIS scale from English to Marathi. A native English speaker translated and checked its back. Throughout its conversion, it made subtle philosophical, social strata, theoretical, and dialectal sameness. This scale was pretested on ten antenatal women at Talera Pimpri Chinchwad Municipal Corporation (PCMC) hospital in Pune using interview and assessment methods. Cronbach's alpha was used to assess the reliability of the GESTOSIS score scale, and the value was 0.74, which falls within the acceptable range of reliability. The scale discovered was feasible to administer to pregnant women. Following were the steps involved in the design of the current study.
Step 1: Collection of the data and explanation
The primary data was collected from antenatal women who had completed at least 20 weeks of gestation and visited Yashwantrao Chavan Memorial Hospital (YCM) antenatal OPD. To support the supplementary findings, the researchers revisited these women in the third trimester to validate the data collected in the second trimester. The investigators further re-evaluated the investigations, such as ultra-sonography to evaluate the fetal and placental weight about gestation age. Women who were found to be at high risk for predicting PIH were referred to an expert for further evaluation. This step consists of data processing, feature extraction, and variable correlation analysis.
Step 2: Descriptive statistics
One of the data mining methods involving mathematics and related data collection and elucidation is descriptive statistics for predicting a high PIH data set [16]. The Jeffreys's Amazing Statistics Program is a simple tool to use for researchers with limited computer skills [17].
Table 5 depicts the risk score for pregnancy-induced hypertension which is classified into Low Risk (1), moderate risk (2), and severe risk (3) for the prediction of hypertension in pregnancy based on the antenatal woman's highest score.
Table 5. Categorization of the risk score of the pregnancy induced hypertension
|
Risk_Score |
Risk_% |
Risk_ Level |
Risk_ Level |
Participants |
|
1 |
3 |
1 |
Low Risk |
43 (61.43) |
|
2 |
5 |
|||
|
3 |
8 |
|||
|
4 |
10 |
2 |
Moderate Risk |
16 (22.86) |
|
5 |
13 |
|||
|
6 |
16 |
3 |
High Risk |
11 (15.71) |
|
7 |
18 |
|||
|
8 |
21 |
|||
|
Total |
70 |
|||
The descriptive statistics in Table 7 show that the risk factor for pregnancy-induced hypertension had a higher mean value (PIH). Among the parameters chosen, there were no missing values. Table 7 findings indicate that the primary variables presented in this table are family history of pre-eclampsia, eclampsia, history of GDM, chronic hypertension, and previous PIH history. The greatest mean (1.543), mode (1.000), and median (1.000) values can be seen in the parameter of previous history of PIH data. The family history of pre-eclampsia has a greater standard deviation (0.827), followed by the previous history of PIH. The values of the Standard Error of Skewness (0.287) for all chosen parameters are similar. However, the Skewness of PIH history is less apparent. The minimum (1.00) and maximum (3.000) values are higher in PIH.
Table 6. Distribution of the participants based on the different categories for the prediction of pregnancy induced hypertension
|
PIH category |
Risk score sum |
Frequency |
Percentage |
Cumulative percent |
|
1 – Low risk category |
1 |
8 |
18.605 |
18.605 |
|
2 |
18 |
41.860 |
60.465 |
|
|
3 |
17 |
39.535 |
100.000 |
|
|
Missing |
0 |
0.000 |
|
|
|
Total |
43 |
100.000 |
|
|
|
2 – Moderate Risk |
4 |
9 |
56.250 |
56.250 |
|
5 |
7 |
43.750 |
100.000 |
|
|
Missing |
0 |
0.000 |
|
|
|
Total |
16 |
100.000 |
|
|
|
3 – High risk |
5 |
1 |
9.091 |
9.091 |
|
6 |
4 |
36.364 |
45.455 |
|
|
7 |
4 |
36.364 |
81.818 |
|
|
8 |
2 |
18.182 |
100.000 |
|
|
Missing |
0 |
0.000 |
|
|
|
Total |
11 |
100.000 |
|
Table 7. Descriptive statistics of selected parameters in relation to the total risk score
|
Parameters |
Risk score sum |
Family History of Pre -eclampsia |
GDM |
Chronic Hypertension |
History of PIH |
|
Valid |
70 |
70 |
70 |
70 |
70 |
|
Missing |
0 |
0 |
0 |
0 |
0 |
|
Mean |
3.414 |
0.429 |
0.257 |
0.086 |
1.543 |
|
Std. Error of Mean |
0.218 |
0.099 |
0.081 |
0.049 |
0.090 |
|
Median |
3.000 |
0.000 |
0.000 |
0.000 |
1.000 |
|
Mode |
2.000 |
0.000 |
0.000 |
0.000 |
1.000 |
|
Std. Deviation |
1.822 |
0.827 |
0.674 |
0.408 |
0.755 |
|
Skewness |
0.778 |
1.423 |
2.268 |
4.614 |
0.993 |
|
Std. Error of Skewness |
0.287 |
0.287 |
0.287 |
0.287 |
0.287 |
|
Kurtosis |
-0.091 |
0.026 |
3.236 |
19.853 |
-0.512 |
|
Std. Error of Kurtosis |
0.566 |
0.566 |
0.566 |
0.566 |
0.566 |
|
Minimum |
1.000 |
0.000 |
0.000 |
0.000 |
1.000 |
|
Maximum |
8.000 |
2.000 |
2.000 |
2.000 |
3.000 |
|
Sum |
239.000 |
30.000 |
18.000 |
6.000 |
108.000 |
|
25th percentile |
2.000 |
0.000 |
0.000 |
0.000 |
1.000 |
|
50th percentile |
3.000 |
0.000 |
0.000 |
0.000 |
1.000 |
|
70th percentile |
4.750 |
0.000 |
0.000 |
0.000 |
2.000 |
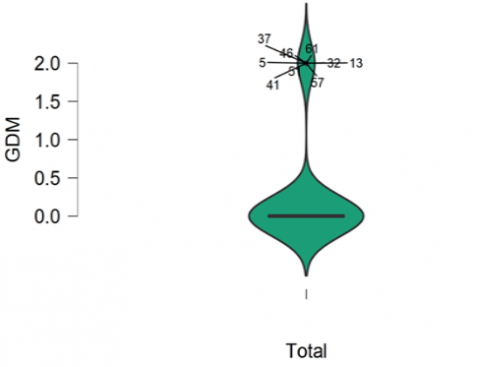
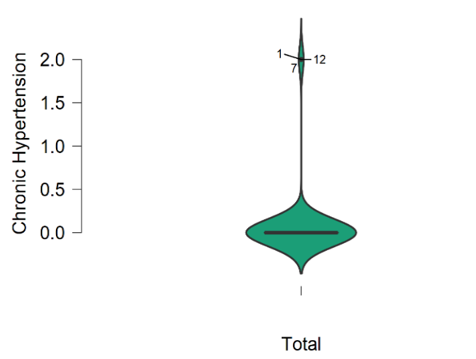
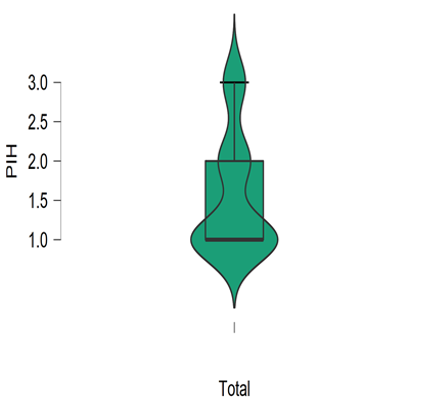
Figure 1 illustrates that the majority of the samples had a score between 1 and 5, with a mean value of 3. As a result, 61% of antenatal women are at low risk for PIH. Figure 2 to Figure 4 show that the majority of participants have no family history of preeclampsia, gestational diabetes, or chronic hypertension. Figure 5 depicts that majority (61.43%) of the participants fall under the risk level of 1 (Low Risk), and 16% of women with a history of preeclampsia are at high risk for PIH. Figure 6 reveals that 61%, 23%, and 16% of prenatal women fall into the low risk, moderate risk, and high risk groups for PIH, respectively.
Step 3: Development of the prediction models
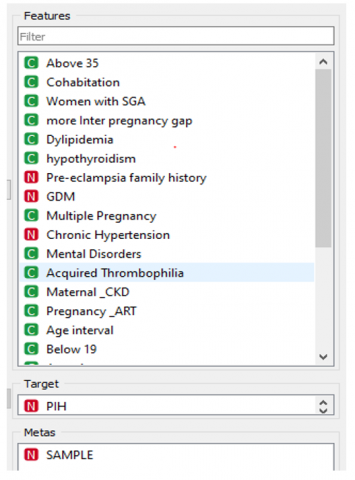
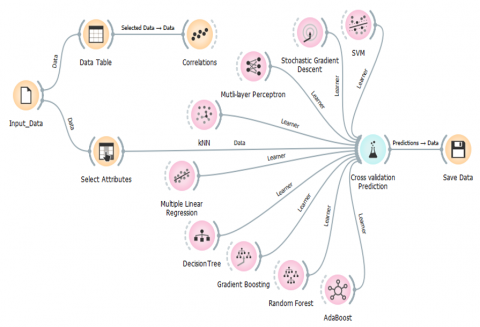
The data was normalized for pre-processing, and correlation method was used to find the significant attributes in the data set. Total features are further classified into three types: independent attributes, dependent attributes, and meta attributes using Orange software, as shown in Figure 7.
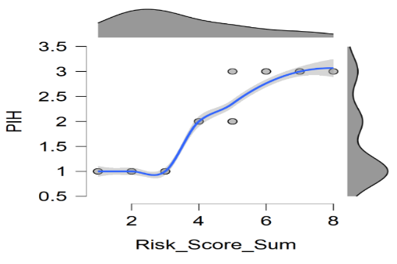
Figure 8 and Figure 9 illustrated that a family history of PIH and a previous history of pre-eclampsia predicted susceptibility to pregnancy-induced hypertension.
Step 4: Evaluation of prediction model’s performance
The Orange model was used to select nine algorithms, including Support Vector Machine (SVM), Stochastic Gradient Descent (SGD), Multi-layer Perceptron (MLP), k-Nearest Neighbors (kNN), Multiple Linear Regression (MLR), Decision Tree (DT), Gradient Boosting (GB), Random Forest (RF), and Adaptive Boosting (AB) as shown in Figure 10. The prediction models are created using the input data set and fine-tuning each algorithm's hyperparameter. After clicking on each algorithm, we can fine-tune the hyperparameters to maintain better prediction accuracy. To develop prediction models, 20-fold crop validation model is adopted.
This step helps in predicting the performance of predicting models with the available dataset. The parameters of the performance matrix are as follows; Mean Square Error (MSE), Root Mean Square Error (RMSE), Mean Absolute Error (MAE), and coefficient of determination (R2) [18].
Table 8 dipicts the tuned hyperparameter for both classification , and regression prediction model. AB algorithm performs better predictive results with the hyperparameter namely larning rate (0.50000), classifier algorithm (SAMME.R), and regression loss (Linear).
Figure 1. Boxplot for total risk score of PIH
Figure 2. Boxplot for family history of preeclampsia
Figure 3. Boxplot for gestational diabetes
Figure 4. Boxplot for chronic hypertension
Figure 5. Boxplot for previous history of PIH
Figure 6. Boxplot between PIH and categories of risk
Figure 7. Feature separation using Orange software
Figure 8. Scatter plot of preeclampsia and prediction of PIH
Figure 9. Scatter plot of history of PIH and prediction of PIH
Table 8. Hyper-parameter tuning of the classification and regression prediction model
|
Algorithm |
Hyper-parameter |
|
|
SVM |
Regression Cost (C) |
0.10 |
|
Complexity bound (v) |
0.05 |
|
|
Kernel function |
Polynomial |
|
|
Numerical tolerance |
1.0 |
|
|
Iteration limit |
20 |
|
|
SGD |
Classification: Squared ɛ insensitive |
0.01 |
|
Regression: Squared ɛ insensitive |
0.00 |
|
|
Regularization |
Ridge (L2) |
|
|
Strength (α) |
0.01000 |
|
|
Learning rate |
Constant |
|
|
Initial learning rate (ᶯ0) |
0.0032 |
|
|
Number of iterations |
10 |
|
|
MLP |
Neurons in hidden layers |
128,64,32,8 |
|
Activation |
Identity |
|
|
Solver |
Adam |
|
|
Regularization |
α=15 |
|
|
Maximum number of iterations |
28 |
|
|
KNN |
Number of neighbors |
5 |
|
Metric |
Euclidean |
|
|
Weight |
Uniform |
|
|
MLR |
Regularization |
Ridge (L2) |
|
Regularization strength (α) |
19 |
|
|
DT |
Minimum number of iterations in leaves |
10 |
|
Do not split subsets smaller than |
2 |
|
|
Limit the maximal tree depth to |
10 |
|
|
Stop when majority reaches (%) |
99 |
|
|
GB |
Method: Gradient Boosting (scikit-learn) |
True |
|
Number of trees |
100 |
|
|
Learning rate |
0.100 |
|
|
Limit depth of individual trees |
3 |
|
|
Do not split subsets smaller than |
2 |
|
|
Fraction of training instances |
1.00 |
|
|
RF |
Number of trees |
32 |
|
Replicable training |
True |
|
|
Limit depth of individual trees |
5 |
|
|
Do not split subsets smaller than |
5 |
|
|
AB |
Weak learner |
DT |
|
Number of estimators |
15 |
|
|
Learning rate |
0.50000 |
|
|
Classification algorithms |
SAMME.R |
|
|
Regression loss function |
Linear |
|
Figure 10. Workflow of prediction model using Orange software
The previous section on research design covered the general development of prediction models using machine-learning algorithms. This section discusses the results of data processing and scale validation. The validation results assisted the researchers to understand the GESTOSIS score's accuracy in predicting antenatal women at high risk for pregnancy-induced hypertension.
According to the GESTOSIS score, approximately 38% of the women were at risk of predicting pregnancy-induced hypertension.
Table 9. Distribution of the samples based on the obstetrical characteristics
|
Parameters |
Obstetrical variables |
f |
% |
|
Gestational age in weeks. |
20 – 25 |
11 |
15.7 |
|
26 – 30 |
17 |
24.3 |
|
|
31 – 35 |
22 |
31.4 |
|
|
36 – 40 |
20 |
28.6 |
|
|
Antenatal check-ups |
Regular |
70 |
100 |
|
Irregular |
0 |
0 |
|
|
Nil |
0 |
0 |
Table 10. Antenatal women at high risk for PIH based on the GESTOSIS score n=70
|
Risk factor score |
f |
% |
|
High risk (≥3) |
27 |
38.38 |
|
Mild risk (<3) |
43 |
61.42 |
|
Total |
70 |
100 |
Table 9 indicates The average gestational age of the participants is 28 weeks, and they all had regular antenatal check-ups. Table 10 and Table 11 showed, following the administration of the GESTOSIS score, 27 (38.38 %) women scored greater than 3. As a result, these women are considered at high risk of Pregnancy Induced Hypertension (PIH). These women were followed up and evaluated using the criteria listed above. 88.88% of women had blood pressure greater than 140/90 mmHg and 62.96 % of participants had > 2+ urine albumin. According to the Table 12, approximately 55.55% of antenatal women out of 27 had a positive at risk (≥3) as per the GESTOSIS score.
Table 11. Efficacy GESTOSIS score on prediction of PIH
|
Parameter |
f |
% |
|
Blood pressure |
|
|
|
<140 / 90 mmHg |
3 |
11.11 |
|
≥140 / 90 mmHg |
24 |
88.88 |
|
Mean Arterial Pressure |
||
|
<100 mmHg |
17 |
62.96 |
|
>100 mmHg |
10 |
37.03 |
|
Urine Albumin Test |
||
|
< 2+ |
17 |
62.96 |
|
> 2+ |
10 |
37.03 |
|
Platelet count: |
|
|
|
<100,000/mm3. |
21 |
77.77 |
|
> 100,000/mm3. |
6 |
27.22 |
|
Fetal weight – report of ultra-sonography |
||
|
Correlating to the gestational age |
22 |
81.48 |
|
Not correlated to the gestational age |
5 |
18.51 |
|
Placental weight - ultra sonography |
||
|
Correlating to the gestational age |
19 |
70.37 |
|
Not correlated to the gestational age |
8 |
29.62 |
Table 12. Efficacy of GESTOSIS score on prediction of PIH
|
GESTOSIS score |
f |
% |
|
Positive (At risk (≥3) |
15 |
55.55 |
|
Negative (No at risk (<3) |
12 |
44.44 |
|
Total |
27 |
100 |
Furthermore, in this study, the Orange tool is utilized for data pre-processing, significant feature identification using correlation methods and predictions using different prediction algorithms with its comparative evaluation. The Orange tool is open source data mining software which perform data visualization, data analysis, and model developement. For the regression problem, the Orange software generates four performance metrics, namely, MSE, RMSE, MAE, and R2. All these performance metrics were applied to compare prediction model performance. The limiation is that, users do not have a choice to choose the performance metrices. For the classification problem the software generated evaluation metrices are namely Precision, Recall, F‐Measure, Accuracy, and RMSE [18].
Table 13 and Table 14 show similar prediction performance results based on regression and classification prediction models, respectively. In both prediction models, the AB algorithm performed better, with an accuracy of 97% to 99% in predicting PIH. The MLR prediction model, on the other hand, is only relevant in the regresion prediction model.
Table 13. Performance of individual algorithms based regression prediction
|
Sr. No. |
Algorithm |
MSE |
RMSE |
MAE |
R2 |
|
1 |
SVM |
0.165 |
0.407 |
0.334 |
0.706 |
|
2 |
SGD |
0.147 |
0.383 |
0.308 |
0.739 |
|
3 |
MLP |
0.130 |
0.360 |
0.271 |
0.769 |
|
4 |
KNN |
0.121 |
0.347 |
0.191 |
0.786 |
|
5 |
MLR |
0.095 |
0.309 |
0.247 |
0.830 |
|
6 |
DT |
0.063 |
0.251 |
0.126 |
0.888 |
|
7 |
GB |
0.031 |
0.175 |
0.046 |
0.945 |
|
8 |
RF |
0.017 |
0.132 |
0.032 |
0.969 |
|
9 |
AB |
0.014 |
0.120 |
0.014 |
0.975 |
Note: SVM- Support Vector Machine, SGD- Stochastic Gradient Descent , MLP- Multi-layer Perceptron , KNN- k-Nearest Neighbors, MLR- Multiple Linear Regression, DT- Decision Tree, GB- Gradient Boosting, RF- Random Forest, AB- Adaptive Boosting
Table 14. Classification prediction using machine learning algorithms
|
Model |
AUC |
CA |
F1 |
Precision |
Sensitivity |
Accuracy |
|
SGD |
67% |
69% |
64% |
61% |
69% |
69% |
|
MLP |
89% |
76% |
73% |
76% |
76% |
78% |
|
kNN |
96% |
79% |
76% |
78% |
79% |
79% |
|
SVM |
92% |
84% |
84% |
84% |
84% |
84% |
|
DT |
97% |
91% |
91% |
91% |
91% |
91% |
|
RF |
98% |
93% |
92% |
95% |
93% |
93% |
|
GB |
99% |
97% |
97% |
97% |
97% |
97% |
|
AB |
99% |
99% |
99% |
99% |
99% |
99% |
Note: SVM- Supoort Vector Machine, SGD- Stochastic Gradient Descent, MLP- Multi-layer Perceptron, KNN- k-Nearest Neighbors, MLR- Multiple Linear Regression, DT- Decision Tree, GB- Gradient Boosting, RF- Random Forest, AB- Adaptive Boosting, AUC- Area under curve, CA- Classification accuracy
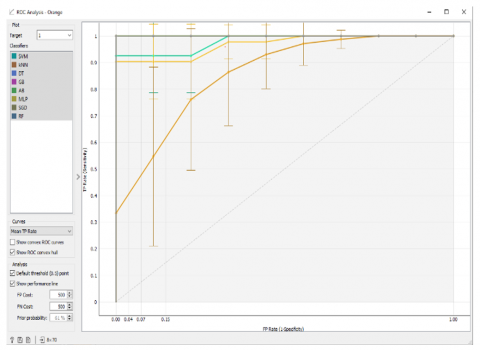
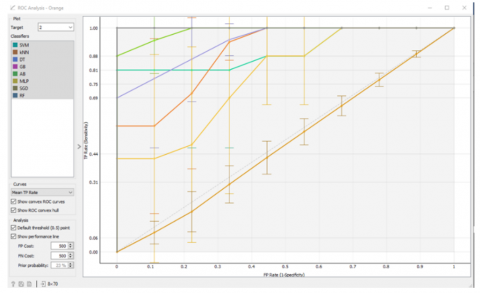
(a) Target 1 classifier for Low Risk of PIH
(b) Target 2 classifier for Moderate risk of PIH
(c) Target 3 classifier for High Risk of PIH
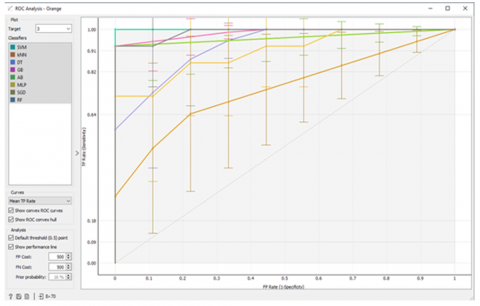
Figure 11. Different models ROC curve-based classification prediction evaluation
Evaluating the ROC curve (Figure 11) and the area under the ROC curve (Table 13 and Table 14) for the algorithms run in the second stage of modelling revealed that the AB algorithm shows better prediction resuts in all PIH targets.
3.1 Discussion
Leelavathi et al. studied the efficacy of Uterine Artery Doppler Ultrasonography and the roll-over test in predicting pregnancy-induced hypertension. The antenatal women were screened with Doppler artery ultrasonography at the gestational age of eleven to thirteen weeks. The women were followed up at twenty-one to twenty-four weeks, and the roll-over test was performed at twenty-eight to thirty-two weeks to see if they were at high risk for pre-eclampsia and eclampsia [19]. In the current study, 37.1% of women were at high risk for pregnancy-induced hypertension. Blood pressure, mean arterial pressure (MAP), platelet count, and urine albumin tests were performed on these 26 women. About 53.8% (14) of women were significantly at high risk for hypertension prediction. In detail, approximately 92.31% of women had blood pressure levels higher than 140/90 mmHg.
Antenatal women with a positive roll-over test possess a significantly higher risk of having a small gestational age baby. It was confirmed during their antenatal check-ups by ultrasonography and examination of pre-pregnancy and pregnancy weight gain. Women who weigh fifty kilograms or less and gain less than ten kilograms during pregnancy or who have a weight gain disparity of 20% or less, pose a significant risk for developing Small for Gestational Age (SGA) fetus [20]. Women with a positive GESTOSIS score had a significantly high SGA fetus in the current study, a mean arterial pressure greater than 100 mmHg, and elevated urine albumin levels. About 30% of women’s placental and fetal weights were not correlated with gestational age; they were observed to be lower than expected values.
However, previous research conducted by Kaypour et al. [21], they concluded that the roll-over test alone cannot predict pregnancy-induced hypertension but if this test is combined it with other predictive tools such as Doppler artery ultrasonography and the GESTOSIS score can provide more accurate results in predicting hypertensive diseases in pregnancy. According to Andersen [22], single tools, such as the roll-over test, are insufficiently sensitive and specific as a screening test. Finally, Marshall and Newman [23] suggested that roll-over tests be combined with other predictive tools to achieve more positive results.
Sufriyana et al. looked into validating an artificial intelligence (AI) tool for predicting pregnancy-induced hypertension. The data set includes 95 personal characteristics and the medical history of pregnant women. Six algorithms for comparison were created by automating the receiver operating characteristics curve (AUROC). This economic model was primarily used to predict PIH [24]. The predictive analytics software acts as an artificial intelligence in obstetrics, assisting in diagnosing preeclampsia. Machine learning algorithms will aid in improving the accuracy of preeclampsia risk calculation in pregnant women [25].
The Expert System for Preeclampsia Prevention Program (ESPPP) is used to detect pregnancy-induced hypertension. This program uses pragmatic criteria to diagnose and recommend treatment for PIH [26]. Marin I et al. used a non-invasive technique to detect the presence of preeclampsia.
The blood pressure is measured using an i-bracelet Eurostars smart bracelet, an “Intelligent bracelet for blood pressure monitoring and detection of preeclampsia.” Every pregnant woman’s age, weight, and blood pressure measurements are used as input data. A series of hidden states comprised the prediction model [27]. Zhang X et al. studied the relationship between blood data characteristics of antenatal women in severe PIH [28].
According to a retrospective study, uric acid, erythrocyte haemoglobin concentration, globulin, platelet distribution width, potassium ion, age, family history of hypertension, systolic blood pressure, diastolic blood pressure, pulse, and gestational age greater than 34 weeks were independent risk factors for prediction of preeclampsia. The optimal Light 5 GBM algorithm parameters were discovered using a 5-fold cross-validation algorithm after screening these independent risk factors using univariate analysis and logistic regression analysis. The preeclampsia prediction model based on the Light GBM machine learning algorithm has a higher prediction effect for prediction of PIH [29].
Today, there are numerous diagnostic methods available to detect hypertensive pregnancy disorders. However, they are not always available to pregnant women, especially in sub-centers and primary health care centers. The GESTOSIS score is a simple predictive tool that all front-line health care workers can use. Preeclampsia can be predicted early on, and pregnant women can receive definitive treatment at the appropriate time to reduce the negative outcome of the pregnancy. The GESTOSIS score scale can be used in primi and multipara mothers with a history of PIH. The GESTOSIS score is endorsed by the Federation of Obstetrics and Gynecological Society in India (FOGSI). This tool is considered a low-cost alternative to other tests and simultaneously ensures the efficacy of the test. It is a simple, cost-effective, and economic scale that can be employed during the initial assessment of all antenatal women to predict the risk of pregnancy-induced hypertension. Based on the parameters of the GESTOSIS score scale, various machine learning algorithms can be employed to predict pre-eclampsia.
This study provides information regarding the associating factors responsible for predicting pregnancy-induced hypertension. Early prediction helps to provide accurate treatment to pregnant women at the right time. In this study, it is attested that the adoption of data mining techniques on the medical data has a large scope for diagnosis and prediction of diseases that indicates the medical professionals to provide the preliminary care for life-threatening disease conditions. Data mining techniques help in enhancing care and maximizing salvage rates. In this article, various prediction machine-learning algorithms are deployed on medical data sets to understand the risk factors responsible for causing PIH. This study recommends that future researchers apply a sequential model to this data set, including a recursive deep neural network that increases the accuracy levels in predicting PIH. This study concludes to state that provided factors comprised in the GESTOSIS score optimally can be used on the optimal dataset for the prediction of PIH.
The researchers have been continuously supported by the management of Symbiosis College of Nursing and Symbiosis International (Deemed University) (SIU) and administration YCM hospitals, and the participants for this study.
[1] Abalos, E., Cuesta, C., Carroli, G., Qureshi, Z., Widmer, M., Vogel, J.P., Souza, J.P., WHO Multicountry Survey on Maternal and Newborn Health Research Network. (2014). Pre-eclampsia, eclampsia and adverse maternal and perinatal outcomes: A secondary analysis of the World Health Organization Multicountry Survey on Maternal and Newborn Health. BJOG: An International Journal of Obstetrics and Gynaecology, 121(Suppl 1): 14-24. https://doi.org/10.1111/1471-0528.12629
[2] Program, N.H.B.P.E. (2000). Report of the national high blood pressure education program working group on high blood pressure in pregnancy. American Journal of Obstetrics and Gynecology, 183(1): s1-s22. https://doi.org/10.1067/mob.2000.107928
[3] American College of Obstetricians and Gynecologists. (2019). ACOG practice bulletin no. 202: Gestational hypertension and preeclampsia. Obstet Gynecol, 133(1): e1-e25. https://doi.org/10.1097/aog.0000000000003018
[4] Stella, C.L., Sibai, B.M. (2006). Preeclampsia: Diagnosis and management of the atypical presentation. The Journal of Maternal-Fetal & Neonatal Medicine, 19(7): 381-386. https://doi.org/10.1080/14767050600678337
[5] Rojas-Arias, J.L., Ortiz-López, L.D., Orduña-Aparicio, W.J., Quintero-Loaiza, C.A., Acuña-Osorio, E., Franco-Hernández, A., Parra-Saavedra, M., Molina-Giraldo, S., Figueras, F. (2015). Characterization of atypical preeclampsia. Fetal Diagnosis and Therapy, 38(2): 119-125. https://doi.org/10.1159/000369553
[6] Roberts, J.M., August, P.A., Bakris, G., et al. (2013). Hypertension in Pregnancy. American College of Obstetricians and Gynecologist. Washington DC.
[7] Henderson, J.T., Whitlock, E.P., O’Connor, E., Senger, C.A., Thompson, J.H., Rowland, M.G. (2014). Low-dose aspirin for prevention of morbidity and mortality from preeclampsia: A systematic evidence review for the US Preventive Services Task Force. Annals of Internal Medicine, 160(10): 695-703. https://doi.org/10.7326/M13-2844
[8] Atallah, A., Lecarpentier, E., Goffinet, F., Doret-Dion, M., Gaucherand, P., Tsatsaris, V. (2017). Aspirin for prevention of preeclampsia. Drugs, 77(17): 1819-1831. https://doi.org/10.1007/s40265-017-0823-0
[9] Bibbins-Domingo, K., Grossman, D.C., Curry, S.J., Barry, M.J., Davidson, K.W., Doubeni, C.A., Epling, J.W., Jr, Kemper, A.R., Krist, A.H., Kurth, A.E., Landefeld, C.S., Mangione, C. M., Phillips, W.R., Phipps, M.G., Silverstein, M., Simon, M.A., Tseng, C.W. (2017). Screening for preeclampsia: US preventive services task force recommendation statement. JAMA: The Journal of the American Medical Association, 317(16): 1661-1667. https://doi.org/10.1001/jama.2017.3439
[10] Henderson, Jillian T., Thompson, J.H., Burda, B.U., Cantor, A. (2017). Preeclampsia screening: Evidence report and systematic review for the US preventive services task force. JAMA: The Journal of the American Medical Association, 317(16): 1668-1683. https://doi.org/10.1001/jama.2016.18315
[11] Rolnik, D.L., Wright, D., Poon, L.C., O’Gorman, N., Syngelaki, A., de Paco Matallana, C., Akolekar, R., Cicero, S., Janga, D., Singh, M., Molina, F.S., Persico, N., Jani, J.C., Plasencia, W., Papaioannou, G., Tenenbaum-Gavish, K., Meiri, H., Gizurarson, S., Maclagan, K., Nicolaides, K.H. (2018). Aspirin versus placebo in pregnancies at high risk for preterm preeclampsia. Obstetric Anesthesia Digest, 38(1): 20-21. https://doi.org/10.1097/01.aoa.0000529983.77883.af
[12] Mandrupkar, G. (2019). Hypertensive Disorders in Pregnancy (HDP) Good Clinical Practice Recommendations 2019. The Federation of Obstetric and Gynaecological Societies of India. https://www.fogsi.org/wp-content/uploads/gcpr/hdp-fogsi-gestosis-icog-gcpr-2019.pdf, accessed on Oct. 23, 2022
[13] Koteluk, O., Wartecki, A., Mazurek, S., Kołodziejczak, I., Mackiewicz, A. (2021). How do machines learn? Artificial intelligence as a New Era in medicine. Journal of Personalized Medicine, 11(1): 32. https://doi.org/10.3390/jpm11010032
[14] Chok, N.S. (2010). Pearson's versus Spearman's and Kendall's correlation coefficients for continuous data. Doctoral dissertation, University of Pittsburgh.
[15] Orange‐Software. https://orange.biolab.si/ widget-catalog, accessed on Jan. 17, 2020.
[16] Amala, G. (2019). Orange tool approach for comparative analysis of supervised learning algorithm in classification mining. Journal of Analysis and Computation, 13(1): 1-10.
[17] Ramnath, G.S., Harikrishnan, R. (2022). Problem-based learning on household electricity consumption analysis using predictive models and tools. Computer Applications in Engineering Education, 30(6): 1656-1672. https://doi.org/10.1002/cae.22548
[18] Ramnath, G.S., Harikrishnan, R. (2021). A statistical and predictive modeling study to analyze impact of seasons and COVID-19 factors on household electricity consumption. Journal of Energy Systems, 5(4): 252-267. https://doi.org/10.30521/jes.933674
[19] Leelavathi, L., S., K. (2016). Role of uterine artery Doppler and roll over test in prediction of pregnancy induced hypertension. International Journal of Reproduction, Contraception, Obstetrics and Gynecology, 5(10): 3556-3559. https://doi.org/10.18203/2320-1770.ijrcog20163443
[20] Verma, U.L., Tejani, N.A., Chatterjee, S., Weiss, R.R. (1980). Screening for SGA by the roll-over test. Obstetrics and Gynecology, 56(5): 591-594.
[21] Kaypour, F., Masomi Rad, H., Ranjbar Novin, N. (2006). The predictive value of serum uric acid, roll-over test, and body mass index in pre-eclampsia. International Journal of Gynaecology and Obstetrics, 92(2): 133-134. https://doi.org/10.1016/j.ijgo.2005.10.017
[22] Andersen, G.J. (1980) The roll-over test as a screening procedure for gestational hypertension. Australian and New Zealand Journal of Obstetrics and Gynaecology, 20(3): 144-146. https://doi.org/10.1111/j.1479-828X.1980.tb02893.x
[23] Marshall, G.W., Newman, R.L. (1977). Rollover test. American Journal of Obstetrics & Gynecology, 127(6): 623-625.
[24] Sufriyana, H., Wu, Y.W., Su, E.C.Y. (2020). Artificial intelligence-assisted prediction of preeclampsia: Development and external validation of a nationwide health insurance dataset of the BPJS Kesehatan in Indonesia. EBioMedicine, 54(102710): 102710. https://doi.org/10.1016/j.ebiom.2020.102710
[25] Ivshin, A.A., Bagaudin, T.Z., Gusev, A.V. (2021). Artificial intelligence technologies in predicting preeclampsia. Obstetrics Gynecology and Reproduction, 15(5): 576-585. https://doi.org/10.17749/2313-7347/ob.gyn.rep.2021.229
[26] Matamoros, A., Torrealba, A., Rivas, F., González, S., Sánchez, R., Molina, L., Rivas-Echeverría, C. (2005). Expert system for the preeclampsia prevention program. In Proceedings of the 4th WSEAS International Conference on Computational Intelligence. Manmachine Systems and Cybernetics (MSC’05) Miami USA, pp. 146-149.
[27] Marin, I., Pavaloiu, B.I., Marian, C.V., Racovita, V., Goga, N. (2019). Early detection of preeclampsia based on a machine learning approach. 2019 E-Health and Bioengineering Conference (EHB). https://doi.org/10.1109/EHB47216.2019.8970025
[28] Zhang, X., Chen, Y., Salerno, S., Li, Y., Zhou, L., Zeng, X., Li, H. (2022). Prediction of severe preeclampsia in machine learning. Medicine in Novel Technology and Devices, 15(100158): 100158. https://doi.org/10.1016/j.medntd.2022.100158
[29] Zheng, J.Y., Zhu, R., Yan, Y.J., Zhou, Y., Luo, Y.L. (2022). Construction of prediction model of preeclampsia based on machine learning algorithm. Medical Journal of Chinese People’s Liberation Army, 47(8): 802-808. https://doi.org/10.11855/j.issn.0577-7402.2022.08.0802