Suguna G. Chickaramanna | Sondekere Thippeswamy Veerabhadrappa* | Puranik Math Shivakumaraswamy | Seenapahalli Nanjundaiah Sheela | Shivapura Krishna Keerthana | Umesh Likith | Likith Swaroop | Vasudevarao Meghana
© 2022 IIETA. This article is published by IIETA and is licensed under the CC BY 4.0 license (http://creativecommons.org/licenses/by/4.0/).
OPEN ACCESS
Detection of Atrial fibrillation (AF) is more complex as compared to other cardiac diseases. It requires lengthy ECG signals and more time for visual inspection and analysis by the physicians. Automatic detection of AF using an expert system is essential for the investigation of ECG signals. In this study, the Physionet challenge 2017 dataset is used for the detection and classification of AF versus other signals. In this paper, ECG signals are segmented into a sample size of 250 samples for the detection of Wavelet Packet Decomposition (WPD) and approximate entropy (ApEn) features for classification. In addition to WPD and ApEn, statistical features were derived from ECG signals. The Principal Component Analysis (PCA) has been used to reduce the dimensionality of the features based on the rank. Ensemble classifiers such as AdaBoost, XGBoost and Random Forest (RF) are used for classification. The accuracy of 62.91%, 70.33% and 89% for the AdaBoost, XGBoost and Random Forest respectively. We found RF classifier is suitable for classifying AF, normal rhythm and other non-AF related abnormal heart rhythms.
atrial fibrillation, ECG, wavelet packet decomposition, approximate entropy, ensemble classifier, wavelet packet entropy
The Electrocardiogram is the most reliable method used to measure the electrical activity of the human heart. The ECG is used for the analysis and diagnosis of the cardiac condition of the patients. The morphological changes in ECG signal help us to detect and prediction of cardiac diseases in the patients and the most common disease is arrhythmia which is characterized by irregular heartbeats in the heart rhythm. Even minor changes in ECG pattern may lead to cardiac arrhythmias, as a result, change in irregularities in the heart rate, conduction of cardiac muscles leading to chest pain, tiredness, and loss of consciousness. Cardiac arrhythmias are classified into several types, some of them are life threatening and a few arrhythmias are not dangerous, but still, it requires the proper analysis to avoid future clinical problems.
Atrial fibrillation (AF) is a supraventricular tachyarrhythmia. The occurrence of AF is due to the disorder in the rhythm leading, the abnormal atrial foci beating [1], triggered rhythm [2], or there is atrial re-entry in the atria [3, 4]. The diagnosis of AF is becoming a challenge in the modern world due to paroxistic behavior and the absence of symptoms in some cases. Atrial fibrillation (AF) is a cardiac pathology which is currently the most common cardiac rhythm disorder, characterized by the atrium chaotic contraction.A long electrocardiogram recording is required to detect the AF as appearing infrequently in the ECG signal. To analyze longer ECG recordings manually requires great time, as well as more effort, hence the automatic detection of ECG arrhythmias provides great support to physicians [5, 6].
Many research groups have been proposed for automatic detection and classification of various types of arrhythmias [7-13].
Clifford and Azuaje [14] emphases on physiology activity of the ECG signal. Several reseachers have classified arrhythmia based on heartbeats, fiducial points, QRS duration and RR intervals [15-22] where the variation are predomaint for the classification. Principal Component Analysis (PCA) [23-25], or Independent Component Analysis (ICA) were used to reduce the feature vector where heartbeat is represented by coefficients of the vector. Non linear structure Kernel Principal Component Analisys, Generalized Discriminant Analysis (GDA) [26] have better performance compared to PCA [25]. Few researchers have empolyed wavelet methods [26-28] and found Daubechies [29] with the order 2 was suitable for high accuracy classification.
Ye et al. [30] proposed an algorithm based on morphology and dynamics of ECG to classify sixteen types of arrhythmias. Several methods are developed for automatic detection of arrhythmia and ECG classification. At present, there are several classification and regression methods, employed for automatic detection of ECG arrhythmia, like time-domain parameters, frequency analysis and nonlinear approaches [31], K-Nearest Neighbors [32], Artificial Neural Network [33], linear discriminant (LD) classifier [34] Support Vector Machine [35], Probabilistic Neural Network [36], multi-layer perceptron [37], Genetic Algorithms and particle swarm optimization (PSO) [38] and path forest [39].
In this paper, Ensemble Classifiers with wavelet packet decomposition (WPD) coefficients and Approximate Entropy are used to classify the four classes of ECG signals. This paper includes methodology, results and discussions followed by the conclusion.
2.1 Overview
In this study, the Physionet challenge 2017 dataset is used to classify Atrial Fibrillation, normal rhythm, noisy and other non-AF related abnormal heart rhythms. The range of cleaned ECG signals is between 0.05 Hz to 100 Hz. Raw ECG signal contains different types of high-frequency noises such as power line interference, Electromyogram/motion noises and low-frequency noises such as baseline drift, electrode contact noise, which highly corrupts the ECG signal. Therefore, removing the noisy portions in the ECG signal is considered to be an important process before feature extraction and classification.
To eliminate low-frequency noises and baseline wander, the FIR filter was implemented with cutoff frequency [0.5, 2] Hz and normalized frequency to Nyquist frequency (Fs/2). The filter order was taken as 5 as it work well with ECG signals and the attenuation at cutoff frequencies was fixed at 3dB. The notch filter is designed with a quality factor of 30, to remove power line interference of 50/60Hz and to obtain a cleaned ECG signal. After preprocessing the ECG signal were segmented into small segments with a duration of 800 to 1000 ms. The features were extracted from the segmented ECG, such as wavelet packet decomposition (WPD) coefficients, ApEn and statical features. These features were trained with ensemble classifiers to classify the arrhythmia. The structure of ECG classification is shown in Figure 1.
Figure 1. Block diagram of ECG classification
2.2 Feature extraction
For the classification of ECG signal, data feature extraction is the crucial step and it aims to extract the non-redundant and informative features from the raw ECG signal [35]. All the extracted features contain the relevant information of the input signal which can be used as an input to train the model to classify the signal.
2.2.1 Wavelet packet decomposition
Discrete Wavelet Transform (DWT) is the most powerful tool used for analyzing the signal in the time-frequency domain. DWT decomposes the original signal into approximation coefficients (ACs) and detail coefficients (DCs) in which the approximation coefficients (ACs) capture the high scale information and low-frequency component of the input signal whereas, the detail coefficients (DCs) capture the low scale information and a high-frequency component of the input signal. In DWT, only approximation coefficients are further decomposed into new ACs and DCs but the DCs remains unchanged. As Discrete Wavelet Transform decomposes only ACs components in each layer and the extraction of information from DCs is very difficult. Wavelet Packet Decomposition (WPD) decomposes DCs in each level along with ACs simultaneously which provides additional high-frequency components of an ECG signal [40-42]. The structure diagram of three-layer wavelet packet decomposition is shown in Figure 2. A three-level WPD tree is sufficient for the classification of ECG signals.
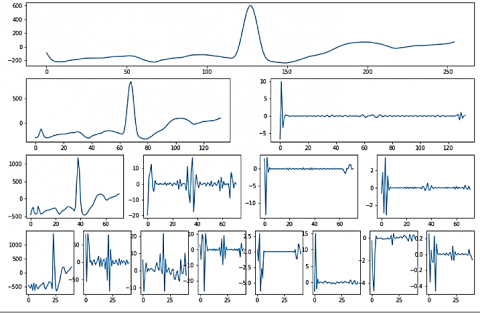
Figure 3 shows the three-level wavelet packet decomposition of ECG signal, where each node has both the DCs as well as ACs components which yield, more features. It is seen from Figure 3 first and second decomposition levels, decomposition of the approximate coefficients (low-pass filter) resembles the corresponding original signal, whereas the detail coefficient (high-pass filter) decomposition varies with the original signal and this might be due to the lower cutoff frequency remains unchanged whereas higher cutoff frequency changes at these levels.
Figure 2. Structure diagram of three-layer wavelet packet decomposition
Figure 3. Three levels Wavelet packet decomposition of ECG signal
The decomposition of the wavelet packets is estimated recursively using Eq. (1):
$\left\{\begin{array}{c}d w_{0,0}(t)=E C G(t) \\ d w_{i, 2 j-1}(t)=\sqrt{2} \sum_k h(x) d_{i-1 . j}(2 t-x) \\ d w_{i, 2 j}(t)=\sqrt{2} \sum_k g(x) d_{i-1 . j}(2 t-x)\end{array}\right.$ (1)
where, g(x) and h(x) are low-pass filter and high-pass filter respectively, and at the ith level for the jth node, dwi,j is the reconstruction signals (coefficients) from WPD.
2.2.2 Approximate entropy
Pincus first introduced the approximate entropy (ApEn) algorithm, which measures the complexity of a time series [43]. The approximate entropy depends on the length of the series, embedded dimension length and tolerance window M, n and r respectively. The lower and higher value of ApEn indicates the similarities and dissimilarities between the two cardiac cycles respectively. The ApEn of each ECG signal data set can be estimated. The ECG signal is segmented into 250 samples, which consists of at least one cardiac cycle. The ApEn is calculated between consecutive segments of ECG signals after three-level WPD.
ECG_S (n)=[ECG (1), ECG (2) ………. ECG (M)], where M is the total number of ECG segments.
(a) Form m-vectors, ECG_V (1) to ECG_V (M-n+1) interpreted by:
$E C G_{V(i)}=\left[\begin{array}{c}E C G_{-} S(i,:), E C G_{-} S(i+1,:), \ldots \\ \ldots \ldots E C G_{-} S(i-n+1,:)\end{array}\right]$ (2)
where, i=1, 2, …….., (M-n+1).
(b) Determine the distance between vectors ECG V I and ECG V (j) by calculating the absolute maximum difference between their scalar components.
$d\left[E C G_{V(i)}, E C G_{V(j)} \right]=_{k=0, m-1}^{\max }\left[\mid\begin{array}{c}E C G_{-} S(i+k)- \\ E C G_{-} S(j+k)\end{array} \mid\right]$ (3)
(c) Compute $\mathrm{C}_{\mathrm{r}}^{\mathrm{n}} \mathrm{(i)}$ for each i, for i=1, 2,………(M-n+1).
$\mathrm{C}_{\mathrm{r}}^{\mathrm{n}}(\mathrm{i})=\frac{\mathrm{v}^{\mathrm{n}}(\mathrm{i})}{\mathrm{M}-\mathrm{n}+1}$ (4)
where, Vn (i)=number of d[ECG_V(i), ECG_V(j)]<r.
(d) Compute $\Phi^{\mathrm{n}}(\mathrm{r})$ by taking the natural logarithm of each $\mathrm{C}_{\mathrm{r}}^{\mathrm{n}} \mathrm{(i)}$ and average it over i as defined in step (b).
$\Phi^n(r)=\frac{1}{M-n+1} \sum_{i=1}^{M-n+1} \ln \left(C_r^n\right)$ (5)
Increment the embedded dimension to n+1 and repeat the steps a-d.
(e) Evaluate ApEn values for a finite data length.
$A p E n(M, n, r)=\Phi^n(r)-\Phi^{n+1}(r)$ (6)
In this analysis, the values were chosen as n=1 or n=2 and tolerance window r=0.20 times the standard deviation of the time series.
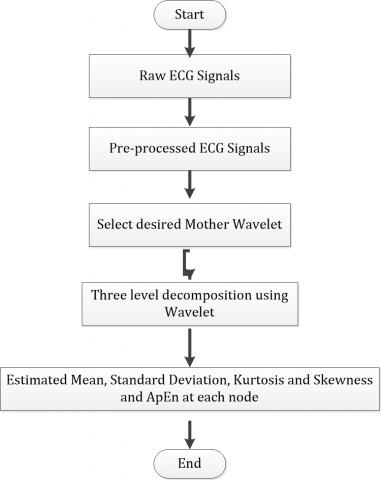
2.2.3 The procedure for feature extraction
From the ECG signals, the features were extracted by performing the following steps as depicted in the Figure 4.
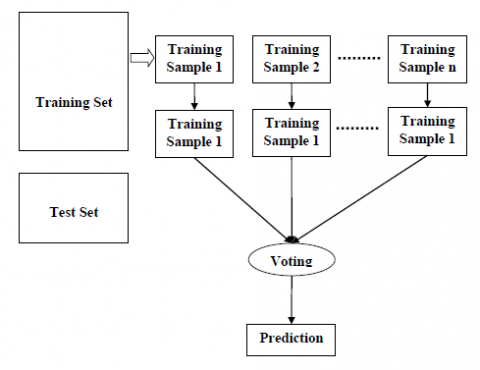
2.3 Random Forest
Random Forest (RF), is an ensemble supervised machine learning algorithm proposed by Breiman [44]. With the strategy of bagging the RF builds many classification trees by selecting some random features from randomly selected samples and finally employing voting it selects the best solution. The RF classifiers handle large data scales, both numeric and categorical variables more efficiently. It uses fewer features, and also it provides minimum classification error for unbalanced datasets. The normalization of variables is not necessary for RF and also reduces the over-fitting of the data, hence it provides superior performance in classification. Figure 5 depicts the Random Forest Classifier algorithm's flowchart.
Figure 4. Procedure for feature extraction
Figure 5. Flowchart of random forest classifier algorithm
Algorithm:
The basic working flow of Random Forest classifiers is depicted as
Step a−Select the samples randomly from the given dataset.
Step b–Create a decision tree for each randomly selected sample using the bagging strategy, and then use the decision tree to predict the outcome.
Step c–Every predicted result is based on the voting performance.
Step d–The prediction result with the most votes is chosen as the final prediction result.
The classifier’s performance is evaluated using the statistical indices namely sensitivity (recall), positive predictivity (precision), F1 score, and accuracy (ACC) which provides clairvoyance of the algorithm. These performance metrics were derived from true positive (TP), true negative (TN), false positive (FP), and false-negative (FN). In the classification of ECG signal, TP stands for the number of outcomes that the model predicted correctly of all the positive classes, while TN stands for the number of outcomes that the model predicted correctly of all the negative classes, and FP is the number of outcomes from all positive classes that model predicted incorrectly, while FN denotes the number of outcomes from all negative classes that model predicted incorrectly. The performance metric of the classifier is given below:
$Accuracy=\frac{\mathrm{TP}+\mathrm{TN}}{(\mathrm{TP}+\mathrm{TN}+\mathrm{FP}+\mathrm{FN})} * 100 \%$ (7)
$\mathrm{F}_1=\frac{\mathrm{TP}}{\mathrm{TP}+0.5(\mathrm{FP}+\mathrm{TP})} * 100 \%$ (8)
Predictivity $=\frac{\mathrm{TP}}{\mathrm{TP}+\mathrm{FP}} 100 \%$ (9)
Sensitivity $=\frac{\mathrm{TP}}{\mathrm{TP}+\mathrm{FN}} * 100 \%$ (10)
An ideal ECG classifier should achieve high recall, precision, F1 score and accuracy.
An ensemble approach for the categorization of AF and other arrhythmias from brief segments of ECG signals was given in this study. The detection of atrial fibrillation from ECG signals is the most difficult task due to the high variability of the signals between different patients. In addition to the advantages of WPD and RF, we have also faced some important issues while choosing the appropriate mother wavelet for WPD. In the present study, we used three mother wavelets db6, db8 and db16 from the Daubechies wavelets family. Three-level decomposition was performed on the original ECG signal for the analysis and extraction of features from WPD. In addition to approximate and detail coefficients, approximate entropy, higher-order statistical features were also estimated from the three-level decomposition. The features extracted from the dataset are shown in Table 1. The ANOVA test was performed to determine the significance of the features and was found to be statistically more significant. From Table 1, it was observed that extracted features show a significant difference between atrial fibrillation and other classes. It is observed that the mean value was high for AF when compared with other classes and also the entropy and kurtosis values were low for AF than the other remaining classes. All these variations in the statistical features of AF, when compared with other classes, might be due to the disorganized atrial activity and contraction leading to a typical electrical transmission to the AV node and ventricles. Hence all these features have a significant contribution to training the model.
The accuracy results of each wavelet family are represented in below Table 2. The Db6 wavelet from the Daubechies family with three-level decomposition achieves the high accuracy of 89% when compared to the other Daubechies wavelets after using the Principal Component Analysis technique which speeds up the computation by reducing the dimension of the larger dataset which is slightly better when compared to the other Daubechies wavelets. The wavelets from the Daubechies family are more effective for ECG classification than any other wavelet family. Usually, the three-level decomposition achieves effective results for all mother wavelets.
Table 1. List of extracted features
|
|
AF |
Normal |
Others |
Noisy |
|
AAA3_mean |
15.5259 ± 1.2357 |
1.1075 ± 12.4976 |
-0.0771 ± 26.3460 |
3.3604± 35.6352 |
|
AAA3_entropy |
0.0582 ± 0.4530 |
0.4190 ± 0.07088 |
0.4093 ± 0.0712 |
0.3651± 0.0443 |
|
AAA3_skew |
1.9136 ± 1.9019 |
2.1367 ± 2.3240 |
1.8855 ± 2.1764 |
0.2655± 0.6850 |
|
AAA3_kurtosis |
7.5245 ± 14.0300 |
18.6347 ± 6.3132 |
16.2710 ± 7.3401 |
3.1582± 2.2595 |
|
DAA3_mean |
0.0067 ± 0.0003 |
0.0001 ± 0.0032 |
0.0002 ± 0.0093 |
0.0031± 0.0193 |
|
DAA3_entropy |
0.0496 ± 0.2858 |
0.2927 ± 0.0573 |
0.2829 ± 0.0618 |
0.3447± 0.0417 |
|
DAA3_skew |
0.3291 ± 0.18285 |
0.3456 ± 0.3215 |
0.2607± 0.3727 |
0.0525± 0.4063 |
|
DAA3_kurtosis |
2.2443 ± 9.47851 |
10.5032 ± 2.3772 |
9.9987 ± 2.6886 |
7.7612± 1.6298 |
|
ADA3_mean |
0.1076 ± 0.0048 |
-0.0005 ± 0.0408 |
-0.0006 ± 0.1289 |
-0.0369± 0.2973 |
|
ADA3_entropy |
0.0546 ± 0.3269 |
0.3395 ± 0.0575 |
0.3260 ± 0.0618 |
0.3662± 0.0369 |
|
ADA3_skew |
0.2876 ± 0.1123 |
0.1871 ± 0.2297 |
0.1381 ± 0.3323 |
0.0862± 0.3155 |
|
ADA3_kurtosis |
2.2762 ± 8.5390 |
9.1337 ± 2.2197 |
8.8927 ± 2.5922 |
7.0703± 1.8062 |
|
DDA3_mean |
0.0576 ± 0.0001 |
0.0004 ± 0.0244 |
-0.0010± 0.0882 |
0.0225± 0.1824 |
|
DDA3_entropy |
0.0310± 0.1015 |
0.1315± 0.0333 |
0.1168± 0.0382 |
0.0641± 0.0119 |
|
DDA3_skew |
0.4169 ± 0.05200 |
0.0580± 0.6653 |
0.0391± 0.6365 |
-0.0154± 0.3627 |
|
DDA3_kurtosis |
0.9160 ± 11.5430 |
10.8351± 0.9293 |
11.2004± 1.1166 |
11.5943± 0.8606 |
|
AAD3_mean |
2.7645 ± 2.05276 |
2.0084± 2.6989 |
1.9753± 3.0284 |
1.6370± 6.5957 |
|
AAD3_entropy |
0.0870 ± 0.3859 |
0.3769± 0.0966 |
0.3746± 0.0954 |
0.4212± 0.0328 |
|
AAD3_skew |
1.2503 ± 0.8280 |
1.2359± 1.7212 |
1.0673± 1.5287 |
0.0871± 0.4093 |
|
AAD3_kurtosis |
5.5347 ± 12.6153 |
17.1078± 4.5010 |
14.9455± 5.4853 |
4.6292± 2.5807 |
|
DAD3_mean |
0.0988 ± 0.0207 |
-0.0066± 0.0969 |
-0.0111± 0.1129 |
0.1405± 0.3058 |
|
DAD3_entropy |
0.0775 ± 0.3884 |
0.3783± 0.0868 |
0.3783± 0.0852 |
0.4309± 0.0445 |
|
DAD3_skew |
1.7973 ± 0.5931 |
-0.6267± 2.5976 |
-0.5486± 2.2961 |
0.1664± 0.6753 |
|
DAD3_kurtosis |
5.3591 ± 13.3725 |
17.6765± 5.0416 |
15.7190± 5.6784 |
6.1239± 2.5699 |
|
ADD3_mean |
0.0961 ± 0.4069 |
0.3846± 0.1097 |
0.3891± 0.1061 |
0.4474± 0.0469 |
|
ADD3_entropy |
1.6404 ± 0.8587 |
-1.1866± 1.8812 |
-1.0534± 2.0010 |
-4.1070± 7.5698 |
|
ADD3_skew |
1.8183± 0.1174 |
-0.5141± 2.4720 |
-0.3672± 2.2022 |
-0.3515± 0.4955 |
|
ADD3_kurtosis |
6.2192± 15.11690 |
19.7330± 5.1231 |
17.4770± 6.0586 |
6.4727± 2.7591 |
|
DDD3_mean |
0.1296± 0.1039 |
0.1128± 0.1287 |
0.1070± 0.1510 |
0.1500± 0.3558 |
|
DDD3_entropy |
0.0578± 0.3280 |
0.3464± 0.0581 |
0.3332± 0.0623 |
0.3547± 0.0359 |
|
DDD3_skew |
1.1310± 0.7079 |
1.4027± 1.5522 |
1.0537± 1.4589 |
0.0052± 0.8782 |
|
DDD3_kurtosis |
3.3965± 11.5120 |
10.6422± 2.3881 |
11.0627± 3.4925 |
11.5731± 3.7693 |
Table 2. Accuracy results of each wavelet family
|
Classifier |
Db6 |
Db8 |
Db16 |
|
Random Forest |
89.00 |
88.84 |
88.99 |
|
XGBoost |
70.33 |
71.39 |
70.45 |
|
AdaBoost |
62.51 |
57.83 |
62.56 |
In this paper, a comparative study of feature extraction and analysis of ECG signals was carried out with Wavelet Packet Decomposition using Daubechies wavelet family. The significance of features and the problem of imbalanced datasets were examined. The refinement of ECG signals using pre-processing methods and feature extraction using statistical measurements has proven to be an accurate and efficient method for ECG signal classification. The proposed method yields better results regardless of signal duration, whether complete ECG signals, parameters derived from signals-based ECG data, or down-sampled ECG signals. With Db6 wavelets, this approach based on feature extraction using multi-cumulants produces 89 percent accurate results for ECG signals. In future work, deep learning algorithms maybe improve classification accuracy.
[1] Gillette, P.C., Cravord, F.C., Zeigler, V.L. (1990). Mechanisms of atrial tachycardias. In: Zipes, D.P., Jalife, J. (eds.), Cardiac Electrophysiology: From Cell to Bedside, Saunders, Philadelphia, 559-563.
[2] Wit, A.L., Rosen, M.R. (1986). After depolarizations and triggered activity. In: H. A. Fozzard, E. Haber, R.B. Jennings (eds.), The Heart and Cardiovascular System, Raven Press, New York, 1449-1490.
[3] Haines, D.E., DiMarco, J.P. (1990). Sustained intraatrial reentrant tachycardia: clinical, electrocardiographic and electrophysiologic characteristics and long-term follow-up. Journal of the American College of Cardiology, 15(6): 1345-1354. https://doi.org/10.1016/S0735-1097(10)80025-7
[4] Tang, C.W., Scheinman, M.M., Van Hare, G.F., Epstein, L.M., Fitzpatrick, A.P., Lee, R.J., Lesh, M.D. (1995). Use of P wave configuration during atrial tachycardia to predict site of origin. Journal of the American College of Cardiology, 26(5): 1315-1324. https://doi.org/10.1016/0735-1097(95)00307-X
[5] De Chazal, P., Reilly, R.B. (2006). A patient-adapting heartbeat classifier using ECG morphology and heartbeat interval features. IEEE Transactions on Biomedical Engineering, 53(12): 2535-2543. https://doi.org/10.1109/TBME.2006.883802
[6] Mustaqeem, A., Anwar, S.M., Majid, M., Khan, A.R. (2017). Wrapper method for feature selection to classify cardiac arrhythmia. In 2017 39th Annual International Conference of the IEEE Engineering in Medicine and Biology Society (EMBC), Jeju, Korea (South), pp. 3656-3659. https://doi.org/10.1109/EMBC.2017.8037650
[7] Ebrahimzadeh, A., Shakiba, B., Khazaee, A. (2014). Detection of electrocardiogram signals using an efficient method. Applied Soft Computing, 22: 108-117. https://doi.org/10.1016/j.asoc.2014.05.003
[8] De Lannoy, G., François, D., Delbeke, J., Verleysen, M. (2011). Weighted conditional random fields for supervised interpatient heartbeat classification. IEEE Transactions on Biomedical Engineering, 59(1): 241-247. https://doi.org/10.1109/TBME.2011.2171037
[9] Poungponsri, S., Yu, X.H. (2013). An adaptive filtering approach for electrocardiogram (ECG) signal noise reduction using neural networks. Neurocomputing, 117: 206-213. https://doi.org/10.1016/j.neucom.2013.02.010
[10] Luz, E.J.D.S., Menotti, D., Schwartz, W.R. (2014). Evaluating the use of ECG signal in low frequencies as a biometry. Expert Systems with Applications, 41(5): 2309-2315. https://doi.org/10.1016/j.eswa.2013.09.028
[11] Zidelmal, Z., Amirou, A., Ould-Abdeslam, D., Merckle, J. (2013). ECG beat classification using a cost sensitive classifier. Computer Methods and Programs in Biomedicine, 111(3): 570-577. https://doi.org/10.1016/j.cmpb.2013.05.011
[12] Martis, R.J., Acharya, U.R., Min, L.C. (2013). ECG beat classification using PCA, LDA, ICA and discrete wavelet transform. Biomedical Signal Processing and Control, 8(5): 437-448. https://doi.org/10.1016/j.bspc.2013.01.005
[13] Mustaqeem, A., Anwar, S.M., Majid, M. (2018). Multiclass classification of cardiac arrhythmia using improved feature selection and SVM invariants. Computational and Mathematical Methods in Medicine, 2018: 7310496. https://doi.org/10.1155/2018/7310496
[14] Clifford, G., Azuaje, F., McSharry, P. (2006). Advanced Methods and Tools for ECG Data Analysis (Vol. 10). Artech house, Boston.
[15] Laguna, P., Jané, R., Caminal, P. (1994). Automatic detection of wave boundaries in multilead ECG signals: Validation with the CSE database. Computers and Biomedical Research, 27(1): 45-60. https://doi.org/10.1006/cbmr.1994.1006
[16] Celler, B., de Chazal, P. (1997). Selection of parameters from power spectral density, wavelet transforms and other methods for the automated interpretation of the ECG. In Proceedings of 13th International Conference on Digital Signal Processing, Santorini, Greece, pp. 71-74. https://doi.org/10.1109/ICDSP.1997.627970
[17] Sahambi, J.S., Tandon, S.N., Bhatt, R.K.P. (1997). DSP based ST-segment analysis: the wavelet approach. In Proceedings of the 1997 16 Southern Biomedical Engineering Conference, Biloxi, MS, USA, pp. 455-457. https://doi.org/10.1109/SBEC.1997.583343
[18] Luz, E.J.D.S., Schwartz, W.R., Cámara-Chávez, G., Menotti, D. (2016). ECG-based heartbeat classification for arrhythmia detection: A survey. Computer Methods and Programs in Biomedicine, 127: 144-164. https://doi.org/10.1016/j.cmpb.2015.12.008
[19] Martínez, J.P., Almeida, R., Olmos, S., Rocha, A.P., Laguna, P. (2004). A wavelet-based ECG delineator: evaluation on standard databases. IEEE Transactions on Biomedical Engineering, 51(4): 570-581. https://doi.org/10.1109/TBME.2003.821031
[20] Ye, C., Coimbra, M.T., Kumar, B.V. (2010). Arrhythmia detection and classification using morphological and dynamic features of ECG signals. In 2010 Annual International Conference of the IEEE Engineering in Medicine and Biology, Buenos Aires, Argentina, pp. 1918-1921. https://doi.org/10.1109/IEMBS.2010.5627645
[21] Castells, F., Laguna, P., Sörnmo, L., Bollmann, A., Roig, J.M. (2007). Principal component analysis in ECG signal processing. EURASIP Journal on Advances in Signal Processing, 2007, 074580. https://doi.org/10.1155/2007/74580
[22] Ceylan, R., Özbay, Y. (2007). Comparison of FCM, PCA and WT techniques for classification ECG arrhythmias using artificial neural network. Expert Systems with Applications, 33(2): 286-295. https://doi.org/10.1016/j.eswa.2006.05.014
[23] Kim, J., Shin, H.S., Shin, K., Lee, M. (2009). Robust algorithm for arrhythmia classification in ECG using extreme learning machine. Biomedical Engineering Online, 8(1): 1-12. https://doi.org/10.1186/1475-925X-8-31
[24] Asl, B.M., Setarehdan, S.K., Mohebbi, M. (2008). Support vector machine-based arrhythmia classification using reduced features of heart rate variability signal. Artificial Intelligence in Medicine, 44(1): 51-64. https://doi.org/10.1016/j.artmed.2008.04.007
[25] Kanaan, L., Merheb, D., Kallas, M., Francis, C., Amoud, H., Honeine, P. (2011). PCA and KPCA of ECG signals with binary SVM classification. In 2011 IEEE Workshop on Signal Processing Systems (SiPS), Beirut, Lebanon, pp. 344-348. https://doi.org/10.1109/SiPS.2011.6089000
[26] Kallas, M., Francis, C., Kanaan, L., Merheb, D., Honeine, P., Amoud, H. (2012). Multi-class SVM classification combined with kernel PCA feature extraction of ECG signals. In 2012 19th International Conference on Telecommunications (ICT), Jounieh, Lebanon, pp. 1-5. https://doi.org/10.1109/ICTEL.2012.6221261
[27] Song, M.H., Lee, J., Cho, S.P., Lee, K.J., Yoo, S.K. (2005). Support vector machine based arrhythmia classification using reduced features. Yonsei University Health System Repository, 3(4): 571-579. https://ir.ymlib.yonsei.ac.kr/handle/22282913/149913
[28] Wang, J.S., Chiang, W.C., Hsu, Y.L., Yang, Y.T.C. (2013). ECG arrhythmia classification using a probabilistic neural network with a feature reduction method. Neurocomputing, 116: 38-45. https://doi.org/10.1016/j.neucom.2011.10.045
[29] Güler, İ., Übeylı, E.D. (2005). ECG beat classifier designed by combined neural network model. Pattern Recognition, 38(2): 199-208. https://doi.org/10.1016/j.patcog.2004.06.009
[30] Ye, C., Kumar, B.V., Coimbra, M.T. (2012). Heartbeat classification using morphological and dynamic features of ECG signals. IEEE Transactions on Biomedical Engineering, 59(10): 2930-2941. https://doi.org/10.1109/TBME.2012.2213253
[31] Zhang, Z., Dong, J., Luo, X., Choi, K.S., Wu, X. (2014). Heartbeat classification using disease-specific feature selection. Computers in Biology and Medicine, 46: 79-89. https://doi.org/10.1016/j.compbiomed.2013.11.019
[32] Elhaj, F.A., Salim, N., Harris, A.R., Swee, T.T., Ahmed, T. (2016). Arrhythmia recognition and classification using combined linear and nonlinear features of ECG signals. Computer Methods and Programs in Biomedicine, 127: 52-63. https://doi.org/10.1016/j.cmpb.2015.12.024
[33] Chen, S., Hua, W., Li, Z., Li, J., Gao, X. (2017). Heartbeat classification using projected and dynamic features of ECG signal. Biomedical Signal Processing and Control, 31: 165-173. https://doi.org/10.1016/j.bspc.2016.07.010
[34] Mar, T., Zaunseder, S., Martínez, J.P., Llamedo, M., Poll, R. (2011). Optimization of ECG classification by means of feature selection. IEEE Transactions on Biomedical Engineering, 58(8): 2168-2177. https://doi.org/10.1109/TBME.2011.2113395
[35] Ye, C., Kumar, B.V., Coimbra, M.T. (2012). Heartbeat classification using morphological and dynamic features of ECG signals. IEEE Transactions on Biomedical Engineering, 59(10): 2930-2941. https://doi.org/10.1109/TBME.2012.2213253
[36] Yu, S.N., Chen, Y.H. (2007). Electrocardiogram beat classification based on wavelet transformation and probabilistic neural network. Pattern Recognition Letters, 28(10): 1142-1150. https://doi.org/10.1016/j.patrec.2007.01.017
[37] Oh, I.S., Lee, J.S., Moon, B.R. (2004). Hybrid genetic algorithms for feature selection. IEEE Transactions on Pattern Analysis and Machine Intelligence, 26(11): 1424-1437. https://doi.org/10.1109/TPAMI.2004.105
[38] Yang, J., Honavar, V. (1998). Feature subset selection using a genetic algorithm. In Feature extraction, Construction and Selection, pp. 117-136. https://doi.org/10.1007/978-1-4615-5725-8_8
[39] Mazomenos, E.B., Biswas, D., Acharyya, A., Chen, T., Maharatna, K., Rosengarten, J., Morgan, J., Curzen, N. (2013). A low-complexity ECG feature extraction algorithm for mobile healthcare applications. IEEE Journal of Biomedical and Health Informatics, 17(2): 459-469. https://doi.org/10.1109/TITB.2012.2231312
[40] Li, H., Feng, X., Cao, L., Li, E., Liang, H., Chen, X. (2016). A new ECG signal classification based on WPD and ApEn feature extraction. Circuits, Systems, and Signal Processing, 35(1): 339-352. https://doi.org/10.1007/s00034-015-0068-7
[41] Ye, C., Kumar, B.V., Coimbra, M.T. (2012). Heartbeat classification using morphological and dynamic features of ECG signals. IEEE Transactions on Biomedical Engineering, 59(10): 2930-2941. https://doi.org/10.1109/TBME.2012.2213253
[42] Zadeh, A.E., Khazaee, A., Ranaee, V. (2010). Classification of the electrocardiogram signals using supervised classifiers and efficient features. Computer Methods and Programs in Biomedicine, 99(2): 179-194. https://doi.org/10.1016/j.cmpb.2010.04.013
[43] Pincus, S.M. (1991). Approximate entropy as a measure of system complexity. Proceedings of the National Academy of Sciences, 88(6): 2297-2301. https://doi.org/10.1073/pnas.88.6.2297
[44] Breiman, L. (2001). Random forests. Machine Learning, 45: 5-32. https://doi.org/10.1023/A:1010933404324