Rajat Yadu* | Ragini Shukla
© 2022 IIETA. This article is published by IIETA and is licensed under the CC BY 4.0 license (http://creativecommons.org/licenses/by/4.0/).
OPEN ACCESS
Sentimental Analysis has grown as a significant opinion strategy in the field of online media due to quick information development and internet technologies. This research will play an important role for recommendation of best airline for Indian passengers to prefer the appropriate airline for their journey and also useful for the Indian ministry of aviation. In this study we have gathered different tiny texts called comments from different social media traveling websites using webharvy data fetcher scraping tool related to six top rated Indian airlines. The main problem with airline tweet SA (sentimental analysis) is determining the best sentiment classifier for appropriately classifying the tweets. VADER model has used sentiment ratings to connect lexical characteristics to emotion intensities. In this research, a Hybrid model integrated Adaboost approach (HMIAA) has proposed, which combines the basic learning classifier SVM with the forward-learning ensemble method Gradient Boosted Tree to form a single robust classifier or model, with the objective of improving SCT (sentimental classification technique) efficiency (performance) and accuracy. The findings reveal that the suggested hybrid approach integrating Adaboost technique outperforms other basic classifiers. After completion of sentimental analysis of all datasets we can recommend the passengers for the best airline.
Adabooost approach, sentiment analysis, MLE-meta algorithm, ensemble model, forward learning ensemble algorithm, sentiment score, classifier
To aquire a better understanding the opinions of passenger’s sentimental analysis has a significant impact for many researchers. In this study we have worked for appropriate prediction of comments in the area of airline industry where updating in services is now the main significant and important task. Many people cannot give their feedback directly so they share their opinions either in short messages, emojis, special symbols which are known as tweets. Nowadays social network travelling websites are the fast growing internet platform where people can post their comments or tiny texts called comments and also give rating for any airline according to their experience and another people can read the tweets and take decision to select appropriate airline without physically interference with related airline service. Additionally, as a past study application for our SAF (sentiment_analysis_framework), proposed a new cross_disciplinary field of geopolitics [1]. We have gathered tweets from different travelling web sources for six airlines then applied various preprocessing techniques to process the accurate feature data. We made use of “extract sentiment” operator of rapid miner tool to calculate sentiment score values and applied condition statement using “generate attribute” operator for prediction of two categories of tweets either pos or neg tweet. The experiment was done using self-written score condition code in rapidminer “text processing” operator and partitioned the dataset in testing and training using K-fold cross validation technique with stratified sampling to to support the model. The initial classifiers Nave Bayes, RF, RT, SVM, Logistic Regression, Decision Stump, and K-NN are utilized in this investigation paper to resolve the airline tweet sentimental analysis problem while gaining maximum accuracy for datasets and accurate prediction of pos and neg prediction value. We needed to make a robust model called HMIAA (Hybrid model integrated Adaboost approach), which is a set of initial classifiers together SVM and a forward learning ensemble model GBT integrated with the Adaboost meta-algorithm, which is itself a combination of many other ML algorithms to boost performance.
In this research paper, many recent and interesting papers are included on sentimental analysis of tweet prediction using different learning techniques, especially with ensemble models and Review of the literature also represents the hybrid design approach by merging a few suitable approaches for polarity prediction. There are numerous options important literatures who have worked in this area such as Sentimental analysis of wellness heed twitter datasets using majority voting ensemble classifier performs best prediction and accuracy [2]. The Hybrid planning for sentimental analysis have proposed to achieves higher accuracy and scalability by bridging the gap between lexicon-based and ML approaches with scalability of feature reduction using genetic_algorithms. Their proposed work used for law and order and public administration. A BERT-IAN sentimental analysis model have developed that improves the interactive attention networks model which has proposed to increase the emotional based on analysis factors. The experiment findings demonstrate the effectiveness and superiority of the BERT-IAN model using datasets from restaurants and laptops [3]. The Sentiments based on English language and analyzed a sentiment analysis based on aspects using bagging and boosting model in which random forest has provided the F-score of over to percent [4]. The customer sentiment investigation for the airline services domain uses six distinct combinations of basic classifiers to make a model that is built using a variety of models and is targeted at users who tweet and retweet concerning airline services. A voting_classifier according to stochastic gradient descent and logistic_regression (SGDC) used as a mechanism for soft voting for final prediction of sentiment of US airline companies’ passenger tweets. They also provided that TF-IDF method of information extraction has better than word2vec feature for their proposed voting model [5]. For the Twitter opinion classification adjusted parameters (LR) logistic_regression and RF classifiers are presented, which may classify customer comments more absolutely true than prior proposed pos, neg, and neut designs feedback [6]. On the basis of performance, sensitivity, specificity, precision and false positive rate and accuracy among various MLA for twitter data classification the SVM (support vector machine) outperformed the others [7]. The sentiment clustering and analysis used for context aware tourism recommendation system on their review and their proposed system was capable to filter the frequent words that were disliked via means the user's from their performance list on the basis of evaluate result of f-measure of suggested system [8]. For sentimental polarity detection of three types of twitter datasets and attention based bidirectional CNN-RNN Deep model (ABCDM) has achieved state-of-the-art results on both long reviews and short tweet polarity classification [9]. A predictive aspect-based system for categorizing emotions that permits users to identify attitudes about numerous the qualities of a tourism site has been suggested. A novel aspect identification method has been suggested in this framework, which automatically identifies the explicit, implicit, and co-referential features in tourist opinions. The NBM technique outperformed other ML classifiers on restaurant and hotel data sets, reaching 89.34% and 91.53% accuracy, respectively [10].
The proposed system consists of different seven phases such as Data Acquisition, Feature Construction (Text Preprocessing), Sentiment Score or Polarity calculation, Feature Extraction, Feature Selection, Splitting of Dataset, Sentimental Classification using base classifiers and proposed HMIAA (Hybrid model integrated Adaboost approach). The proposed methodology flow diagram is depicted in Figure 1 where the overall work has divided into seven phases from data collection to sentimental polarity prediction where SVM and GBT performs better result but to enhance accuracy of these classifiers we integrate both with Adaboost by tuning different parameter values of ensemble classifier and classifiers so it is possible to build a powerful model.
3.1 Data acquisition (Data collection)
This is the initial phase of our research framework where we have gathered six different datasets as tweets related to Air Asia, Air India, Spice jet, Indigo, Go Air and Vistara airlines using various travelling online web sources such as Tripadvisior, Skytrax, Makemytrip, Trustpiolet, Mouth shut etc. through the Webharvy data fetcher tool. For our research paper, we wanted to gather information or data from various Indian airlines and extract the precise sentiments of tweets for each and every airline company and in addition to develop a modelthat provides a proper recommendation of airline among the various airlines. We used the Rapid Miner machine learning tool for optimizing the sets of data sets.
Figure 1. Proposed methodology framework of airline tweet SC (Sentimental Classification) using HMIAA approach
3.2 Data preprocessing
This is the second phase of our research which is also called feature construction phase where we preprocess or transform the tweets which is initially in the raw form into an understandable format so we can suitably import for LMs. Because tweets contain a lot of noise and ambiguous symbols, it is essential to pre-process data in tweets such as:
·The following symbols have replaced by blank space using “Replace” operator in rapid miner-[-!"#$%&'()*+,./:;<=>?@\[\\\]_`{|}~].
The bulk of the distinct symbols called “Regular Expressions” supplied bythe passengers along with their comments were meaningless, so we used the Rapid Miner operator to replace them.
·Emoticons have replaced by its equivalent meaning so these can serve as useful feature to detect sentiments.
·For the removal of stop words “filter stopwords” and “filter tokens” (by length) filter operator have used.
·Stemming has done through stemming algorithms stem (snowball and porter) operators to reduce each word to its root word.
3.3 Sentiment score or polarity calculation
This is the third phase of our research, in which We employed the Extract Sentiment operator to calculate sentiment_score utilizing the Text attribute of a related dataset, followed by generated attribute set reduction and Transformation polarity categories for pos and neg classes according on the Score ≥ 0 and Score<0 conditions, and finally used the Write Excel operator to review and save both the “Text” and “Sentiment filed” in filtered datasets.
3.4 Feature extraction
3.4.1 Word2Vec
A W2V model is alike to a dictionary or hash map. Each word in the train-corpus has a word vector in this dictionary. The training corpus is exported to an example set using this method. Additional calculations, such as lexical detection, can be carried out using the generated set. A TF-IDF vectorization technique is used to convert processed text into numeric feature vectors, which are then fed into computers for ML applications.The BoW approach is straightforward and efficient; however it does not distinguish between frequent and unusual terms. This BoW vectorization problem is solved by TF-IDF.
3.4.2 N-Gram (Range max_length="2")
This operator constructs term n-Grams from tokens in a document. A series of consecutive tokens of length n is defined as an n-Gram. This operator generates the term n-Grams, which is made up of all series of consecutive tokens of length n.
3.4.3 POS tags -filter tokens
To filter tokens, the POS tag types that have been defined are used. In the PENN system for English POS tags and the STTS system for German POS tags, the possible POS tags are determined by a regular expression of types. For instance, all nouns and adjectives would remain in the sentence JJ. *|N. *. The regular phrase that was used to match the POS tags (STTS for German and PENN for English).
3.5 Feature selection (Removing a feature based on a filter)
3.5.1 Filter 1. Info Gain (IG)
The information gain and entropy of all attributes are computed. The entropy of the property with the lowest value is chosen for splitting. This method favors attributes with a great number of possible values.
3.5.2 Filter 2. Gain Info (GI)
It's a type of IG. It modifies the information gain for each attribute for the purpose of allow for the breadth and uniformity of the attribute values. Following this procedure, Actual Feature Vectors and the Final Feature Set were used. Info Gain and Gain Info both are the filter method to decide the relevance of an attribute and the attributes with higher weight are considered more relevant. In our research for polarity orcomment feature positive attribute has the highest info gain among another attributes.
3.6 Splitting dataset
In this phase we have followed the following procedures:
·Dividing the set of training into two disjoint sets.
·On the Ist section, train 67% of numerous base learners.
·On IInd section, test 33%S of the initial learners.
·To practice a higher-level learner, use the predictions from step 3 moreover the right inputs and answers as outputs.
3.7 Sentimental classification using base classifiers
The bulk of the times, the classifiers have already been used as a foundation for analyzing of sentiments. In our investigation, we used the following base classifiers:
3.7.1 (RF) Random forest
The RF technique produces a set of randomly generated trees. The random trees are created in the same manner that a tree is formed using the Random Tree operator. A specific number of random tree models are merged to the resulting forest model. The number_of_trees parameter specifies the number_of_trees required. For all of the random trees, the model that emerges is a voting model. Pruning is the removal of leaf nodes that don't make a participation in the tree's distinguishing ability. The parameter the RF classifier values are tuned as: number of trees=100, criterion=”Gain_Ratio/Information_Gain, Max_depth=10, applying pruning checked and confidence=0.1.
3.7.2 Logistic regression (LR)
According to Stefan Rueping's internal Java implementation of the myKLR in rapid miner. This learning method may applied to both regression and classification, and it features a simple algorithm that yields good results for a broad range of learning situations. Loss functions that are linear, quadratic, or even asymmetric can be handled with mySVM. The parameter_values for the LR classifier are tuned as: solver=”AUTO”, missing values handling =”meanlmeasures” , standardize checked and MaxIteration=0. When the dependent_variable (target) is categorical, logistic_regression is utilised. In our research We've employed the default “AUTO” value of “solver” parameter with this model but in this line “Loss functions that are linear, quadratic, or even asymmetric can be handled with mySVM” we have written the combined role of LR and SVM model.
3.7.3 Naïve bayes (NB)
On the resulting Example Set, the NB classification model is utilized (i.e. the testing data_set reduced dimensions). The existence or the lack of a specific feature of a class (i.e. attribute) has no influence on the absence or presence of other feature, on the basis of NB classifier. The NB classifier has the pros of estimating the means and the variables' variances required for using a classification oflittle volume of data for training. Because they create a couple of "naive" the perceptions of the data, the NB algorithms are termed as such. The NB classifier is highly adaptable; it necessitates a few parameters concerning the number of characteristics (characters/predictors) in a learning problem [11]. The parameter values of NB classifier are tuned as: Laplace correction checked.
3.7.4 (K-NN) K_nearest_neighbor
Among the most prominent fundamental MLAs is the K-NN algorithm: an illustration is categorized as an illustration assigned to the group most prevalent among its k_nearest_neighbor by a majority vote of its neighbors (k is a PI, typically small).If k=1, the example is just put into the class of the next-closest neighbour. In regression, the same method may be employed by simply averaging the label value for the example's k NN values. The parameter_ values of the K-NN classifier are tuned as: k=5, weighted vote checked, measure types=”Mixed Measures” and mixed measure=”MixedEuclideanDistance”.
3.7.5 (SVM) Support_vector_machine
This type of learning has a rapid algorithm, may be used for classification and regression, and produces good results for a variety of learning difficulties. SVM techniques are designed to ensure that dot products can be easily computed in relation to the variables in the original location by defining them in pertaining toa kernel function K(x,y) that is tailored to the task. Kernel type (selection) [12-14]. A kernel function is of the kind determined by this parameter. The Dot, radial, polynomial, neural, anova, epachnenikov, gaussian combination, and multiquadric kernels are among many that are supported. As Kernel type, we specifically used dot and polynomial parameter values. The LR classifier parameter values are tuned as: The possible view of the prediction equations for SVM classification is: $\mathrm{h}(\mathrm{xi})=\operatorname{sign}\left(\sum_{i=1}^s \alpha_j y_j K\left(x_j, x_i\right)+b\right), \mathrm{K}(\mathbf{v}, \mathbf{v}^{\prime} \mathbf{})=\exp$ “( $\left\|v-v^{\prime \prime}\right\|^{\wedge} 2 /\left(2 \gamma^{\wedge} 2\right)”$.
The forecast of Xi is vector, and Xj is the support_vector, that is an amount of the instruction data in example. K is a k function that accepts two vector input and output a number.
3.7.6 Random tree (RT)
This operator creates decision trees using nominal and numerical data. DTs are simple-to-understand categorization systems with a huge power. The R_Tree operator works similarly to Quinlan's CART or C4.5, with the exception that it chooses a R attributes subset before using them. The subset size is determined by the subset _ratio_parameter and prepruning is a type of pruning that takes place while the tree continues to grow [15-20]. As opposed to that, post-pruning is completed once the tree has been produced. The parameter criterion (selection) defines the criterion that will be put to use divide characteristics. The RT classifier's parameter values have defined as follows: criterion = “Gain_Ratio, Information_Gain”, max_depth = 10 and confidence = 0.1.
3.7.7 Decision stump (DS)
When only one split is implemented in a DT, the Decision Stump operator is utilized. The tree's structure can be applied to categorise previously undiscovered cases [21-24]. Each branch (to another decision tree) represents a potential attribute value, whereas the decision node represents an attribute test. The parameter values of DS classifier are tuned as: criterion=Gain_Ratio and minimal_leaf_size=1.
3.8 Proposed Hybrid model integrated Adaboost approach (HMIAA)
To make a more robust model, we frequently mix the best classifiers. This improves the model's performance. By changing various algorithmic parameters to distinct values, the proposed/created model integrates Adaboost, GBT (Gradient Boost Tree), and SVM by tweaking different algorithmic parameters to distinct values.
·AdaBoost, standing for Adaptive Boosting, is a meta-algorithm that may used for boost the effectiveness of many different LMs. It is a nested operator, which means there exists a sub process. In the sub process, a learner is needed, that is an operator that takes an Example Set as input and produces a model. This operator seeks to generate a better model using the learner provided in its subprocess.AdaBoost creates and calls newly weak classifier in every single t = 1... , T rounds. A weighted distribution D (t), representing the significance of examples in the set of data for categorization, is updated for each call. Although, it is possible less alert to the over fitting problem in some circumstances than traditional learning methods. We set the maximum number of AdaBoost algorithm iterations to boost the performance value. Number_of_iterations = "10 to 30" has been fine-tuned in this algorithm's Iteration parameter to improve efficiency.
·A GBT is a model that combines classification and regression_trees. Both are ensemble approaches that use forward learning to assume outcomes by steadily improving estimations. Boosting is a versatile nonlinear regression method that aids in improving tree accuracy. Ensemble techniques integrate multiple models to produce better predictive performance than the individual models. To put it another way, an ensemble is a means of combining multiple weak learners to make a powerful learner. Because evaluating an ensemble's forecast usually necessitates more processing than evaluating a single model's prediction, ensembles can be viewed as a means to compensate for bad learning algorithms by performing a significant amount of additional work. Applying weak classification algorithms sequentially to gradually changing data produces a sequence of decision trees, resulting in a collection of weak prediction models. Whileincreasing tree accuracy increases speed and human interpretability, it diminishes speed and human interpretability. To overcome these challenges, the GB approach generalizes tree boosting. The operator sets up a one-node local H2O_cluster and performs the programme on it. Despite the fact that just one node is used, the process is parallel. Adjusting the Settings/Preferences/General/Count of threads parameter can change the degree in terms of parallelism. It uses the number of threads recommended by the system by default. Only one cluster instance is launched, and it still exists operational until Rapid Miner Studio is stopped. This output node provides the Gradient_Boosted_ classification or regression_model. It is possible to forecast the label attribute on previously unidentified pieces of data using this classification or regression model. The following parameters were changed to increase the efficiency of the GBT model: The total_number_of _trees =20, Maximal depth=5, Number of bins = 50, Distribution_method=”AUTO/Bernoulli/multinomial.
The algorithm below explains how to extract opinions expressed in tweets and create Sentiment Scores using the "Extract Sentiment" and "Generate Attribute" operators.
There is an algorithm for proposed model which describe the sentiment score calculation using VADER (Valence Aware Dictionary for Sentiment Reasoning) model which analyses the text sentiment that is sensitive to both polarity (Positive/Negative) and intensity of emotion and also applied TF-IDF vector creation method in manner to extract features. We have used our self condition for polarity of sentiments using extract sentiment operator as if Score ≥ 0 then positive tweets and if Score<0 then negative tweets. After this process we have to applied different classifiers for actual positive prediction and negative prediction of tweets.
Algorithm I
Algorithm to calculate Sentiment Score by Extracting Sentiment operator for base and ensemble models-
Function Calculate Sentiment Score (Retrive_Tweet, Test_Tweet, Sentiment_Score, Sentiment)
// after obtaining the score value, predict the sentiment_of_tweets by extracting the words and delivering a word-vector operator using the TF-IDF Vector Creation method.
End
The overall Implementations have been completed in Rapid Miner that is a free software tool specially used for data/text mining commonly known as sentimental analysis. It provides graphical user interface editor with approx thousands of operator and DM tools. A process repository panel is commonly available for central storage of processes and models. In this section we have discussed three important figures of implementation process used in Rapid Miner tool.
We have employed various classifiers such as LR, RT, RF, DS, Adaboost, and GBT and tune various parameter values to achieve best result such as:
a) numberoftrees=100, criterion=”Gain_Ratio/Information_Gain, Max_depth=10, applying pruning checked and confidence=0.1 for RF.
b) solver=”AUTO”, missing values handling =”meanlmeasures”, standardize checked and MaxIteration=0 for LR.
c) k=5, weighted vote checked, measure types=”Mixed Measures” and mixed measure=”MixedEuclideanDistance” for KNN.
d) Criterion=Gain_Ratio and minimal_leaf_size=1for DS.
e) Number of iterations="10 to 30" for Adaboost.
f) Total_number of trees=20, Maximal depth=5,Number of bins=50, Distribution method=”AUTO/Bernoulli/multinomial for GBT.
Figure 2 displays all of the Rapid_miner operators, from attribute selection to extraction and creating sentiment_scores for sentiments, and then saving those scores with our polarity condition of pos or neg. Nominal to Text, Select Attribute, Replace, Extract Sentiment, Generate Attribute, and Write Excel are the operators utilized.
Figure 2. Process for generating sentimental scores for all six datasets
Figure 3. Score values along with using generate attribute operator
The above Figure 3 depicts the various score values and sentiments on the basis of text or tweets given by the passengers.
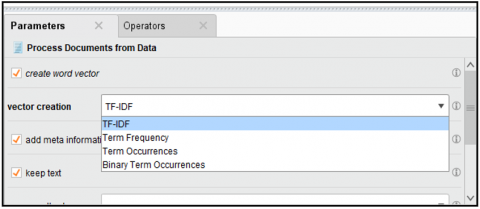
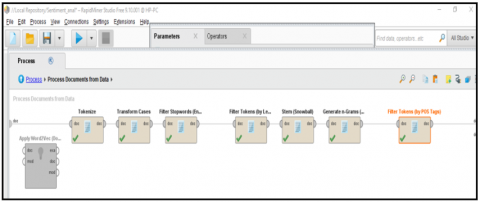
The actual detection of sentiment in featured datasets/texts is depicted in below Figure 4 using various classification models trained on categorized passenger reviews and Figure 5 shown the parameter setting for vector creation for the feature text or datasets so all the text converted into vectors for actual prediction of tweets and for process_document_operator, we used various other operators for tokenization and feature extraction has illustrated in Figure 6, where the important operators are Filter by length, n-gram with max length value 2, filter token POS tags with language English, and expression PENN been put to use to extract features.
Figure 4. Sentimental analysis process to detect sentiment in texts using classification models
Figure 5. Parameter selection for word vector creation using process documents from data operator
Figure 6. Feature extraction operators
5.1 Datasets
The suggested approach was tested on the total_number of 41,464 tweets collected for six different Indian airlines, which are listed below:
5.1.1 Air India
There are 20,000 records in this collection of training tweets, containing 6,776 pos labeled tweets and 13,222 neg labeled tweets.
5.1.2 Spicejet
This DS contains 3,551 training tweets, 1,304 of which include labeled pos and 2,246 of which include labeled neg.
5.1.3 Air Asia India
This DS contains 1,248 training tweets, 1,304 of which include labeled pos and 2,246 of which include labeled neg.
5.1.4 Go Air
This DS contains 5,262 training tweets, 1,203 of which include tagged pos and 4,058 of which include labeled neg.
5.1.5 Indigo
This DS contains 9,554 training tweets, 3,309 of which include labeled pos and 6,244 of which include labeled neg.
5.1.6 Vistara
This DS contains 1,849 training tweets, 1,119 of which include tagged pos and 649 of which include labeled neg.
5.2 Results analysis & discussion
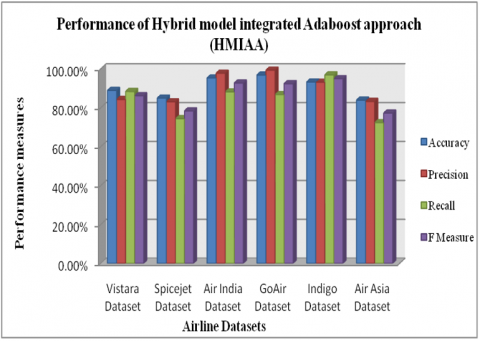
In below Table 1 the performance measures of general classifiers and our proposed HMIAA approach have shown where the maximum accuracy 96.84% achieved for actual prediction of both positively and negatively tweets for SA. The general classifier SVM and forward learning algorithm GBT have performed well in comparison to other classifiers so we integrate both classifiers with Adaboost ensemble model for better results accuracy by tuning various parameters. The optimum level of accuracy has been achieved for Go Air airline, hence this airline may be recommended to passengers.
In the Table 1 we have shown the base classifier's accuracy S_V_M along with forward learning algorithm Gradient Boosted Technique because these classifiers have given the maximum accuracy and after that we’ve implemented Adaboost Meta classifier integrated using SVM and GBT which is basically used for weak learners to increase efficiency more to design a robust model.
Figure 7. Performance evaluation chart of different proposed HMIAA for six datasets (a) Vistara (b) Spicejet (c) Air Asia India (d) Air India (e) Go Air (f) Indigo
As seen in above Figure 7, all the performance measures such as acc, precision, f_measure and recall of suggested Hybrid_Model Integrated with Adaboost Approach (HMIAA) viewed the entire set of six airline tweets such as Vistara, Spicejet, Air India, GO Air, Indigo, Air Asia.
Due to the various numbers of tweets from each airline through social media travel sites, the data fetcher tool has compiled maximum numbers of comments for all of the airlines and according to a passenger's comment, every airline is different from the others in form of comment count.
Table 1. Analysis chart of the obtained data by base classifiers and proposed HMIAA with Acc, Prec, Reca and F-m for six airline datasets
|
Techniques |
Accuracy |
Precision |
Recall |
F measure |
||||
|
Vistara Dataset |
||||||||
|
Support Vector Machine |
81.28% |
91.92% |
51.52% |
70.51% |
||||
|
Logistic Regression |
80.08% |
71.09% |
36.66% |
50.82% |
||||
|
Random Forest |
64.35% |
89.45% |
18.99% |
12.26% |
||||
|
Naive Bayes |
81.63% |
72.10% |
87.76% |
79.04% |
||||
|
K-NN |
77.91% |
82.74% |
37.96% |
51.83% |
||||
|
Random Tree |
64.85% |
45.00% |
12.14% |
66.12% |
||||
|
Decision Stump |
66.02% |
96.97% |
82.11% |
77.90% |
||||
|
Gradient Boosted Tree |
83.76% |
91.99% |
57.25% |
72.6% |
||||
|
Proposed Hybrid Model (Adaboost+SVM+GBT) |
88.92% |
84.31% |
88.41% |
86.22% |
||||
|
Spicejet Dataset |
||||||||
|
Support Vector Machine |
82.96% |
94.79% |
56.29% |
70.54% |
||||
|
Logistic Regression |
81.70% |
72.99% |
87.60% |
52.82% |
||||
|
Random Forest |
63.27% |
89.45% |
18.99% |
12.26% |
||||
|
Naive Bayes |
6248% |
48.85% |
88.85% |
63.00% |
||||
|
K-NN |
72.90% |
62.89% |
79.02% |
68.60% |
||||
|
Random Tree |
83.72% |
98.10% |
58.74% |
71.79% |
||||
|
Decision Stump |
72.79% |
97.09% |
26.60% |
41.75% |
||||
|
Gradient Boosted Tree |
83.96% |
93.79% |
55.28% |
69.53% |
||||
|
Proposed Hybrid Model (Adaboost+SVM+GBT) |
84.99% |
83.06% |
74.40% |
78.42% |
||||
|
Air India Dataset |
||||||||
|
Support Vector Machine |
92.24% |
97.94% |
78.60% |
87.69% |
||||
|
Logistic Regression |
93.32% |
90.93% |
89.20% |
90.01% |
||||
|
Random Forest |
65.50% |
65.45% |
100.00% |
79.12% |
||||
|
Naive Bayes |
76.59% |
59.60% |
97.60% |
73.82% |
||||
|
K-NN |
87.92% |
92.56% |
69.98% |
79.69% |
||||
|
Random Tree |
87.94% |
98.93% |
65.11% |
78.45% |
||||
|
Decision Stump |
72.57% |
96.98% |
18.30% |
31.47% |
||||
|
Gradient Boosted Tree |
91.22% |
96.92% |
77.59% |
86.64% |
||||
|
Proposed Hybrid Model (Adaboost+SVM+GBT) |
95.32% |
97.78% |
88.19% |
92.73% |
||||
|
GoAir Dataset |
||||||||
|
Support Vector Machine |
96.70% |
94.2%% |
77.60% |
89.60% |
||||
|
Logistic Regression |
96.27% |
93.26% |
91.89% |
90.06% |
||||
|
Random Forest |
78.31% |
100.00% |
4.83% |
79.80% |
||||
|
Naive Bayes |
76.53% |
50.6%% |
93.77% |
65.26% |
||||
|
K-NN |
96.30% |
96.89% |
81.41% |
85.19% |
||||
|
Random Tree |
78.01% |
94.55% |
4.20% |
8.27% |
||||
|
Decision Stump |
88.90% |
99.59% |
49.83% |
64.98% |
||||
|
Gradient Boosted Tree |
92.59% |
92.89% |
71.41% |
62.18% |
||||
|
Proposed Hybrid Model (Adaboost+SVM+GBT) |
96.84% |
99.34% |
86.78% |
92.40% |
||||
|
Indigo Dataset |
||||||||
|
Support Vector Machine |
93.12% |
92.09% |
99.05% |
95.98% |
||||
|
Logistic Regression |
77.91% |
95.99% |
66.79% |
80.78% |
||||
|
Random Forest |
66.91% |
65.50% |
100.00% |
79.12% |
||||
|
Naive Bayes |
77.55% |
96.95% |
67.79% |
79.78% |
||||
|
K-NN |
92.67% |
88.95% |
97.98% |
93.2%% |
||||
|
Random Tree |
87.95% |
82.52% |
99.87% |
91.56% |
||||
|
Decision Stump |
78.61% |
74.53% |
99.99% |
85.39% |
||||
|
Gradient Boosted Tree |
92.12% |
91.09% |
98.05% |
94.92% |
||||
|
Proposed Hybrid Model (Adaboost+SVM+GBT) |
93.24% |
93.14% |
96.94% |
94.95% |
||||
|
Air Asia Dataset |
||||||||
|
Support Vector Machine |
81.12% |
95.40% |
41.13% |
57.92% |
||||
|
Logistic Regression |
81.96% |
77.35% |
74.91% |
75.89% |
||||
|
Random Forest |
70.91% |
91.99% |
6.66% |
4.99% |
||||
|
Naive Bayes |
71.88% |
57.28% |
88.22% |
69.42% |
||||
|
K-NN |
91.67% |
94.46% |
43.35% |
58.73% |
||||
|
Random Tree |
61.99% |
100% |
0.25% |
0.42% |
||||
|
Decision Stump |
78.61% |
97.98% |
25.07% |
39.72% |
||||
|
Gradient Boosted Tree |
80.12% |
94.40% |
40.13% |
56.92% |
||||
|
Proposed Hybrid Model (Adaboost+SVM+GBT) |
83.96% |
83.30% |
72.39% |
77.30% |
||||
Accuracy=$\frac{\text{True_Positive_Sentiment+True_Negetive_Sentiment}}{\text{True_Positive_Sentiment+False_Negetive_Sentiment+False_Positive_Sentiment+True_Negetive_Sentiment}}$
The total_number of pos and neg predictions split up by the total number of predictions is a statistic that represents a model's performance as classification accuracy.
Precision=$\frac{\text{True_Positive_Sentiment}}{\text{True_Positive_Sentiment+False_Positive_Sentiment}}$
It's the total_number of genuine positives across divided by the sum of real positives and false positives.
Recall=$\frac{\text{True_Positive_Sentiment}}{\text{True_Positive_Sentiment+False_Negetive_Sentiment}}$
It's calculated by dividing the number of true positives from the addition of number of true positives and false negatives.
F-measure=$\frac{\text{2*Precision*Recall}}{\text{Precsion+Recall}}$
It generates a single score that accounts for both preci and reca concerns in a number.
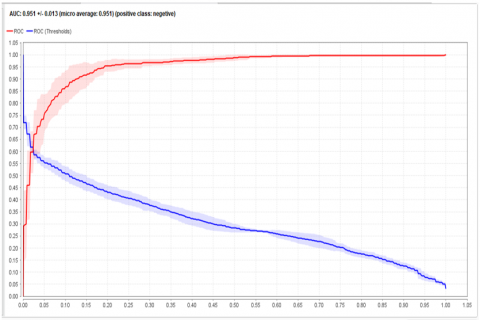
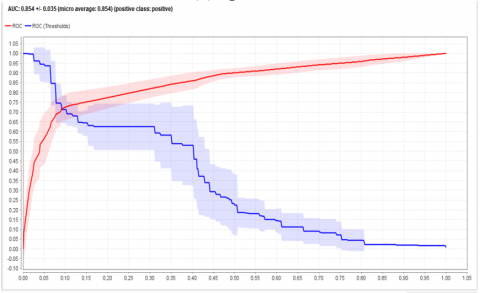
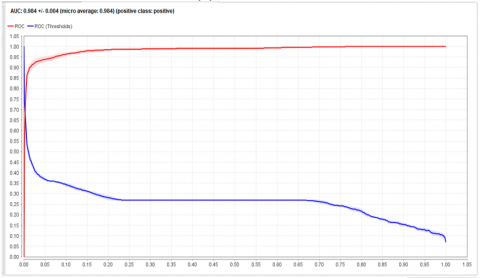
The Figure 8 below shows the AUC curves have calculated because if the model has a probabilistic scoring system where scores above a certain threshold are identified as positive, then the elements of the confusion_matrix will depend on the threshold. The space beneath the curvature (AUC) is calculated simply adjusting the threshold and plotting a point (x, y) for each threshold value:
• True positive rate=(True positive predictions)/(Number of positive Instances)=TPP/(TPP+FNP) on the Y-axis
• X-axis - false positive rate=(False positive predictions)/(Number of negative Instances)=FPP/(FPP+TNP) =FPP/(FPP+TNP).
To determine the curve's undersurface area, the predictions are sorted by score from highest to lowest, and the graph is displayed Example by Example (AUC). If two or more Examples possess the same score, the ranking is unclear. The area in the typical form of AUC is computed using the average_of_AUC (optimistic) and AUC (realistic) (pessimistic).
Based on sentiments and classification, Indigo is the second-highest recommended airline; as a result, the spatial discreteness of ROC is quite high but lower than that of Go Air.
(a) Vistara
(b) Spice Jet
(c) Air Asia
(d) Air India
(e) Go Air
(f) Indigo
Figure 8. AUC for evaluating the acc of proposed model HMIAA for six datasets (a) Vistara (b) Spicejet (c) Air Asia (d) Air India (e) Go Air (f) Indigo
The key strategy in the aviation business passenger tweet sentimental analysis is to compare a number_of_classifiers and choose the best one to apply to the tweet sentimental analysis. For the most of the times, ensemble classifications are in charge of address classification problems. A fresh paper is displayed in this one as Hybrid model integrated Adaboost approach (HMIAA) was developed by combining SVM base learner and GBT forward learning technique with Adaboost meta algorithm to boost efficiency, and it shows the most efficient performance after tuning various parameters when compared to other base models like NB, SVM, DT, DS, RT, RF, Logistic_Regression (LR), K-NN. The new approach is beneficial for recommending the greatest airline for airline business to monitor passengers' opinions about their services. Many researchers can use the featured dataset to apply different ML techniques. Unlike some other classifiers, the suggested framework is to be the most maximum accuracy for accurate prediction of positive predictive tweets and negative predictive tweets of passengers, and our approach is more appropriate for Go Air airline dataset with 96.84% performance accuracy. In the near future, we will apply DLT and CNN techniques for 3-class Pos, neg, and neut tweets are among the datasets.
[1] Iqbal, F., Hashmi, J.M., Fung, B.C., Batool, R., Khattak, A.M., Aleem, S., Hung, P.C. (2019). A hybrid framework for sentiment analysis using genetic algorithm based feature reduction. IEEE Access, 7: 14637-14652. https://doi.org/10.1109/ACCESS.2019.2892852
[2] Saleena, N. (2018). An ensemble classification system for twitter sentiment analysis. Procedia Computer Science, 132: 937-946. https://doi.org/10.1016/j.procs.2018.05.109
[3] Zhang, H., Pan, F., Dong, J., Zhou, Y. (2020). BERT-IAN model for aspect-based sentiment analysis. In 2020 International Conference on Communications, Information System and Computer Engineering (CISCE), pp. 250-254. https://doi.org/10.1109/CISCE50729.2020.00056
[4] Prabhakar, E., Santhosh, M., Krishnan, A.H., Kumar, T., Sudhakar, R. (2019). Sentiment analysis of US airline twitter data using new adaboost approach. International Journal of Engineering Research & Technology (IJERT), 7(1): 1-6.
[5] Rustam, F., Ashraf, I., Mehmood, A., Ullah, S., Choi, G.S. (2019). Tweets classification on the base of sentiments for US airline companies. Entropy, 21(11): 1078. https://doi.org/10.3390/e21111078
[6] Pandey, H.M., Tiwari, P., Khamparia, A., Kumar, S. (2019). Twitter-based opinion mining for flight service utilizing machine learning. Informatica (Slovenia), 43(3): 381-386. https://doi.org/10.31449/inf.v43i3.2615
[7] Sarker, A., Zaman, M.S., Srizon, M.A.Y. (2019). Twitter data classification by applying and comparing multiple machine learning techniques. International Journal of Innovative Research in Computer Science & Technology, 7(6): 147-152. https://doi.org/10.21276/ijircst.2019.7.6.2
[8] Abbasi-Moud, Z., Vahdat-Nejad, H., Sadri, J. (2021). Tourism recommendation system based on semantic clustering and sentiment analysis. Expert Systems with Applications, 167: 114324. https://doi.org/10.1016/j.eswa.2020.114324
[9] Basiri, M.E., Nemati, S., Abdar, M., Cambria, E., Acharya, U.R. (2021). ABCDM: An attention-based bidirectional CNN-RNN deep model for sentiment analysis. Future Generation Computer Systems, 115: 279-294. https://doi.org/10.1016/j.future.2020.08.005
[10] Afzaal, M., Usman, M., Fong, A. (2019). Predictive aspect-based sentiment classification of online tourist reviews. Journal of Information Science, 45(3): 341–363. https://doi.org/10.1177/0165551518789872
[11] Verma, P., Awasthi, V.K., Sahu, S.K., Shrivas, A.K. (2022). Coronary artery disease classification using deep neural network and ensemble models optimized by particle swarm optimization. International Journal of Applied Metaheuristic Computing (IJAMC), 13(1): 1-25. https://doi.org/10.4018/ijamc.292504
[12] AlBadani, B., Shi, R., Dong, J. (2022). A novel machine learning approach for sentiment analysis on Twitter incorporating the universal language model fine-tuning and SVM. Applied System Innovation, 5(1): 13. https://doi.org/10.3390/asi5010013
[13] Chang, Y.C., Ku, C.H., Le Nguyen, D.D. (2022). Predicting aspect-based sentiment using deep learning and information visualization: The impact of COVID-19 on the airline industry. Information & Management, 59(2): 103587. https://doi.org/10.1016/j.im.2021.103587
[14] Dang, N.C., Moreno-García, M.N., De la Prieta, F. (2020). Sentiment analysis based on deep learning: A comparative study. Electronics, 9(3): 483. https://doi.org/10.3390/electronics9030483
[15] Haafza, L.A., Awan, M.J., Abid, A., Yasin, A., Nobanee, H., Farooq, M.S. (2021). Big data COVID-19 systematic literature review: Pandemic crisis. Electronics, 10(24): 3125. https://doi.org/10.3390/electronics10243125
[16] Khalid, K.A.A., Leong, T.J., Mohamed, K. (2016). Review on thermionic energy converters. IEEE Transactions on Electron Devices, 63(6): 2231-2241. https://doi.org/10.1109/TED.2016.2556751
[17] Liu, B. (2017). Sentiment analysis and opinion mining. Encyclopedia of Machine Learning and Data Mining, 1152-1161. https://doi.org/10.1007/978-1-4899-7687-1_907
[18] Majeed, A., Hwang, S.O. (2021). Data-driven analytics leveraging artificial intelligence in the era of COVID-19: An insightful review of recent developments. Symmetry, 14(1): 16. https://doi.org/10.3390/sym14010016
[19] Mishra, R.K., Urolagin, S., Jothi, J.A., Neogi, A.S., Nawaz, N. (2021). Deep learning-based sentiment analysis and topic modeling on tourism during COVID-19 pandemic. Frontiers in Computer Science, 3. https://doi.org/10.3389/fcomp.2021.775368
[20] Rani, S., Gill, N.S. (2020). Hybrid model using stack-based ensemble classifier and dictionary classifier to improve classification accuracy of twitter sentiment analysis. International Journal of Emerging Trends in Engineering Research, 8(7): 2893-2900. https://doi.org/10.30534/ijeter/2020/02872020
[21] Rupapara, V., Rustam, F., Amaar, A., Washington, P.B., Lee, E., Ashraf, I. (2021). Deepfake tweets classification using stacked Bi-LSTM and words embedding. PeerJ Computer Science, 7: e745. https://doi.org/10.7717/peerj-cs.745
[22] Shayaa, S., Jaafar, N.I., Bahri, S., Sulaiman, A., Wai, P.S., Chung, Y.W., Piprani, A.Z., Al-Garadi, M.A. (2018). Sentiment analysis of big data: Methods, applications, and open challenges. IEEE Access, 6: 37807-37827. https://doi.org/10.1109/ACCESS.2018.2851311
[23] Kumari, M.V. (2021). Collaborative classification approach for airline tweets using sentiment analysis. Turkish Journal of Computer and Mathematics Education (TURCOMAT), 12(3): 3597-3603.
[24] Wan, Y., Gao, Q. (2015). An ensemble sentiment classification system of twitter data for airline services analysis. In 2015 IEEE International Conference on Data Mining Workshop (ICDMW), pp. 1318-1325. https://doi.org/10.1109/ICDMW.2015.7