Daneshwari Ashok Noola* | Dayananda Rangapura Basavaraju
© 2021 IIETA. This article is published by IIETA and is licensed under the CC BY 4.0 license (http://creativecommons.org/licenses/by/4.0/).
OPEN ACCESS
Crop diseases constitute a substantial threat to food safety but, due to the lack of a critical basis, their rapid identification in many parts of the world is challenging. The development of accurate techniques in the field of image categorization based on leaves produced excellent results. Plant phenotyping for plant growth monitoring is an important aspect of plant characterization. Early detection of leaf diseases is crucial for efficient crop output in agriculture. Pests and diseases cause crop harm or destruction of a section of the plant, leading to lower food productivity. In addition, in a number of less-developed countries, awareness of pesticide management and control, as well as diseases, is limited. Some of the main reasons for decreasing food production are toxic diseases, poor disease control and extreme climate changes. The quality of farm crops may be influenced by bacterial spot, late blight, septoria and curved yellow leaf diseases. Because of automatic leaf disease classification systems, action is easy after leaf disease signs are detected. Applying image processing and machine learning methodologies, this research offers an efficient Spot Tagging Leaf Disease Detection with Pertinent Feature Selection Model using Machine Learning Technique (SPLDPFS-MLT). Different diseases deplete chlorophyll in leaves generating dark patches on the surface of the leaf. Machine learning algorithms can be used to identify image pre-processing, image segmentation, feature extraction and classification. Compared with traditional models, the proposed model shows that the model performance is better than those existing.
plant leaf disease, image segmentation, feature selection, classification, spot tagging
The Indian economy is strongly dependent on agricultural productivity. Agriculture has several challenges due to modernisation and globalisation [1]. Agricultural productivity is expanding as agricultural areas have improved in the recent century. Plant disease is one of the primary challenges in agriculture [2]. Disease control is the method to reduce crop disease in order to improve crop growth or harvest levels [3]. While several control measures, such as spraying pesticides, require productivity in plant disease early diagnosis. Many plant diseases cause an enormous decrease in every great amount of agricultural commodities [4]. As plant illnesses are inevitable, early detection of diseases plays an important role in agriculture and its results.
India is second in the world for the production of rice, wheat, spices, and pulses. Crop losses and diseases reduce India's crop production by 30% to 60% [5]. Crop quality and quantity influence farmer economies [6]. Since several diseases are attacking the plant, agricultural output has become a nightmare. It's critical to find disease indicators on plant leaves as quickly as feasible using automation. Leaf spot is a devastating disease that affects a wide range of crops. Patches of leaves are produced by bacteria, fungi, viruses, oomycetes, viroids, phytoplasms, etc. Early diagnosis of plant diseases has been shown to increase farmer incomes [7, 8].
Manual detection is a time-consuming and error-prone method of spotting plant diseases on a big farm. There are various automatic detection strategies based on farm images thanks to advances in image processing and data mining technology [9]. Processing photos digitally is a method of enhancing the quality of the image or obtaining relevant data [10].
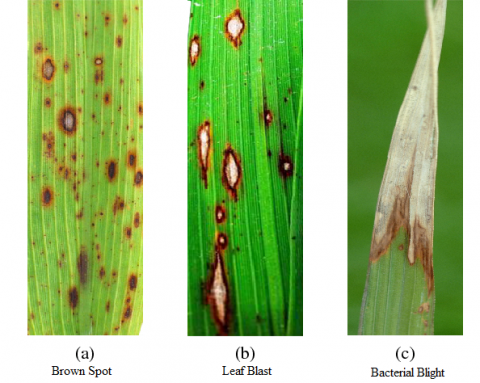
Among the many fields where image processing is important to learn include medicine, agribusiness, and cyber security, among others. Clustering and classification techniques for digital picture extraction are being studied [11]. Images are pre-processed, improved, and analysed quickly and automatically thanks to advances in machine learning algorithms. Figure 1 depicts rice plant diseases that affect the leaves.
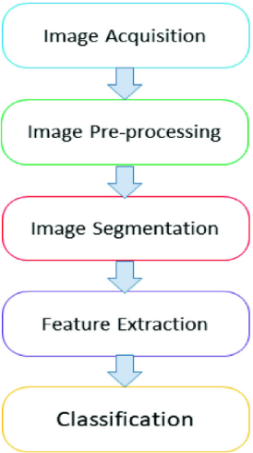
Food quality is decreased by leaf diseases. A crucial part in effective agriculture is the monitoring of crops from far places for the detection of diseases. The current method allows a large team of disease detection experts to observe, which is highly costly [12]. Thus, a more accurate and cost-effective automatic disease diagnostics system is necessary. Machine image processing is an automatic tool for the detection of diseases [13]. The method of clustering and classification for the diagnosis of autonomous diseases are proposed and validated in this research. The detection of leaf diseases usually includes the technique shown in Figure 2.
Figure 1. Rice leaf diseases
Figure 2. General leaf disease detection process
Farmers' economies will benefit from early diagnosis of plant diseases. Leaf diseases reduce food quality [14]. Crop monitoring from remote areas for disease identification is important in efficient agriculture. Disease identification can be made easier with machine image learning [15]. Plant leaf diseases can be detected and classified more accurately with the use of machine learning [16]. In spite of the solutions created and put in place to deal with this issue, the problem of rapid disease identification remains unresolved [17]. Agriculture's output depends heavily on disease detection. Using machine learning to facilitate identification and detection, this problem can be overcome.
Mohanty et al. [1] focused primarily on two CNN architectures, AlexNet and Google Net, and used given transaction and scratch training as training methodologies. PlantVillage provided the photographs, which included 54,306 photos of diverse plants with 38 disease types. All of the images in the data set were shrunk down to 256 pixels, and the models were then improved and predicted using the smaller images.
For rice disease identification, Lu et al. [2] proposed a deep learning architecture. They employed 500 images taken with a camera in a field, as well as 10 common rice plant illnesses that were discovered. Multiple pooling characteristics, such as average, maximum, and stochastic pooling, were evaluated using different filter sizes, such as 5x5, 9x9, and different algorithms, such as CNN, BP, SVM, and PSO.
Ferentinos [3] used a variety of CNN architectures, notably AlexNetOWTBn, Overfeat, AlexNet, VGG, and GoogLeNet, all of which were created with different settings. Torch 7, a machine learning mathematical method, was used for the training and testing of these models. The PlantVillage collection included 87,848 photos of 25 different plant species in 58 different disease classifications. VGG and AlexNetOWTBn designs have the best success rates when compared to others.
Khamparia et al. [4] suggested a framework for identifying agricultural diseases that included CNN and autoencoders. For tomato and maize rust disease, the researchers examined a dataset of 900 photos from three cultures with five distinct types of illnesses, including early and late potato blight, leaf mould, and yellow leaf curl. The precision assessed for various convolution filters varies from time to time, and the filter sizes 2 X 2 and 3 X 3 were used. The Adam Optimizer was used to reduce loss and enhance accuracy during training.
Kamal et al. [5] used a comprehensive convolution architecture to build two models, Modified MobileNet and Reduced MobilNet, and compared the results to MobileNet, AlexNet, and VGG. SGD, Adam, and Nadam are some of the optimizers that have been employed. Nadam outperformed the other two optimizers in terms of convergence rate and speed. In this study, the publicly accessible PlantVillage dataset was used to train and model 98,235 pictures of five classes of healthy and unhealthy plants.
A deep convolutional neural network method to plant leaf identification was presented by Kumari et al. [6]. The authors of the PlantVillage data set designed and evaluated the Deep CNN architecture for free access data. In this project, 54,448 photographs of 13 various plants leaves were used. Gamma corrections, colour enhancement, noise injecting, rotation, principal component analysis, and image reversal were used to create enlarged photos, bringing the total number of images to 61,486.
Singh and Misra [7] discovered and identified a pea rust disease caused by Uromyces fabae de Bary, a fungus. The Hill Agricultural Development and Expansion Centre in Himachal Pradesh, India, provided about 500 pictures of pea plants. During the classification step, SVM was utilised to identify diseases after several image processing processes. Harshal Waghmare et al. [8] looked into the diagnosis of grape plant leaf diseases. RGB images are transformed to HSV colour schemes, with the Hue component being used for testing purposes. Using the intensity of the R, G, and B components, unwanted background is removed. The G-component pixel was larger than the R and B components, while the remainder of the pixels were darkened.
Barbedo [9] employed a linear vector approach to divide grape leaves into Downey and Powderly Mildew infections. The researchers used a webcam to take 137 grape photos. For noise reduction, images are pre-processed with a Gaussian filter, and undesired regions are removed using a threshold. The photos are then segmented using k-means, and the features listed below are retrieved and fed into the SVM classifier. With leaf patches, broken edges, and smoothness in the leaf texture, the images regained colour, shape, and texture qualities.
The disease area was separated into a binary picture using Otsu's threshold technique, with white indicating the disease area and healthy black indicating the healthy area. The morphological activator filling and opening is used to remove thin spots. To colour the disease portion with a main image of the disease, a binary image was masked [6]. The techniques of statistic feature, discrete wavelet transform, and discrete cosine transform are used to compute the segmented image properties. KNN, SVM, Decision Tree, Neural Network, and Nave Bayesian Classifier were used [8]. The author proposed that the SVM classifier be used instead of the other classifier because it produces more accurate results.
Mainkar et al. [11] looked into and used K-NN to classify plant disease such alternate, anthracnosis, bacterial blackness, leaf spot, and plant cancer. The Arkansas plant disease database has 237 images in the data set. The GLCM approach was used to determine the plant characteristics. To avoid overfitting, the training data set was subjected to 5-fold cross validation. The methodology suggested by Sharath et al. [13] has automatically detected diseases such as wilde laurel, phytophthora root, iron, and nitrogen deficiencies in avocado plants. Multilayer Perceptron (MLP) and K-Nearest Neighbor (K-NN) classification methods were used to create the images.
Figure 3. Proposed model framework
The process of gathering images from a database is known as picture acquisition. The images from the analysed dataset are first loaded, and image analysis is then carried out on them. There are many sectors that rely on the classification and detection of leaf diseases [18]. Image processing techniques are critical for the early diagnosis of plant leaf disease. By utilising the histogram, thresholding transforms a grey image into a binary image [19]. In a histogram, the number of times each grey level appears is represented as a type of digital gray-scale pattern [20]. The image's intensity histogram shows how the foreground and background are divided throughout the image [21].
Image analysis relies on segmentation as a major tool. Detachability is critical in many of today's image description and identification systems. 2D image processing has a wide range of uses, including visualisation, object measurement, abnormality detection, tissue measurement, and tissue classification [22]. The idea is to make the information more relevant by converting images into quantitative values that are easier to analyse and interpret. The proposed model framework is represented in Figure 3.
Algorithm SPLDPFS-MLT
{
Input: Image Dataset (IDS), Weight (We), Threshold (T), Pixel Vector (Pv), Spot Tagging Mark (SPM)
Output: Leaf Disease Cluster Set (LDCS)
Step-1: The plant leaf is segmented for proper analysis of the smaller leaf sections in order to anticipate the form and kind of the leaf disease. The medical leaf segmentation procedure is carried out as follows:
$\begin{align} & \delta =\frac{\sum\nolimits_{i=1}^{PXQ}{\operatorname{Im}{{g}_{i}}+{{T}_{i}}}}{((PXQ)+1)}+ \\ & \theta +\int\limits_{i}^{PXQ+1}{\operatorname{Im}g(i)+neighpix(i+1)+range(PXQ)} \\ \end{align}$
$\begin{align} & Segment(\operatorname{Im}g(P,Q))= \\ & \sqrt{\begin{align} & \frac{\sum\nolimits_{i=1}^{P}{{{(\operatorname{Im}{{g}_{i}}-\delta )}^{2}}+{{({{(R+i)}_{c}}+{{((PXQ)+i)}_{c}}-T)}^{2}}}}{(R+1)+\delta }+ \\ & \max (Gi) \\ \end{align}} \\ \end{align}$
Here R indicated polynomial depiction, Img is the considered image, T is the threshold value, δ is the segmented components, R+i is the neighbour pixel considered. Let Gi is the gray level of the neighbour pixel with P and Q number pixels centred with CP pixel.
Step-2: All P and Q neighbouring numbers' mean and standard deviation are calculated correspondingly.
$\lambda =\frac{\sum\nolimits_{i=1}^{P}{{{G}_{i}}(\operatorname{Im}g(P,Q))}}{range(CP)+T}$
$\delta =\sqrt{\frac{\sum\nolimits_{i=1}^{p}{{{({{G}_{i}}-\omega )}^{2}}+{{G}_{i}}-Segment(\operatorname{Im}g(i,j))}}{P(\operatorname{Im}g(i+1))+Q(\operatorname{Im}g(j+1))}}+Th$
Step-3: The mean intensity δ and frequency distribution ⍵ of the picture pixels are determined here. The intensity values levels are used to determine if the visual material is relevant or not. The intensity values of the images are determined as follows:
$\begin{align} & PixInt(\operatorname{Im}g(P,Q))=\sum\limits_{i=1}^{P}{\omega *segmen{{t}^{i=1}}}+T \\ & where\,PixInt(\operatorname{Im}g(P,Q))=\left\{ \begin{matrix} 1 \\ 0 \\ \end{matrix} \right.\,\,\,\,\begin{matrix} if({{G}_{i}}-\delta )<{{G}_{i}}<({{G}_{i}}+\lambda ) \\ otherwise \\ \end{matrix} \\ \end{align}$
Step-4: The Contrast, dissimilarity and entropy values are calculated for the leaf image considered as:
contr $=\sum_{i=1}^{P X Q}(P X Q)_{i, j}+\operatorname{Img}(\lambda-\omega)^{2}$
Dissim $=\sum_{i,=1}^{P X Q} \mathrm{Gi}+\operatorname{PixInt}(\delta) * P(i, j)+Q(i, j)$
Entropy $=\sum_{i=}^{P X Q}-\operatorname{segment}\left(P_{i j}+Q_{i j}\right)+T$
Step-5: The image pixels are collected and saved in an array, after which they are evaluated for similarity values and spot tagging is conducted.
$SP(Si{{m}_{score}})=\frac{1}{\delta }\,\sum\limits_{i=1}^{P}{\left\{ \begin{matrix} 0 & {} \\ \max \left[ \begin{align} & \frac{1}{1+abs\left( contr(\lambda )_{n}^{(ij)+}-PixInt_{n}^{rc} \right)}, \\ & \frac{1}{1+\min \left( Seg(\operatorname{Im}g(P,Q))_{ri}^{(ij)} \right)} \\ \end{align} \right] & {} \\ \end{matrix} \right.}$
Step-6: Weights are assigned based on spot tagging, and clusters are formed, which can then be analysed to determine the disease kind. The weights are assigned to each pixel in the following order:
$\begin{aligned} W_{i, j} &=\exp \left(\frac{-\left(\operatorname{Img}_{i, j}(S P(\text { Simscore }))-\lambda(i+1)\right)^{2}}{\mathrm{SP}(\omega)+T h}\right)+\\ & \sum_{k=1}^{P X Q}\left\{\frac{|| \operatorname{Img}_{j}-\omega_{i}||}{|| \operatorname{Img}_{j}-\lambda_{j} \mid}\right\}^{M} \end{aligned}$
Step-7: After completing marking the features, the cluster's features are all tagged to a cluster set. The leaf disease categories are determined as follows:
$\operatorname{LD}(\operatorname{STM}(\operatorname{Img}(i, j)))=\sum_{i=1}^{N_{i}} \sum_{i=1}^{N}\left|i_{v}-j_{v}\right|^{2} S P(G(i) \in$
$\operatorname{LDIS}(i)$
where, SP is a pixel spot tagging level for the surrounding area.
Step-8: The relevance of pixels and adjacent pixels is evaluated, and irrelevant features are identified, while relevant features are linked.
Featureset $(L D I S(\operatorname{Img}(i)))=\sum_{i=1}^{N} \sum_{j=i}^{N_{j}} L(C g(i)+$
$\frac{\left|L D I S(i+1)^{j}\right|}{\operatorname{Min}(\operatorname{sim}(L D I I S(i, j)))+T)}+\lambda$
Step-9: By considering the spot tagging mark and the actual shape of the diseased leaf, the optimization technique is utilised to reduce the number of features analysed. The optimization is carried out as follows:
$\begin{align} & Optimization\bmod el(P,Q,\omega ,\delta )= \\ & 2\,\sum\limits_{i=1}^{M}{\sum\limits_{j=1}^{N}{\min (Featureset_{N}^{M}}}\left( 1-G\left( LDIS(i,j) \right) \right))- \\ & \left( \sum\limits_{j=i+1}^{M+N}{L{{D}_{i,j}}-\min (W)} \right) \\ \end{align}$
Step-10: Finally, the disease cluster set after performing spot tagging is performed and the diseases identified are tagged in a leaf disease data set cluster as:
$\begin{align} & ClusterSet(LDDS(i))= \\ & {{\left( \frac{{{\lambda }_{1}}}{2\omega } \right)}^{\frac{1}{N-1}}}\left[ \sum\limits_{j=1}^{N}{{{\left( \frac{1}{(1-Optimization\bmod el({{i}_{1}},{{j}_{1}}))} \right)}^{{}^{1}/{}_{M-1}}}} \right] \\ \end{align}$
$\begin{align} & DiseaseClusterSet(LDDS[N])\Rightarrow \\ & \frac{\delta }{{{\lambda }^{2}}}\left( \sum\limits_{l=1}^{N}{LD_{n}^{m}}\left( -\exp \left( \frac{-\left\| {{i}_{j}}-{{\left. {{j}_{i}} \right\|}^{2}} \right.}{{{\lambda }^{2}}} \right) \right) \right). \\ \end{align}$
}
The proposed model is implemented in python using ANACONDA SPYDER. The rice leaf disease images are considered from the link https://archive.ics.uci.edu/ml/datasets/Rice+Leaf+Diseases. Rice is one of most important agricultural crops in india with a significant impact on the country's economy. It is susceptible to several diseases in its leaves, roots, and seeds, which can lower productivity and lead to a decrease in agricultural goods [23]. Farmers have no specialised knowledge of insecticides for rice crop diseases. As a result, rice seed health monitoring using image processing and machine learning algorithms plays a vital role in enhancing rice yield and production [24]. The proposed Spot Tagging Leaf Disease Detection with Pertinent Feature Selection Model using Machine Learning Technique (SPLDPFS-MLT) is compared with the traditional AlexNet technique (AlexNet). The proposed model is compared with the traditional model in terms of Image Segmentation Levels, Pixel Extraction Accuracy Levels, Feature Extraction Time Levels, Clustering Time Levels, Spot Tagging Time Levels, Feature Selection Time Levels and Disease Detection Accuracy Levels.
Image segmentation produces either a set of sections that encompass the full image or a set of outlines taken as from image. In terms of some attributes or computed features, such as colour, intensity, or texture, each pixel in a region is comparable. In terms of the same attribute, adjacent parts have dramatically different colours. The Image Segmentation time levels of the proposed and existing models are represented in Figure 4.
Figure 4. Image segmentation time levels
In digital imaging, a pixel is the tiniest unit of information. Squares represent pixels, which are grouped in a two-dimensional grid. Each pixel is a representative of the actual picture, with more examples yielding more accurate approximations. The suggested model's pixel extraction precision levels are high, which enhances system efficiency. The pixel extraction accuracy levels of the proposed and existing models are represented in Figure 5.
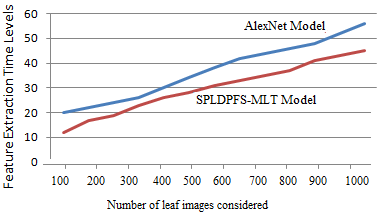
After a big batch of raw data is reduced to smaller groupings, the next stage is feature extraction. These features are straightforward to use, yet nevertheless offer a distinct and exact depiction of the data set. The suggested model has characteristics that are most relevant and can be extracted in a short amount of time, and the comparative results of extracting features time levels of the proposed and standard models are shown in Figure 6.
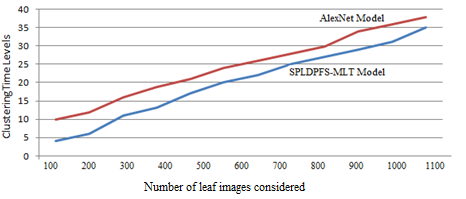
Clustering is the problem of bringing together comparable objects so that similar objects are closer to each other. Data analysis is an important activity, and this technique is widely used in various fields, including pattern recognition and image analysis. In data clustering, the data is divided into several groups, with each cluster being close to its own statistics but dissimilar to those of other clusters. It's a collection of things based on their resemblance and their difference. The clustering time levels of the proposed and existing models are represented in Figure 7.
Figure 5. Pixel extraction accuracy levels
Figure 6. Feature extraction time levels
Figure 7. Clustering time levels
The leaf images considered undergo pixel extraction and the spot tagging is performed to pixels that indicates the disease on the leaf. The spot tagging time levels of the proposed and traditional models are clearly illustrated in Figure 8.
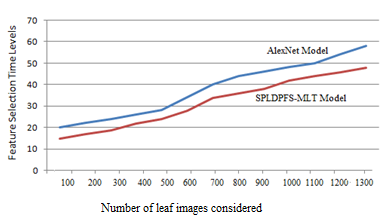
The feature selection time levels of the proposed model are less when compared to traditional method. The proposed and existing models feature selection time levels are represented in Figure 9.
The proposed model identifies the leaf disease accurately by locating the disease spots by spot tagging model and then the classifier identifies the type of the disease. The proposed model and traditional model disease detection accuracy levels are represented in Figure 10.
Figure 8. Spot tagging time levels
Figure 9. Feature selection time levels
Figure 10. Disease detection accuracy levels
Digital image processing is one of the most difficult challenges in the field of plant disease identification. The photos of paddy leaves were taken directly from the agricultural field for healthy and pathologic leaves. As part of the pre-processing, RGB photos are transformed into HSV visuals and masking is applied based on the hue portion. For the segmentation of the diseased region and the normal section, the proposed clustering algorithm is applied. In farming, the automated process is used to quickly identify disease and increase crop yield. The disease photographs were separated into regions to aid in disease identification. The proposed Spot Tagging Leaf Disease Detection with Pertinent Feature Selection Model using Machine Learning Technique model initially segments the plant leaf for accurate noise removal and pixel extraction. The proposed model considers relevant features for accurate location identification of leaf disease. According to this study, the classification provides an overall classification accuracy of 97 percent for the system. The Pertinent Feature Selection Classifier is used in this paper to identify leaf disease. Correlation, Energy, Homogeneity, Mean, Standard Deviation, and Variance are all obtained for leaf disease considered. Bacterial leaf spot, septoria leaf spot, and leaf mould condition are used to simulate damaged leaves. The features are submitted to the classifier in order to facilitate disease diagnosis and classification. In future, the number of features considered can be reduced to reduce the time complexity levels and the accuracy rate can be still improved by considering the most relevant features with high quality images for accurate predictions.
[1] Mohanty, S.P., Hughes, D.P., Salathé, M. (2016). Using deep learning for image-based plant disease detection. Frontiers in Plant Science, 7: 1419. https://doi.org/10.3389/fpls.2016.01419
[2] Lu, Y., Yi, S., Zeng, N., Liu, Y., Zhang, Y. (2017). Identification of rice diseases using deep convolutional neural networks. Neurocomputing, 267: 378-384. https://doi.org/10.1016/j.neucom.2017.06.023
[3] Ferentinos, K.P. (2018). Deep learning models for plant disease detection and diagnosis. Computers and Electronics in Agriculture, 145: 311-318. https://doi.org/10.1016/j.compag.2018.01.009
[4] Khamparia, A., Saini, G., Gupta, D., Khanna, A., Tiwari, S., de Albuquerque, V.H.C. (2020). Seasonal crops disease prediction and classification using deep convolutional encoder network. Circuits, Systems, and Signal Processing, 39(2): 818-836. https://doi.org/10.1007/s00034-019-01041-0
[5] Kamal, K.C., Yin, Z., Wu, M., Wu, Z. (2019). Depthwise separable convolution architectures for plant disease classification. Computers and Electronics in Agriculture, 165: 104948. https://doi.org/10.1016/j.compag.2019.104948
[6] Kumari, C.U., Prasad, S.J., Mounika, G. (2019). Leaf disease detection: Feature extraction with K-means clustering and classification with ANN. In 2019 3rd International Conference on Computing Methodologies and Communication (ICCMC), pp. 1095-1098. https://doi.org/10.1109/ICCMC.2019.8819750
[7] Singh, V., Misra, A.K. (2017). Detection of plant leaf diseases using image segmentation and soft computing techniques. Information processing in Agriculture, 4(1): 41-49. https://doi.org/10.1016/j.inpa.2016.10.005
[8] Waghmare, H., Kokare, R., Dandawate, Y. (2016). Detection and classification of diseases of grape plant using opposite colour local binary pattern feature and machine learning for automated decision support system. In 2016 3rd International Conference on Signal Processing and Integrated Networks (SPIN), pp. 513-518. https://doi.org/10.1109/SPIN.2016.7566749
[9] Barbedo, J.G.A. (2016). A review on the main challenges in automatic plant disease identification based on visible range images. Biosystems Engineering, 144: 52-60. https://doi.org/10.1016/j.biosystemseng.2016.01.017
[10] Mia, M.R., Roy, S., Das, S.K., Rahman, M.A. (2020). Mango leaf disease recognition using neural network and support vector machine. Iran Journal of Computer Science, 3(3): 185-193. https://doi.org/10.1007/s42044-020-00057-z
[11] Mainkar, P.M., Ghorpade, S., Adawadkar, M. (2015). Plant leaf disease detection and classification using image processing techniques. International Journal of Innovative and Emerging Research in Engineering, 2(4): 139-144.
[12] Nandhini, S.A., Hemalatha, R., Radha, S., Indumathi, K. (2018). Web enabled plant disease detection system for agricultural applications using WMSN. Wireless Personal Communications, 102(2): 725-740. https://doi.org/10.1007/s11277-017-5092-4
[13] Sharath, D.M., Kumar, S.A., Rohan, M.G., Prathap, C. (2019). Image based plant disease detection in pomegranate plant for bacterial blight. In 2019 International Conference on Communication and Signal Processing (ICCSP), 0645-0649. https://doi.org/10.1109/ICCSP.2019.8698007
[14] Deenan, S.P., Satheesh Kumar, J. (2016). Banana leaf disease detection using segmentation approach. Proceedings of the ICICTS 2016, 2(1): 145-149.
[15] Vipinadas, M.J., Thamizharasi, A. (2016). Detection and Grading of diseases in Banana leaves using Machine Learning. International Journal of Scientific & Engineering Research, 7(7): 916-924.
[16] Warne, P.P., Ganorkar, S.R. (2015). Detection of diseases on cotton leaves using K-mean clustering method. International Research Journal of Engineering and Technology (IRJET), 2(4): 425-431.
[17] Finance Ministry. (2017). Agriculture in India: information about Indian agriculture and its importance. Available: https://www.ibef.org/industry/agriculture-india.aspx.
[18] Najiya Nasreen, P., Chempak Kumar, A., Asjad Nabeel, P. (2016). Automatic classification of monocots and dicots using SVM classifier. In 2016 International Conference on Information Science (ICIS), pp. 28-31. https://doi.org/10.1109/INFOSCI.2016.7845295
[19] Prajapati, B.S., Dabhi, V.K., Prajapati, H.B. (2016). A survey on detection and classification of cotton leaf diseases. In 2016 International Conference on Electrical, Electronics, and Optimization Techniques (ICEEOT), pp. 2499-2506. https://doi.org/10.1109/ICEEOT.2016.7755143
[20] Chaudhary, S., Kumar, U., Pandey, A. (2019). A review: crop plant disease detection using image processing. Intl J Inn Tech Expl Eng, 8(1): 472-477.
[21] Khirade, S.D., Patil, A.B. (2015). Plant disease detection using image processing. In 2015 International Conference on Computing Communication Control and Automation, pp. 768-771. https://doi.org/10.1109/ICCUBEA.2015.153
[22] Gandhi, R., Nimbalkar, S., Yelamanchili, N., Ponkshe, S. (2018). Plant disease detection using CNNs and GANs as an augmentative approach. In 2018 IEEE International Conference on Innovative Research and Development (ICIRD), pp. 1-5. https://doi.org/10.1109/ICIRD.2018.8376321
[23] Rathod, A.N., Tanawala, B.A., Shah, V.H. (2014). Leaf disease detection using image processing and neural network. International Journal of Advance Engineering and Research Development (IJAERD), 1(6).
[24] Darshana, A., Majumdar, J., Ankalaki, S. (2015). Segmentation method for automatic leaf disease detection. International Journal of Innovative Research in Computer and Communication Engineering, 3(7): 7271-7282.