Usman Shuaibu Musa | Sudeshna Chakraborty | Hitesh Kumar Sharma | Tanupriya Choudhury* | Chiranjit Dutta | Bhagwant Singh
© 2021 IIETA. This article is published by IIETA and is licensed under the CC BY 4.0 license (http://creativecommons.org/licenses/by/4.0/).
OPEN ACCESS
The geometric increase in the usage of computer networking activities poses problems with the management of network normal operations. These issues had drawn the attention of network security researchers to introduce different kinds of intrusion detection systems (IDS) which monitor data flow in a network for unwanted and illicit operations. The violation of security policies with nefarious motive is what is known as intrusion. The IDS therefore examine traffic passing through networked systems checking for nefarious operations and threats, which then sends warnings if any of these malicious activities are detected. There are 2 types of detection of malicious activities, misuse detection, in this case the information about the passing network traffic is gathered, analyzed, which is then compared with the stored predefined signatures. The other type of detection is the Anomaly detection which is detecting all network activities that deviates from regular user operations. Several researchers have done various works on IDS in which they employed different machine learning (ML), evaluating their work on various datasets. In this paper, an efficient IDS is built using Ensemble machine learning algorithms which is evaluated on CIC-IDS2017, an updated dataset that contains most recent attacks. The results obtained show a great increase in the rate of detection, increase in accuracy as well as reduction in the false positive rates (FPR).
intrusion detection systems, ensemble machine learning, threat analysis, CIC-IDS2017 dataset, HIDS, MLP
In recent years, the Internet has changed not only the way people learn and grow, but it has also exposed networks and systems to far more sophisticated security threats. Cybersecurity refers to a set of processes and technologies crafted to keep computers, networks, data, and programs secured against illegitimate access, alteration, and erasure [1]. The IDS is an important research accomplishment in the area of information security. It can easily detect an intrusion, whether it is a recurring intrusion or one that has just occurred. The provision of accurate and stable IDS would be one of the most challenging aspects of cybersecurity. The ability to detect a wide range of network attacks, especially previously unknown attack forms, is a critical issue that must be addressed immediately. One of the most important developments in information protection is intrusion detection. In latest days, network intrusion detection research has primarily focused on increasing detection speed and accuracy. On one side, the study concentrates on feature selection. On the other hand, it primarily focuses on enhancing the algorithm's classification accuracy.
Anomaly-based approaches are used to study normal system activity and network traffic when evaluating network behavior. When the device or network behavior deviates from its normal or general behavior, these methods detect an anomaly or attack. Owing to their flexibility to cope with zero-day or new attacks, anomaly-based approaches are often used. Another benefit of using anomaly-based approaches is that the profile for normal device or network activity varies by program and protocol, making it difficult for an attacker to break into the system. Furthermore, the information that triggers an attack warning almost always identifies misuse. The biggest disadvantage of using an anomaly-based approach is the increased likelihood of false attack detection, also known as a false warning. When regular traffic is mistakenly identified as an attack, a false alarm occurs. The explanation for this is that there is activity that has never been observed before and is classified as an intrusion or anomaly.
IDS is a technique of detecting malicious behavior in a computer-related environment. Among the key aspect of network defense is the IDS. It is a technique that analyzes network/system functions for the detection of vulnerability, which could be exploited by attackers against a computer system. Host-based IDS (HIDS) [2], Network-based IDS (NIDS) [3, 4], (HIDS), and Wireless IDS [5, 6] are different types of IDS. There's a Hybrid IDS that blends different types of IDS. The host-based IDS control one host's operations and discover whether illicit operation occurs. HIDS mainly documents process activities and maintains the confidentiality of computer archives, file access, and registry entries. IDS methods for detecting anomalies are invaluable since an intrusion operation is different from the system's usual activity. Intrusion detection systems based on host systems (HIDS) run on individual systems which require information collection and analysis techniques for that specific system [7-9].
Multiple ML techniques have been employed in the work of [9] for the purpose of addressing the difficulties of low precision when working with low frequency attacks that have plagued previous IDS when artificial neural networks with fuzzy clustering are used. They were able to do this by dividing the heterogeneous set of training data into uniform subsets, thereby reducing the complexity of the whole training set. The proposed work used J48 decision trees, Multilayer Perceptron (MLP) [10, 11], and Bayes network algorithms, with J48 trees providing the highest precision. One of their major flaws is their failure to use feature filtering to exclude all unrelated data. Their failure to use feature filtering to exclude all unrelated, unnecessary, and unwelcome features is a significant flaw in their work.
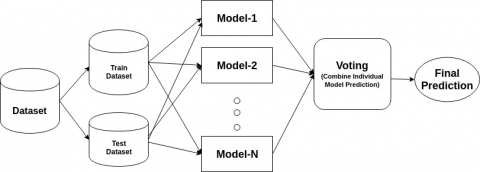
The used a voting classifier to combine the outputs of multiple supervised and unsupervised ML models in an ensemble dependent ML technique. The accuracy and efficiency of IDS was improved by using the ensemble model. They used the Kyoto-2006 dataset [12-14], and it is more appealing than the more widely used KDDCup99 dataset due to its age. This allows them to achieve a certain degree of precision, but the outcome recall is very poor in a few situations, indicating high false negative rates (FPR).
Thaseen et al. [11] suggested a real-time hybrid IDS technique in which the signature-based technique was adopted to discover defined attacks and the anomaly technique was used to discover and halt zero-day attacks. The anomaly detection technique was used to achieve a high detection rate so patterns of intrusions that escaped the misuse detection technique could be detected as an intrusion by the anomaly detection approach. The algorithm's accuracy improved progressively per day, thereby obtaining a notable accuracy percentage of 92.65 on the final day of the test. When the technique is evaluated to very large datasets, the challenge of slow detection rate remains.
A few of the previous suggested works had the disadvantage of not being able to use feature filtering on the datasets they use to exclude irrelevant, unwanted, and unnecessary functions. On the NSL-KDD dataset, Abubakar and Pranggono [13] provides various ML models with various ML algorithms and function selection methods. The accuracy obtained was significantly higher than that obtained by previous studies using the same dataset. Owing to the model's strong false positive rate and the fact that the study centered only on misuse-based threats, novel attacks went undetected, a significant downside to zero-day identification remains unexplained.
A stacking ensemble methodology was suggested in the study [14-16]. The ensemble technique involves LR, KNN, RF and SVM. The study is evaluated on UNSW-NB15 and UGR16 datasets. As UGR '16 was used, the stacking ensemble technique improved accuracy and execution time of the IDS, returning the maximum accuracy of 98.71 percent. However, further tests on various databases, including the most recent attack categories, are needed.
Perez et al. suggested a hybrid NIDS scheme using different ML models [17, 18]. Neural Network, a supervised ML model, was paired with K-Means clustering and feature extraction, an unsupervised machine learning technique. SVM and K-means clustering were used in another mix. The findings clearly demonstrated that the use of both supervised and unsupervised machine learning techniques complements each other and improves IDS accuracy [19-21]. The highest performance is obtained by combining SVM and K-means with function collection [22, 23].
On the basis of NSL-KDD some studies [24, 25] are also reported on IDS model whereby KNN and Random committee were evaluated on NSL-KDD and UNSW-NB15 datasets. In this study, a feature extraction was applied to get rid of all void and irrelevant records. According to the results obtained, the ensemble classifier method outperforms a single ML approach, with a margin of 1.19 percent for the NSLKDD dataset and 1.62 percent for the UNSW NB-15 dataset [26, 27]. Wide data sizes, high dimensionality, and normal accuracy of IDS techniques are all issues that need to be discussed in future studies.
3.1 Decision tree
Among the ML models in data mining is decision tree induction. To build a model from the pre-classified dataset, the Classification algorithm is inductively trained. Each item of data is specified by attribute values. It is possible to interpret classification as inferencing from a collection of features to a particular class. Using the values of its attributes, the DT classifies the specified data object [22]. Initially, the DT is built from a collection of pre-classified data. Selecting the attributes that excellently split the data items into their groups is the key strategy. Data objects are partitioned in accordance with these feature’s values. Each divided class of the data items is recursively added to this method. When the whole current subset's data items belong to the same class, the method terminates. A DT node defines an attribute for data partitioning [23, 24]. There are a number of edges in each node that are classed in accordance to the potential attribute value of the parent’s node. Either 2 nodes or a node and a leaf are connected by an edge. For categorization of the data, leaves are labeled with a prediction value.
3.2 Adaboost
Adaboost is a stereotypical boosting model (Figure 1), the basic concept of which is to choose and aggregate a number of poor classifiers into a strong classifier [28, 29].
PSO with K-Means algorithm [30-32] can be used for intrusion detection using machine learning approach.
Weak learners are chosen in an iterative manner from various groups of weak leaners in the AdaBoost algorithm which are then aggregated in a linear fashion to produce an improved algorithm for the classification [33]. A single weak classifier is simple and quick to implement.
Support Vector Machine (SVM) with some hybrid approach can be used for intrusion detection in network [34].
Figure 1. Adaboost classifier
3.3 Random Forest
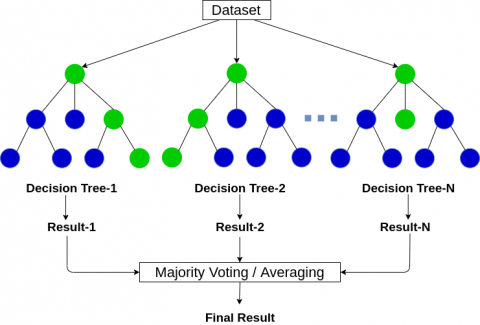
Random Forest (RF) is an ensemble classifier (Figure 2) used for accuracy improvement. The RF is made up of a number of less accurate decision tree classifiers also called weak learners. Random Forest, in comparison to traditional ML algorithms, has a least categorization error. Each node is divided based on the number of trees, the minimum size of the node, and the number of features. It is one of the available versions of the bagging ensemble as suggested by researchers. It works efficiently than boosting in some cases and quicker than bagging and boosting [7]. RF is a variant of bagging where the base classifier is a random tree. It is however, an ensemble technique where the DT is utilized as the basic classifier. In addition, a RF is an algorithm consisting of tree-contained classifiers, each of which is grown in accordance with a random vector and is independent and identically distributed. A vote is given for the most common input vector class [5] from each tree in the ensemble.
Figure 2. Random Forest classifier
4.1 Preprocessing of CICIDS-2017 dataset
4.1.1 Raw files integration
The eight CSV files of CICIDS-2017 are merged into a single CSV file making the total number of records stands at 3,119,345. As the dataset is highly imbalanced, the majority class of Machine Learning CSV data is down-sampled and used for the experiment. In this preprocessing, there are 84 regular features and one class label employed. The dataset consists of four redundant features, they are: ‘Source IP’, ‘Destination IP’, ‘Timestamp’ and ‘Flow ID’. All the fours features were deleted. Thus only 80 features are available to be evaluated after deleting the redundant features.
4.1.2 Data balancing
In intrusion detection system [35] models designed using machine learning techniques, there is always arises the issues of high-dimensional features, especially when dealing with very big size datasets. These issues often lead to prolonged classification processes. However, such big size is highly imbalanced, that means, the number of legit traffic records is far larger in comparison to the attacks traffics. It always makes machine learning algorithm or model to bias to a particular class when the number of that class is far greater than the records in the other category. The aforementioned issues in the dataset can be addressed by balancing the dataset. Therefore, I carried out balancing by adopting a down-sampling approach using a downloading factor, α, of 0.3, as shown in equation 1 below:
NRM=αUS!NM (1)
where, NRM is the no of records after under-sampling, αUS is the ratio of under-sampling, NM is the number of original samples.
4.1.3 Data cleaning
As part of the data cleaning, the dataset has a great number of records with null values, and of course null values could not be consumed by machine learning algorithms. I deleted these values since they stand for only a small portion of the total number of samples, reducing the total number of dataset records to 2,827,876 with 80 columns of regular features and a single Normal class label.
4.1.4 Data transformation
To reduce the detection rate, the fifteen flows (class labels) collected were transformed to 7 types based on attack scenarios. This is shown in the Table 1 below:
Table 1. Class label transformation
|
New Label |
Old Label |
|
Benign |
Benign |
|
Bot |
Bot |
|
Bruteforce |
FTP Patator SSH Patator |
|
DoS/DDoS |
DDoS DoS GoldenEye DoS Hulk DoS Slowhttptest DoS Slowloris Heartbleed |
|
New Label |
Old Label |
|
Infiltration |
Infiltration |
|
Portscan |
Portscan |
|
Web Attack |
Web Attack-Bruteforce Web Attack-SQL Injection Web Attack-XSS |
4.2 Feature extraction
The remaining features of Machine Learning CSV data is divided into 2 pieces, 70 percent and 30 percent after relabeling the attack groups. The 70 percent section is employed for training the dataset and the 30 percent testing data. The experimental findings in [5, 15] show that the utilization of the training and testing data section of 70:30 corresponds to the same degree of accuracy as the 80:20 and 60:40 sections. Meanwhile, in other work by, the experimental outcome of using the 70:30 data section results in high accuracy. Two methods were used for feature extraction, they are; Decision tree and Correlation Attribute evaluation. The various ranks of features were compared using the two adopted methods in which the most relevant features were selected and categorized in to four different groups with different weights.
4.2.1 Decision tree (Feature importance)
In this method, the feature importance of each feature in the dataset was firstly gotten as a whole, with the help of decision tree algorithm. Among the foremost advantages of decision tree is interoperability. This allows each feature’s importance to be compared. Features having splits with greater mean often decrease in impurity. The scikit-Learn of the ML library is used by decision tree to describe the relative-importance of all features. The method allocates numbers within the range of 0-1 for all features and the sum of importance of all the features equals 1.
4.2.2 Correlation attribute evaluation
This method finds the correlation among the features. A feature is considered redundant when at anytime a correlation between the feature and other features is high. The correlation between any two features in evaluated using correlation function. The threshold is set to as whenever the correlation between two features is exceeded, then the correlation is considered highly and one of the features will be considered redundant.
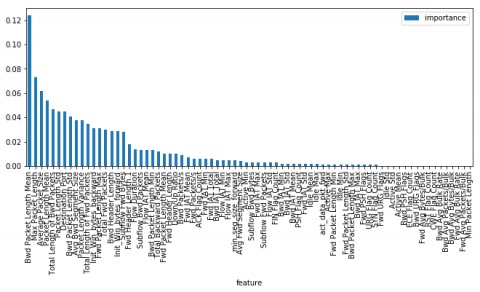
Figure 3 below shows how various features were ranked based on the value of their weights. As it is shown in table, ‘Average Packet Size’ has the largest weight while the ‘CWE Flag Count’ has the least weight.
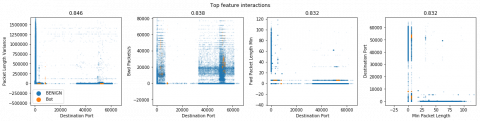
In Figure 4, we have displayed a graphical view to show the interaction between different features of dataset. These graphs are the output of exploratory analysis of the given dataset. It helped to focus on relevant feature rather than focus on non-relevant features. In Table 2, we have listed the features and ranked them based on their importance. The top importance score feature has been ranked on top and subsequently gave low ranking.
Figure 3. Ranked features based on feature importance
Figure 4. Top feature interaction graph
Table 2. Ranking features based on feature importance
|
Rank |
Featurename |
Importance |
Rank |
Feature_name |
Importance |
|
1 |
Average Packet Size |
0.35388 |
41 |
SubflowBwd Packets |
0.000102 |
|
2 |
Bwd Packet Length Std |
0.296899 |
42 |
Bwd Packet Length Max |
9.17E-05 |
|
3 |
Source Port |
0.11749 |
43 |
Fwd Header Length.1 |
8.70E-05 |
|
4 |
Destination Port |
0.080011 |
44 |
Active Max |
8.45E-05 |
|
5 |
Bwd Header Length |
0.054925 |
45 |
Fwd Packets/s |
6.15E-05 |
|
6 |
Init_Win_bytes_forward |
0.02314 |
46 |
Fwd IAT Std |
5.84E-05 |
|
7 |
min_seg_size_forward |
0.013517 |
47 |
Idle Min |
5.56E-05 |
|
8 |
Max Packet Length |
0.013075 |
48 |
Fwd IAT Total |
5.05E-05 |
|
9 |
Flow IAT Min |
0.007659 |
49 |
Flow Bytes/s |
4.10E-05 |
|
10 |
Active Std |
0.004592 |
50 |
Fwd Packet Length Mean |
2.99E-05 |
|
11 |
Fwd IAT Min |
0.004006 |
51 |
Active Min |
2.11E-05 |
|
12 |
Bwd IAT Std |
0.00322 |
52 |
Flow Packets/s |
2.05E-05 |
|
13 |
Init_Win_bytes_backward |
0.00271 |
53 |
Idle Mean |
1.73E-05 |
|
14 |
SubflowFwd Packets |
0.002442 |
54 |
SubflowBwd Bytes |
1.64E-05 |
|
15 |
PSH Flag Count |
0.001898 |
55 |
Active Mean |
1.62E-05 |
|
16 |
Packet Length Mean |
0.001772 |
56 |
FIN Flag Count |
1.44E-05 |
|
17 |
Fwd Packet Length Std |
0.001728 |
57 |
Bwd IAT Max |
1.43E-05 |
|
18 |
Flow IAT Mean |
0.001657 |
58 |
Fwd PSH Flags |
1.40E-05 |
|
19 |
Fwd Header Length |
0.001639 |
59 |
act_data_pkt_fwd |
8.65E-06 |
|
20 |
SubflowFwd Bytes |
0.00156 |
60 |
ACK Flag Count |
7.19E-06 |
|
21 |
Bwd IAT Mean |
0.001407 |
61 |
Fwd Packet Length Max |
4.66E-06 |
|
22 |
Min Packet Length |
0.00118 |
62 |
Total Backward Packets |
4.61E-06 |
|
23 |
Flow IAT Std |
0.001176 |
63 |
Bwd Packet Length Min |
2.32E-06 |
|
24 |
Down/Up Ratio |
0.001055 |
64 |
Idle Std |
6.56E-07 |
|
25 |
Packet Length Std |
0.001 |
65 |
Protocol |
0 |
|
26 |
Total Length of Bwd Packets |
0.000837 |
66 |
Idle Max |
0 |
|
27 |
Bwd IAT Min |
0.000727 |
67 |
RST Flag Count |
0 |
|
28 |
Bwd Packet Length Mean |
0.000655 |
68 |
Bwd URG Flags |
0 |
|
29 |
Fwd Packet Length Min |
0.000606 |
69 |
Bwd PSH Flags |
0 |
|
30 |
Total Length of Fwd Packets |
0.000536 |
70 |
Fwd URG Flags |
0 |
|
31 |
Bwd Packets/s |
0.000391 |
71 |
Bwd Avg Bulk Rate |
0 |
|
32 |
Avg Bwd Segment Size |
0.000345 |
72 |
Bwd Avg Packets/Bulk |
0 |
|
33 |
Flow Duration |
0.000285 |
73 |
Bwd Avg Bytes/Bulk |
0 |
|
34 |
Flow IAT Max |
0.000243 |
74 |
Fwd Avg Bulk Rate |
0 |
|
35 |
Total Fwd Packets |
0.000216 |
75 |
Fwd Avg Packets/Bulk |
0 |
|
36 |
URG Flag Count |
0.000203 |
76 |
Fwd Avg Bytes/Bulk |
0 |
|
37 |
Fwd IAT Max |
0.000137 |
77 |
Avg Fwd Segment Size |
0 |
|
38 |
Bwd IAT Total |
0.000129 |
78 |
ECE Flag Count |
0 |
|
39 |
Fwd IAT Mean |
0.000122 |
79 |
SYN Flag Count |
0 |
|
40 |
Packet Length Variance |
0.000105 |
80 |
CWE Flag Count |
0 |
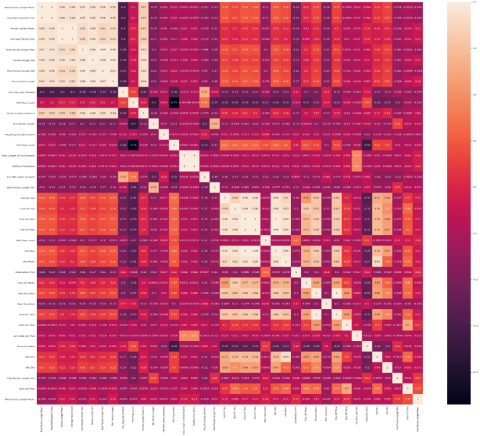
Figure 5. Feature correlation heatmap
4.2.3 Selection of correlated features
Selection of correlated features is an important process for effective analysis. There are many extra features in this dataset those are non-correlated to each other. So, eliminate these unwanted features is the first task to perform. Some of the most important advantages of selection process are given below.
(1) It reduces overfitting;
(2) It helps in improving accuracy;
(3) It helps in reducing training time.
Correlation is a statistical approach which helps to decide how one variable is changing its values on changing value of other parameters. In Figure 5, we have shown a heat map for correlation between different features of dataset. Using this heat map we can see that first 6-8 features are more correlated with other.
4.3 Evaluation indicator
In this paper as the result of abnormal flow detection, we applied the following performance metrics, they are false positive rate, detection rate, accuracy and F-Score.
Detection Rate=$\frac{T P}{T P+F N}$
Accuracy Rate=$\frac{T P+T N}{T P+F N+F P+T N}$
Precision=$\frac{T P}{T P+F P}$
False Positive Rate=$\frac{F P}{F P+T N}$
True Positive (TP) refers to the number of real threats identified as such, True Negative (TN) refers to the number of real natural labels classified as such, False Positive (FP) refers to the number of legitimate activities identified as threats, and False Negative (FN) refers to the number of genuine attacks classified as normal flows. Table 3 below describes the composition of confusion matrix:
Table 3. Confusion matrix
|
|
Predictive attack |
Predictive normal |
|
Primitive attack |
TP |
FN |
|
Primitive normal |
FP |
TN |
The F-Score is a mathematical technique for evaluating a system's accuracy by taking both precision and recall into account. It is given by the following equation:
F-Score=$\frac{2(\text { Precision } * \text { Recall })}{\text { Precision }+\text { Recall }}$
4.4 Description of the dataset
The Canadian Institute for Cybersecurity (CIC) created the CIC-IDS2017 dataset in 2017. It is made up of the regular and recent typical attacks. It is one of the up to date datasets for intrusion detection. It consists of 3,119,345 records spread on 8 separate files and has 85 distinct labeled features in each record. The attention of researchers was drawn by the dataset to study and create new models and algorithms right from the time it was launched by the Canadian Institute of Cybersecurity. The dataset spanned over eight separate files, according to the author of CI- CIDS2017, containing five days of regular traffic data and attacks. A brief overview of all these files is given in Table 4.
Table 4 shows that the dataset is made up of traffic data for five days of attack information. Thursday afternoon working hours and Friday records are suitable for binary classification; likewise, morning data from Tuesday, Wednesday and Thursday is best for developing a multi-class classification approach. However, an effective detection model should be capable of detecting different attacks. Therefore, in order to model such typical IDS, all-day traffic data should be combined to generate a single dataset to be applied by the IDS. This is precisely what followed in order to combine these records of data traffic.
Table 4. Overview of CICIDS-2017 Dataset CSV files [36-38]
|
Name of Files |
Day Activity |
Attacks Found |
|
Monday-WorkingHours.pcap_ISCX.csv |
Monday |
Benign |
|
Tuesday-WorkingHours.pcap_ISCX.csv |
Tuesday |
Benign FTP SSH |
|
Wednesday-workingHours.pcap_ISCX.csv |
Wednesday |
Benign DOS Goldeneye DoS Hulk DoS Slowhttptest Heartbleed |
|
Thursday-WorkingHours-Afternoon-Infilteration.pcap_ISCX |
Thursday |
Benign Web Attack –Brute Force Web Attack –SQL Injection Web Attack –XSS |
|
Thursday-WorkingHours-Morning-WebAttacks.pcap_ISCX. |
Thursday |
Benign Infiltration |
|
Friday-WorkingHours-Afternoon-DDos.pcap_ISCX.csv |
Friday |
Benign Bot |
|
Friday-WorkingHours-Afternoon-PortScan.pcap_ISCX.csv |
Friday |
Benign PortScan |
|
Friday-WorkingHours-Morning.pcap_ISCX.csv |
Friday |
Benign DDoS |
5.1 Testing the performance of the selected features
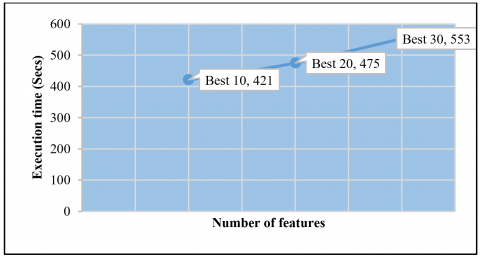
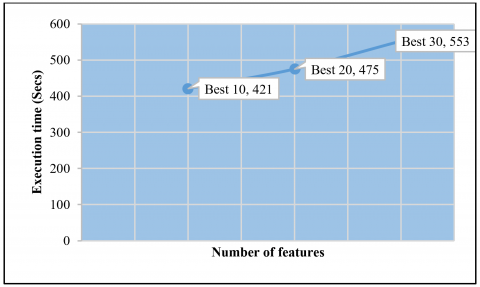
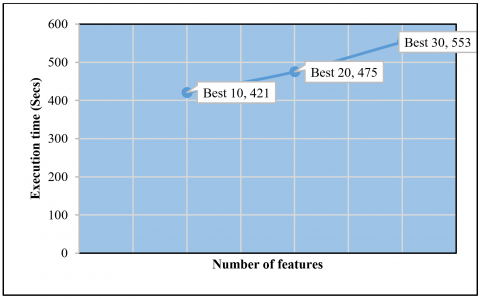
As it was mentioned in the previous section, the features chosen were classified into 3 different groups. The first group contains the features having weight/feature importance greater than 0.00333, the second group consists features with weights greater than 0.001609 and the third group is made up of features having weight greater than 0.004628. Tables 5-7 below show the performance of the various groups of features in terms of accuracy and execution time when they are evaluated using decision tree, Adaboost and Random Forest machine learning algorithms respectively. Also Figures 6, 7, and 8 visualizes how the three algorithms performed in terms of execution time.
Table 5. Performance of features (weight>0.004628)
|
Algorithm |
Accuracy |
Execution Time (s) |
|
Decision Tree |
99.9512% |
84 |
|
Adaboost |
99.0508% |
342 |
|
Random Forest |
99.9464% |
421 |
Table 6. Performance of features (weight>0.001609)
|
Algorithm |
Accuracy |
Execution Time (s) |
|
Decision Tree |
99.95% |
92 |
|
Adaboost |
99.1213% |
382 |
|
Random Forest |
99.9461% |
475 |
Table 7. Performance of features (weight>0.000333)
|
Algorithm |
Accuracy |
Execution Time (s) |
|
Decision Tree |
99.9512% |
103 |
|
Adaboost |
99.0508% |
428 |
|
Random Forest |
99.9448% |
553 |
Figure 6. Execution time for decision tree
Figure 7. Execution time for Adaboost
Figure 8. Execution time for Random Forest
Among three algorithms, decision tree takes the least time for execution for the three different groups of features. The accuracy of the algorithms decreases as the number of features of the dataset decreases, though it remains steady for the Aadaboost algorithm.
Much attention has been given to the great task of maintaining the availability, integrity and confidentiality of networks by various network researchers. In this work, a more recent and up to date dataset which is CICIDS-2017 dataset is chosen. It consists of updated attack traffics. A data preprocessing was performed in which all null values, irrelevant and redundant features were removed. The selected features were then classified into three different groups each having features in the range of a particular weight value. All the three groups of the features were evaluated using decision tree, Adaboost and random forest machine learning algorithms. As it was shown in the above sections, as the number of dataset features decreases, accuracy decreases slightly while the execution time increases. In our adopted approach a significant improvement in the increase in accuracy, decrease in the false positive rate as well as decrease in the execution time was recorded.
[1] Zaman, M., Lung, C.H. (2018). Evaluation of machine learning techniques for network intrusion detection. In NOMS 2018-2018 IEEE/IFIP Network Operations and Management Symposium, Taipei, Taiwan, pp. 1-5. https://doi.org/10.1109/NOMS.2018.8406212.
[2] Amira, A.S., Hanafi, S.E.O., Hassanien, A.E. (2017). Comparison of classification techniques applied for network intrusion detection and classification. Journal of Applied Logic, 24: 109-118. https://doi.org/10.1016/j.jal.2016.11.018.
[3] Bhavsar, P., Jhunjhunwala, P., D’Mello, L. (2020). Attribute reduction for medical data analysis using rough set theory. In Advanced Computing Technologies and Applications, pp. 325-335.
[4] Gaikwad, D.P., Thool, R.C. (2015). Intrusion detection system using bagging ensemble method of machine learning. In 2015 International Conference on Computing Communication Control and Automation, pp. 291-295. https://doi.org/10.1109/ICCUBEA.2015.61
[5] Panigrahi, R., Borah, S. (2018). A detailed analysis of CICIDS2017 dataset for designing Intrusion Detection Systems. International Journal of Engineering & Technology, 7(3.24): 479-482.
[6] Roshan, S., Miche, Y., Akusok, A., Lendasse, A. (2018). Adaptive and online network intrusion detection system using clustering and extreme learning machines. Journal of the Franklin Institute, 355(4): 1752-1779. https://doi.org/10.1016/j.jfranklin.2017.06.006.
[7] Gupta, S., Verma, H.K., Sangal, A.L. (2012). Analysis and removal of vulnerabilities in masquerading attack in wireless sensor networks. Int. J. Comput. Technol. Electron. Eng.(IJCTEE), 2(3).
[8] Sangkatsanee, P., Wattanapongsakorn, N., Charnsripinyo, C. (2011). Practical real-time intrusion detection using machine learning approaches. Computer Communications, 34(18): 2227-2235. https://doi.org/10.1016/j.comcom.2011.07.001
[9] Nader, P., Honeine, P., Beauseroy, P. (2016). Detection of cyberattacks in a water distribution system using machine learning techniques. In 2016 Sixth International Conference on Digital Information Processing and Communications (ICDIPC), Beirut, Lebanon, pp. 25-30. https://doi.org/10.1109/ICDIPC.2016.7470786
[10] Atefi, K., Yahya, S., Rezaei, A., Hashim, S.H.B.M. (2016). Anomaly detection based on profile signature in network using machine learning technique. In 2016 IEEE Region 10 Symposium (TENSYMP), Bali, Indonesia, pp. 71-76. https://doi.org/10.1109/TENCONSpring.2016.7519380
[11] Thaseen, I.S., Poorva, B., Ushasree, P.S. (2020). Network intrusion detection using machine learning techniques. In 2020 International Conference on Emerging Trends in Information Technology and Engineering (ic-ETITE), Vellore, India, pp. 1-7. https://doi.org/10.1109/ic-ETITE47903.2020.148
[12] Li, Z., Rios, A.L.G., Xu, G., Trajković, L. (2019). Machine learning techniques for classifying network anomalies and intrusions. In 2019 IEEE International Symposium on Circuits and Systems (ISCAS), Sapporo, Japan, pp. 1-5. https://doi.org/10.1109/ISCAS.2019.8702583
[13] Abubakar, A., Pranggono, B. (2017). Machine learning based intrusion detection system for software defined networks. 2017 Seventh International Conference on Emerging Security Technologies (EST), pp. 138-143. https://doi.org/10.1109/EST.2017.8090413
[14] Jabbar, M.A., Aluvalu, R., Reddy, S.S.S. (2017). Cluster based ensemble classification for intrusion detection system. In Proceedings of the 9th International Conference on Machine Learning and Computing, pp. 253-257. https://doi.org/10.1145/3055635.3056595
[15] Naganhalli, N.S., Terdal, S. (2019). Network intrusion detection using supervised machine learning technique. Int. J. Sci. Technol. Res, 8(9): 345-350.
[16] Hrabovsky, J., Segec, P., Moravcik, M., Papan, J. (2018). Trends in application of machine learning to network-based intrusion detection systems. In International Conference on Innovations for Community Services, pp. 218-228. https://doi.org/10.1007/978-3-319-93408-2_16
[17] Peddabachigari, S., Abraham, A., Thomas, J. (2004). Intrusion detection systems using decision trees and support vector machines. International Journal of Applied Science and Computations, USA, 11(3): 118-134.
[18] Perez, D., Astor, M.A., Abreu, D.P., Scalise, E. (2017). Intrusion detection in computer networks using hybrid machine learning techniques. 2017 XLIII Latin American Computer Conference (CLEI), pp. 1-10, https://doi.org/10.1109/CLEI.2017.8226392
[19] Dias, L.P., Cerqueira, J.D.J.F., Assis, K.D., Almeida, R.C. (2017). Using artificial neural network in intrusion detection systems to computer networks. In 2017 9th Computer Science and Electronic Engineering (CEEC), Colchester, UK, pp. 145-150. https://doi.org/10.1109/CEEC.2017.8101615
[20] Manzoor, M.A., Morgan, Y. (2016). Real-time support vector machine based network intrusion detection system using Apache storm. In 2016 IEEE 7th Annual Information Technology, Electronics and Mobile Communication Conference (IEMCON), Vancouver, BC, Canada, pp. 1-5. https://doi.org/10.1109/IEMCON.2016.7746264
[21] Manzoor, I., Kumar, N. (2017). A feature reduced intrusion detection system using ANN classifier. Expert Systems with Applications, 88: 249-257. https://doi.org/10.1016/j.eswa.2017.07.005
[22] Sharma, H.K., Kshitiz, K. (2018). NLP and machine learning techniques for detecting insulting comments on social networking platforms. In 2018 International Conference on Advances in Computing and Communication Engineering (ICACCE), Paris, France, pp. 265-272. https://doi.org/10.1109/ICACCE.2018.8441728
[23] Sarkar, T., Choudhury, T., Salauddin, M., Hazra, S.K., Chakraborty, R. (2021). Comparative approach of artificial neural network and thin layer modelling for drying kinetics and optimization of rehydration ratio for Bael (Aegle marmelos (L) correa) Powder Production. Economic Computation and Economic Cybernetics Studies and Research, 55(1).
[24] Meena, G., Choudhary, R.R. (2017). A review paper on IDS classification using KDD 99 and NSL KDD dataset in WEKA. 2017 International Conference on Computer, Communications and Electronics (Comptelix), pp. 553-558. https://doi.org/10.1109/COMPTELIX.2017.8004032
[25] Thomas, R., Pavithran, D. (2018). A survey of intrusion detection models based on NSL-KDD data set. 2018 Fifth HCT Information Technology Trends (ITT), pp. 286-291. https://doi.org/10.1109/CTIT.2018.8649498
[26] Mogal, D.G., Ghungrad, S.R., Bhusare, B.B. (2017). NIDS using machine learning classifiers on UNSW-NB15 and KDDCUP99 datasets. International Journal of Advanced Research in Computer and Communication Engineering (IJARCCE), 6(4): 533-537. https://doi.org/10.17148/ijarcce.2017.64102
[27] Kasongo, S.M., Sun, Y. Performance Analysis of Intrusion Detection Systems Using a Feature Selection Method on the UNSW-NB15 Dataset. J Big Data 7, 105 (2020). https://doi.org/10.1186/s40537-020-00379-6
[28] Gaikwad, D.P., Thool, R.C. (2015). Intrusion detection system using bagging with partial decision treebase classifier. Procedia Computer Science, 49: 92-98. https://doi.org/10.1016/j.procs.2015.04.231
[29] Lin, W.C., Ke, S.W., Tsai, C.F. (2015). CANN: An intrusion detection system based on combining cluster centers and nearest neighbors. Knowledge-Based Systems, 78: 13-21. https://doi.org/10.1016/j.knosys.2015.01.009
[30] Syarif, A.R., Gata, W. (2017). Intrusion detection system using hybrid binary PSO and K-nearest neighborhood algorithm. In 2017 11th International Conference on Information & Communication Technology and System (ICTS), Surabaya, Indonesia, pp. 181-186. https://doi.org/10.1109/ICTS.2017.8265667
[31] Liang, C., Shanmugam, B., Azam, S., Jonkman, M., De Boer, F., Narayansamy, G. (2019). Intrusion detection system for Internet of Things based on a machine learning approach. In 2019 International Conference on Vision Towards Emerging Trends in Communication and Networking (ViTECoN), Vellore, India, pp. 1-6. https://doi.org/10.1109/ViTECoN.2019.8899448
[32] Meryem, A., Ouahidi, B.E. (2020). Hybrid intrusion detection system using machine learning. Network Security, 2020(5): 8-19. https://doi.org/10.1016/S1353-4858(20)30056-8
[33] Mazini, M., Shirazi, B., Mahdavi, I. (2019). Anomaly network-based intrusion detection system using a reliable hybrid artificial bee colony and AdaBoost algorithms. Journal of King Saud University-Computer and Information Sciences, 31(4): 541-553. https://doi.org/10.1016/j.jksuci.2018.03.011
[34] Al-Yaseen, W.L., Othman, Z.A., Nazri, M.Z.A. (2017). Multi-level hybrid support vector machine and extreme learning machine based on modified K-means for intrusion detection system. Expert Systems with Applications, 67: 296-303. https://doi.org/10.1016/j.eswa.2016.09.041
[35] Verma, P., Anwar, S., Khan, S., Mane, S.B. (2018). Network intrusion detection using clustering and gradient boosting. In 2018 9th International Conference on Computing, Communication and Networking Technologies (ICCCNT), Bengaluru, India, pp. 1-7. https://doi.org/10.1109/ICCCNT.2018.8494186
[36] Reis B., Maia E., Praça I. (2020) Selection and Performance Analysis of CICIDS2017 Features Importance. In: Benzekri A., Barbeau M., Gong G., Laborde R., Garcia-Alfaro J. (eds) Foundations and Practice of Security. FPS 2019. Lecture Notes in Computer Science, vol 12056. Springer, Cham. https://doi.org/10.1007/978-3-030-45371-8_4
[37] https://www.unb.ca/cic/datasets/ids-2017.html.
[38] https://www.kaggle.com/cicdataset/cicids2017.