Q3 Accuracy and SOV Measure Analysis of Application of GA in Protein Secondary Structure Prediction

Subhendu Bhusan Rout* | Sasmita Mishra | Susanta Kumar Sahoo
© 2021 IIETA. This article is published by IIETA and is licensed under the CC BY 4.0 license (http://creativecommons.org/licenses/by/4.0/).
OPEN ACCESS
The protein secondary structure prediction (PSP) of the large biological molecule protein is an important task of bioinformatics and in the last decades many machines learning and soft computing methodologies play vital roles in achieving satisfactory results. The protein structural class determination is an important topic in protein science because an idea about protein structural class is quite useful to know about the changes and reaction of a living body in order to design new drugs and medicines. Though several hard computing techniques may be helpful in these areas but focusing upon the steady development and big data size in protein sequences that are entering into databanks, it is a challenge to do experiments with the hard computing techniques. Soft computing techniques like Artificial Neural Network, Fuzzy logic, Genetic Algorithm play a vital role for these types of genomic researches. To face these complex challenges, this article presents a novel method to predict the protein structure by using Genetic Algorithm. The Q3 accuracy and SOV measure analysis with SOVH, SOVE, SOVC value of respective α-helix (H), β-sheet (E) and coil/loop(C) structures are also discussed. The application of Genetic algorithm i.e. the proposed technique GApred provides better result than that of SPIDER2, JPred4, FSVM and SSpro5 for all the three datasets in the experiment. This method is helpful for distinct protein secondary structure prediction and a significant success rate was observed, which indicates that it can be used as a powerful tool in drug design and medicine research.
SOVH, SOVE, SOVC, Q3 accuracy, Jpred4, PSP problems, amino acids, SSpro5
Protein structure prediction is the basic problem related to the area of bioinformatics which deals with the prediction and analysis of macromolecule protein. It is the basic steps towards estimating the 3D structure, as well as its function. Though tremendous effort has been made to the protein secondary structure prediction problem, and several research techniques has already developed still this area attracts new researchers due to the heavy growth of genomic species and genomic data. The amino acid sequence in a protein molecule is the basic or primary structure [1]. Twenty number of amino acids and approximately one lakh proteins found in a living body where the amino acids are in different percentage. The Secondary structure is a non-linier arrangement with different regularities of different amino acids with respect to each other. The basic secondary structure has 3 regular forms: α-helix (H), β-sheet (E) and loops or coils (C) [2]. From these secondary structures, the tertiary structures are derived [3]. In a protein molecule the three dimensional structure is responsible for the functional properties of proteins.
Genetic Algorithm has huge applications for many biological problems. Genetic Algorithms (GAs) are machine learning adaptive heuristic search algorithm that based on the evolutionary ideas of natural selection and genetics. The GA evolutionary algorithm behaves just like the Darwin’s theory of evolution. Genetic Algorithm is an application model of machine learning technique that represents its behaviour of the system in the form of a metaphor of the processes. Genetic Algorithm can be applied for protein structure prediction problem. A typical protein contains about 32% alpha helices, 21% beta sheets and 47% loops or the non-regular structures [4]. Generally, it is difficult to predict 100% accurate protein structure because of the size of the data sets and only 20 different amino acids with the no of ways it generates similar structure in proteins by different amino acids is approximately one lakh in number with a difference in their percentage. Genetic algorithm has its own properties that it does not break easily even if there is the deviation in input slightly. It provides the output with the predefined learning methods.
This Paper is organized as follows. The Section 2 provides a brief idea about Q3accuracy and SOV measure analysis. The related background along with literature details discussed in this chapter. In section 3 we have discussed about Q3accuracy with different methodology with three data sets i.e. RS126, CB513 and 5IJN. Similarly in section 4 we have compared the SOV measure analysis of our proposed GApred along with other metrologies i.e. SPIDER2 [5], JPred4 [6], FSVM [7] and SSpro5 [8]. Finally the section 5 concludes with conclusion and future work.
The Q3 accuracy is well known for the overall accuracy measure in protein secondary structure prediction. Similarly, Matthews correlation coefficients (MCC) [9], Segment overlap (SOV) [10] measure is two more parameter regarding the accuracy and quality measure in PSP problem. The Q3 accuracy as well as MCC measurements are accuracy indexes of prediction for every individual amino acid. Repeatedly the α-helices and β-sheets are composed of many adjacent amino acids sequences [11, 12]. The high prediction accuracy of every single residue does not guarantee the accuracy of secondary structure prediction is also relatively high. So, in this situation we may use the SOV scores, which is a considered as a more strict measure on the accuracy of secondary structure prediction.
2.1 The Q3 accuracy
The Q3 accuracy measure is the overall accuracy in which Mij always denotes the number of residues observed in the state i and predicted as in the state j, where $\mathrm{i}, \mathrm{j} \in\{\mathrm{H}, \mathrm{E}, \mathrm{C}\}$. The overall accuracy Q3 [13] may be defined as:
$\mathrm{Q}_{3}=\frac{1}{N} \sum_{i=1}^{3} M_{i j}$ (1)
where the total number of amino acid residue is denoted by N. For each category of secondary structure, the accuracy can be calculated as:
$\mathrm{Q}_{\mathrm{i}}=\frac{1}{n_{\mathrm{i}}} M_{i j}$ (2)
where ni is denoted as the total number of amino acid residues in the state i.
2.2 The segment overlap measure (SOV)
The SOV is calculated based on an average overlap between the observed with predicted segments. For a particular state $\mathrm{i} \in\{\mathrm{C}, \mathrm{E}, \mathrm{H}\}$, it is defined as [7]:
$S O V_{i}=\frac{1}{n_{i}} \sum_{S_{i}} \frac{\operatorname{MINOV}\left(S_{1}, S_{2}\right)+\operatorname{DELTA}\left(S_{1}, S_{2}\right)}{\operatorname{MAXOV}\left(S_{1}, S_{2}\right)}$
Here S1, S2 are considered as the observed and predicted secondary structure segments respectively in the state $\mathrm{i} \in\{\mathrm{C}, \mathrm{E}, \mathrm{H}\}$, Si is the number of all overlapping segment pairs (S1,S2) in the state i, MINOV(S1,S2) is the length of the actual overlap of S1 and S2, MAXOV(S1,S2) is the length of the total extent for which either of the segments S1 or S2 has a residue in the state i and ni is represents total number of amino acids residues observed during the state i. The definition of DELTA (S1,S2) is:
$\operatorname{DELTA}\left(S_{1}, S_{2}\right)=\operatorname{MIN}\left\{\begin{array}{c}\operatorname{MAXOV}\left(S_{1}, S_{2}\right)-\operatorname{MINOV}\left(S_{1}, S_{2}\right) \\ \operatorname{MINOV}\left(S_{1}, S_{2}\right) \\ \operatorname{INT}\left(0.5 \times \operatorname{LEN}\left(S_{1}\right)\right) \\ \operatorname{INT}\left(0.5 \times \operatorname{LEN}\left(S_{2}\right)\right)\end{array}\right\}$
where LEN(S1) denotes the number of amino acid residues during the segment S1 and INT represents the round down function. The SOV for all three states is given by:
$\mathrm{SOV}=\frac{1}{N} \sum_{i \epsilon H, E, C} \sum_{S(i)}\left(\frac{\operatorname{MINOV}\left(S_{1}, S_{2}\right)+D E L T A\left(S_{1}, S_{2}\right)}{\operatorname{MAXOV}\left(S_{1}, S_{2}\right)} \times L E N\left(S_{1}\right)\right)$
Here S(i) is the number of all overlapping segment pairs (S1,S2) in the state i.
The three algorithms GA, FSVM and ANN [14] is applied for prediction of the secondary structure of protein for three independent data sets RS126, CB513 and 5IJN. The results are compared for the three data sets. The basic genetic algorithm directly applies to handle the growth and decrease in amino acid composition during the application of medicine so as to predict the structure. We have compared the results obtained from applying FSVM and the traditional ANN technologies [15] for the three data sets with changing in its amino acid composition in a simulation platform. All the techniques applied with a 7-fold cross validation for the achievement of optimal values of C, g by a grid-search. For FSVM, C = 37.65 and g = 0.021; for ANN, C = 24.6 and g = 0.26; for GA, C = 1.2 and g = 0.2 respectively.
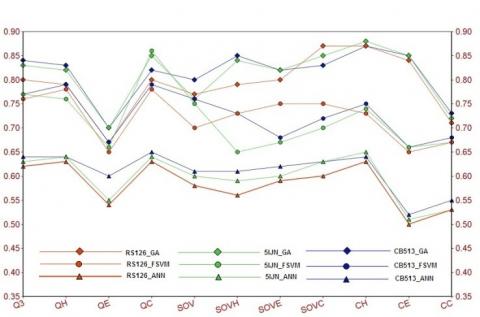
Figure 1. Prediction comparison among the FSVM, ANN and GA for RS126, CB513 and 5IJN
As shown in Figure 1, results from RS126, CB513 and 5IJN were represented by red, green and blue lines, respectively. Similarly, the different methods simulation points represented by circle, triangle and diamond for FSVM, ANN and GA respectively. The Secondary Structure Prediction targets at predicting each amino acid in a protein sequence as α-helix (H), β-sheet (E) or coil (C) from its primary amino acid sequence. Similarly considering the easy and effective 3D structure X-ray crystallography, nuclear magnetic resonance (NMR) spectrograph and electron microscopy are popular methods. As shown in Figure 1, CH, CE and CC indicate correlation coefficient of α-helix (H), β-sheet (E) and coil (C).
Comparing the performance of ANN and GA for RS126 the application of GA achieved an improvement of 8.9%, 7.7%, and 6.4% in QH, QE, QC values, and 3.8%, 3.4%, and 6.2% in SOVH, SOVE, SOVc scores on the two curves respectively. Compared to FSVM, Applying GA for RS126 the same experiment achieved an improvement of 1.7%, 2.6%, and 2.9% in Q3 values, and 2.2%, 1.4%, and 2.1% in SOV scores, respectively. The GA pred provides better result for other evaluating indexes. Similarly compared to the performance of ANN for 5IJN the application of GA achieved an improvement of 7.8%, 5.7%, and 6.3% in Q3 values, and 3.6%, 4.2%, and 5.3% in SOV scores, respectively. In Comparison to FSVM, Applying GA for 5IJN the same experiment achieved an improvement of 2.9%, 3.1%, and 4.2% in Q3 values, and 3.2%, 2.4%, and 2.8% in SOV scores, respectively. The Genetic Algorithm application provides better result for other evaluating indexes.
Furthermore, we have compared the proposed technique with four widely used techniques, SPIDER2, JPred4, FSVM, and SSpro5. As per the methodology used by the authors the SPIDER2, JPred4 use a deep learning neural network, JNet algorithm, and Deep Convolution Neural Fields (DeePCNF) to predict protein secondary structure [16, 17]. One more criteria adopted i.e. the information about sequence-based structural similarity is neglected in each case. In the field of machine learning deep learning and neural networks are useful technologies which expand human intelligence and skills by means of upgrading the available techniques. The FSVM uses a Fuzzy support vector machine technique [18, 19]. The SSpro5 method combines the use of bidirectional recursive neural networks (BRNNs) with the sequence based structural similarity. During the experiment the accuracy of SSpro5 is better than the other three methods. In Ref. [7] for the data set RS126, CB513 the secondary structure prediction for the residues has been performed by machine learning methods. In this research we have compared the proposed technique i.e. the application of Genetic Algorithm (GApred) considering the 1240 non-redundant protein sequences of 5IJN with SPIDER2, JPred4, and FSVM, with SSpro5.
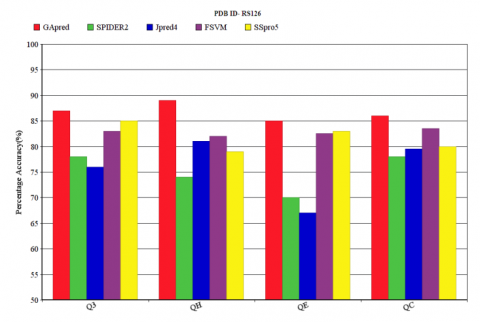
The Q3 accuracy of our technique is compared with SPIDER2, JPred4, FSVM and SSpro5 for the data set RS126. Q3 accuracy with the corresponding QH, QE, QC accuracy values obtained for RS126 dataset by applying these techniques is shown in Figure 2. The Q3 accuracy of GApred technique is 87.1%, with the corresponding QH, QE, QC accuracy of 88.9%, 85%, 86.2% respectively. In comparison to other three techniques SPIDER2, JPred4 and FSVM, GApred achieved an improvement in the Q3 accuracy of 9.1%, 11.1%, and 4.1%, respectively. In comparison to SSpro5 our technique achieves an accuracy of 2.1%, and the corresponding QH, QE, QC accuracy of 9.9%, 2.0%, and 6.2% respectively. The prediction performed upon the 1240 non redundant fragments with a k-point crossover with the modified datasets [20]. Application of Genetic Algorithm for the secondary structure prediction achieves consistently good result for QH, QE, QC values. Table 1 shows the Q3 accuracy and corresponding QH, QE, QC respectively for RS126. The MCC measurements of GApred for RS126 is also higher than that of SSpro5 and other three methods.
Table 1. Accuracy value and corresponding QH, QE, QC value for three datasets
|
Methods |
RS126 |
CB513 |
5IJN |
|||||||||
|
Q3 |
QH |
QE |
QC |
Q3 |
QH |
QE |
QC |
Q3 |
QH |
QE |
QC |
|
|
GApred |
87.1 |
88.9 |
85 |
86.2 |
85.3 |
83.3 |
85.5 |
84.8 |
85.1 |
81.6 |
85.2 |
91.5 |
|
SPIDER2 |
78 |
74 |
70 |
78 |
73.5 |
72.4 |
79.3 |
78.7 |
70.2 |
73.2 |
75.1 |
73.6 |
|
Jpred4 |
76 |
81 |
67 |
79.5 |
65.6 |
60.2 |
63.4 |
67.1 |
64.6 |
62.8 |
66.7 |
60 |
|
FSVM |
83 |
82 |
82.5 |
83.5 |
83 |
82 |
80 |
79 |
84.1 |
79 |
72.1 |
87 |
|
SSpro5 |
85 |
79 |
83 |
80 |
82 |
78.3 |
83 |
80.5 |
82.8 |
78.2 |
80.2 |
76.1 |
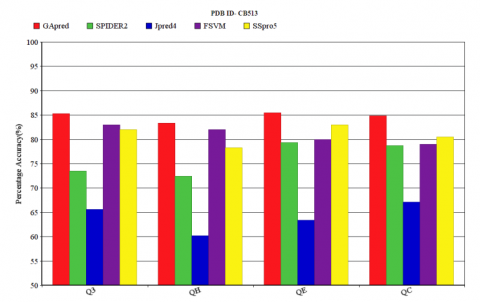
The Q3 accuracy with the corresponding QH, QE, QC accuracy obtained for the dataset CB513 is shown in Figure 3. The Q3 accuracy of GApred was 85.3%, with the corresponding QH, QE, QC accuracy of 83.9%, 85.1%, 85% respectively. If we compare with SPIDER2, JPred4 and FSVM, GApred achieves an improvement in the Q3 accuracy of 11.7%, 19.3% and 2.1%, respectively. Table 1 shows the Q3 accuracy and corresponding QH, QE, QC respectively for CB513.This technique reached a Q3 accuracy in comparison to SSpro5 of 3.2%, and the corresponding QH, QE, QC accuracy of 5.9%, 2.1% and 4.2%, respectively.
Figure 2. Q3 accuracy comparison of GApred, SPIDER2, JPred4, FSVM and SSpro5 for RS126
Figure 3. Q3 accuracy comparison of GApred, SPIDER2, JPred4, FSVM and SSpro5 for CB513
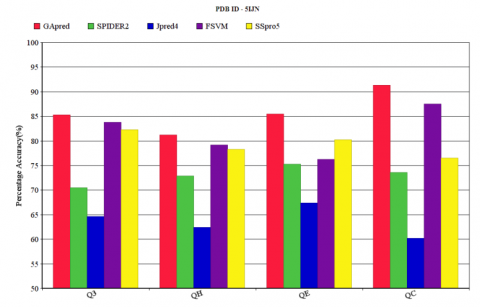
Similarly, the Q3 accuracy with the corresponding QH, QE, QC accuracy obtained for the data sets 5IJN by applying all the above five methods were shown in Figure 4. The Q3 accuracy of GApred technique is 85.2%, in comparison to the corresponding QH, QE, QC accuracy of 81.5%, 85.3%, 92.6% respectively. In comparison to SPIDER2, JPred4 and FSVM, applying Genetic Algorithm achieves an improvement in the Q3 accuracy of 14.6%, 20.2% and 1.9% respectively. Table1 shows the Q3 accuracy and corresponding QH, QE, QC value for dataset 5IJN. The QH, QE, QC value of FSVM is relatively good in comparison to other three techniques. The 3D structures are generated using x-ray crystallography and the relative changes are being observed from time to time. In this research we have observed the changes in the amino acid percentages in the data sets with a period of seven days with the effect of external agents. The changes and the changes in the 3D structure are observed which may be added to our upcoming relevant research article.
For the experimental purpose we have applied PSI-BLAST to produce the features for all samples in the test set, and then the predictions performed using the respective techniques. Separate membership functions may be defined for different predictions by the neural network. The running time for GApred technique using PSI-BLAST is less than that of SSpro5. GApred method takes 0.50s/residue which is much better than that of other techniques. The time required for the prediction of secondary structure was about 0.55s/residue, including running PSIBLAST in case of FSVM. The time required for prediction of the protein secondary structure was about 0.65s/residue using Artificial Neural Network. The detailed time taken by various technologies to predict the structure is shown in Table 2.
Table 2. Structure prediction time by different technologies
|
Dataset/Methodologies |
RS126 |
CB513 |
5IJN |
|
GApred |
33.61 |
230.11 |
174.91 |
|
FSVM |
43.213 |
285.20 |
204.18 |
|
SPIDER2 |
51.436 |
310.76 |
231.27 |
|
JPred4 |
53.322 |
352.26 |
247.42 |
|
SSpro5 |
37.72 |
265.63 |
196.328 |
Figure 4. Q3 accuracy comparison of GApred, SPIDER2, JPred4, FSVM and SSpro5 for 5IJN
In this research we have compared GApred with other four methods. The time required for the prediction for each method is recorded. The basic technology behind SPIDER2, JPred4, SSpro5 and FSVM is different from each other. The prediction time is calculated as the above techniques has been used in the same data sets but may be in different machines. Considering the prediction time in Table 2 the prediction time for protein structure is less in case of using Genetic Algorithm in comparison to other four technologies. The relevant simulation platform and atmosphere may differ in each case and may not same during experiment but performing experiment with the same data type with GApred it performs better in each step considering the processing time. After GApred Sspro5 takes less time in our research and simulation criteria. Thus this technique is also better in terms of accuracy of prediction.
The segment overlap measure (SOV) is used in general to evaluate the predicted protein secondary structures, a sequence composed of α-helix (H), β-sheet (E), and coil (C), by comparing it with a predefined or native secondary structures sequence of H, E, and C. SOV may be considered as the size of continuous overlapping segments. In comparison to Q3 instead of considering the percentage of overlapping individual positions it provides an extra allowance to longer continuous overlapping segments.
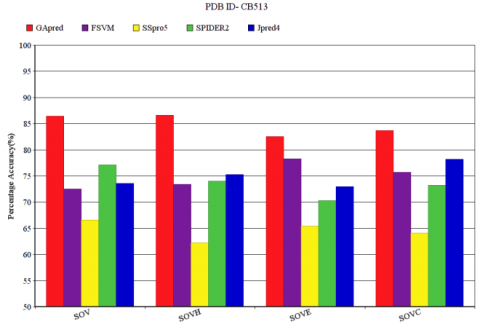
The SOV measure of FSVM, SSpro5, SPIDER2 and JPred4 for the data set CB513 is compared with GApred. SOV measure and the corresponding SOVH, SOVE, SOVC measure of α-helix (H), β-sheet (E) or coil (C) obtained for the CB513 is shown in Figure 5. The SOV measure of our technique is 86.72%, with the corresponding SOVH, SOVE, SOVC measure of 87.09%, 82.80%, 84.21% respectively. The other four methods that are FSVM, SSpro5, SPIDER2 and JPred4 have SOV measure of 73.21%, 66.35%, 77.52% and 74.12% respectively. In the overall SOV score comparison to SPIDER2 our technique achieves an improvement of 9.2%. The crossover module of Genetic Algorithm provides better prediction of secondary structure and achieves consistently good result in terms of SOV and corresponding SOVH, SOVE, SOVC values. As the changes occur to the percentage of amino acid similarly the structure also changes from time to time.
Figure 5. SOV measure of CB513 for GApred, FSVM, SSpro5, SPIDER2, Jpred4
The variation in amino acid composition directly changes the structure of the protein. In this experiment the “K-point crossover” is being performed. Basically, twenty amino acids found in each living body protein molecules. So, in the crossover all the twenty amino acid percentages take part in the crossover process. In this data sets we have selected these amino acids that has significant growth in case of the dialysis patients i.e. Tryptophan(W), valine(V), leucine(L), isoleucine(I), lysine(K), threonine(T), aspartic acid(D), serine(S), histidine(H), tyrosine(Y), alanine(A). Protein malnutrition is the most common problem among dialysis patients. In this research we have considered the amino acids to which changes occurs during kidney dialysis process. Moreover, during treatment i.e. after application of medicines the amino acid composition changes from time to time is recorded. After crossover only the eleven amino acid percentage is being considered for the protein structure prediction. Generally, a significant growth in percentage in approximately 11-12 amino acids is found during treatment in case of dialysis patients. In this research we have taken protein data set “5IJN” for this experiment which is collected from the inner ring of the human nuclear pore complex. In this research we have collected the dataset and six more iterations are performed i.e. crossover and mutation after application of medicines. The conditions for other two data sets remain unchanged with the necessary experiment setup with their respective methodology.
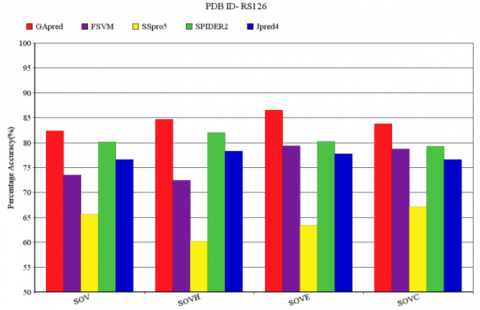
The SOV score represents the quality of structure predicted for a particular protein molecule. Figure 6 represents SOV score for FSVM, SSpro5SPIDER2 and JPred4, for the data set RS126. The SOV score of GApred is also observed in Figure 6. SOV score along with SOVH, SOVE, SOVC measure of respective α-helix (H), β-sheet (E) or coil (C) is shown in Figure 6. The SOV score of GApred is 82.91%, with the corresponding SOVH, SOVE, SOVC measure of 84.89%, 87.10%, 83.79% respectively. Similarly, the other four methods that are FSVM, SSpro5, SPIDER2 and JPred4 have SOV measure score of 73.71%, 65.55%, 80.00% and 76.82% respectively. In the respective SOVH, SOVE, SOVC scores the GApred provides consistently better result than that of other four techniques. In the subsequent SOVH, SOVE, SOVC score the SPIDER2 provides good result than that of other three techniques.
Figure 6. SOV measure of RS126 for GApred, FSVM, SSpro5, SPIDER2, Jpred4
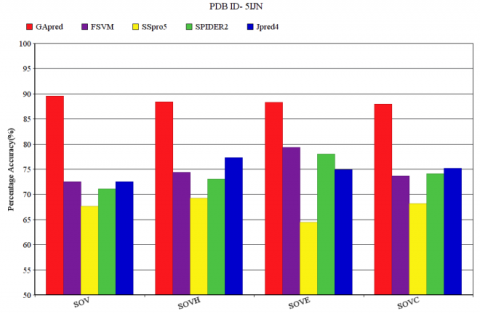
Figure 7 represents the SOV measure of dataset 5IJN for the five techniques FSVM, SSpro5, SPIDER2, JPred4, and GApred. SOV measure and the corresponding SOVH, SOVE, SOVC measure of α-helix (H), β-sheet (E) or coil (C) obtained for 5IJN is displayed in Figure 7. The SOV measure of GApred is 89.32%, and corresponding SOVH, SOVE, SOVC value of 87.22%, 87.10%, 86.92% respectively. The other four methods that are FSVM, SSpro5, SPIDER2 and JPred4 have SOV measure less than 75% that is 72.51%, 67.15%, 71.62% and 73.12% respectively. In the overall SOV score and corresponding SOVH, SOVE, SOVC score the FSVM provides good result next to GApred. In comparison to FSVM, GApred achieves an improvement of 16.81% in terms of SOV score.
Figure 7. SOV measure of 5IJN for GApred, FSVM, SSpro5, SPIDER2, Jpred4
In bioinformatics generally the SOV score is widely used for the comparison of two sequences of letters where continuous segments contain important meanings. In protein sequence the continuous amino acid alphabet sequences can be compared and the corresponding SOV measure can be calculated using different pattern matching algorithms [21]. We have used Brute force pattern matching algorithm for this research for the segment overlap measure. The SOV definitions should be applied to sequences composed of more than three states.
Protein structure prediction is one of the important and necessary tasks of bioinformatics. During medicine and drug research it is very useful. Every research may have an output but relatively optimized and decisive output is most useful for fruitful research. Many research works have been carried out for PSP problem but genetic algorithm provides relatively structured result for the secondary structure prediction by creating a metaphor of the learning of predefined samples. In this research several research articles are being compared and the result is being discussed. A brief comparison takes place between FSVM, ANN, GA for the purpose of secondary structure prediction. Considering the classification principles, the research platform also considers the membership function for each sample point based on the distance by using the separating hyperplane for the training dataset. This paper focused upon the Q3, SOV measurements upon the above three techniques. Considering the redundant fragments of the protein data set the GApred provides better result. Similarly, SPIDER2, JPred4, FSVM, and SSpro5 techniques are also applied and are compared with the proposed methodology. The proposed technique GApred provides better results in terms of the quality structure prediction and SOV measure analysis for all the three data sets that are taken for this research. The method provides most prediction accuracy for the all three data sets and the proposed methodology takes less time for the prediction of most accurate structures. This technique will be helpful for the protein structure prediction and comparison and it may be useful for various drug designers to design new drugs and medicines.
In this research three data sets like RS126, CB513, and 5IJN is considered for the experiment. Several researchers have already used RS126 and CB513 and some recent modifications for these data sets are also available. Our forthcoming research will focus upon some new as well as large data sets for the prediction of protein structure and removal of twin structure. Our future research will focus upon the extraction of new data set of protein and decoding the data sets which will strengthen the research upon bioinformatics and also for the field of biotechnology.
We are very much thankful to Indira Gandhi Institute of Technology (IGIT Sarang) especially Department of CSE&A for providing all the research requirements. We are also thankful to the faculty and staff members of this esteemed Government Institution for their endless support throughout this research work.
[1] Bordoloi, H., Sarma, K.K. (2012). Protein structure prediction using multiple artificial neural network classifier. Soft Computing Techniques in Vision Science, 395: 137-146. https://doi.org/10.1007/978-3-642-25507-6_12
[2] Rout, S.B., Kisan, S., Mishra, S. (2017). Protein secondary structure prediction of PDB 4HU7 using genetic algorithm (GA). Proc. of Int. Conference on Computer Communication and Informatics (ICCCI), pp. 1-6. https://doi.org/10.1109/ICCCI.2017.8117710
[3] Suresh, V., Parthasarathy, S. (2014). SVM-PB-Pred:SVM based protein block prediction method using sequence profiles and secondary structures. Protein Peptide. Lett., 21(8): 736-742. https://doi.org/10.2174/09298665113209990064
[4] Sanchez, R., Sali, A. (1998). Large-scale protein structure modeling of the Saccharomyces cerevisiae genome. Proceeding of National Academy Science, 95: 13597-13602. https://doi.org/10.1073/pnas.95.23.13597
[5] Heffernan, R.., Paliwal, K., Lyons, J., Dehzangi, A., Sharma, A., Wang, J.H., Sattar, J., Yang, Y.D., Zhou, Y.Q. (2015). Improving prediction of secondary structure, local backbone angles, and solvent accessible surface area of proteins by iterative deep learning. Science Reports, 5: 11476-11480. https://doi.org/10.1038/srep11476
[6] Drozdetskiy, A., Cole, C., Procter, J., Barton, G.J. (2015) Jpred4: A protein secondary structure prediction server. Nucleic Acids Residue, 43(W1): 389-394. https://doi.org/10.1093/nar/gkv332
[7] Xie, S.G., Li, Z., Hu, H.L. (2018). Protein secondary structure prediction based on the fuzzy support vector machine with the hyper plane optimization. Journal of Gene, 642: 74-83. https://doi.org/10.1016/j.gene.2017.11.005
[8] Magnan, C.N., Baldi, P. (2015). SSpro/ACCpro 5: Almost perfect prediction of protein secondary structure and relative solvent accessibility using profiles, machine learning and structural similarity. Bioinformatics, 30(18): 2592-2597. https://doi.org/10.1093/bioinformatics/btu352
[9] Matthews, B.W. (1975). Comparison of the predicted and observed secondary structure of T4 phage lysozyme. Biochimica et Biophysica Acta (BBA) - Protein Structure, 405(2): 442-451. https://doi.org/10.1016/0005-2795(75)90109-9
[10] Zemla, A., Venclovas, C., Fidelis, K., Rost, B.A. (1999). A modified definition of SOV, a segment- based measure for protein secondary structure prediction assessment. Journal of Proteins, 34(2): 220-223. https://doi.org/10.1002/(SICI)1097-0134(19990201)34:2<220::AID-PROT7>3.0.CO;2-K
[11] Cuff, J.A., Barton, G.J. (2000). Application of multiple sequence alignment profiles to improve protein secondary structure prediction. Journal of Proteins, 40(3): 502-511. https://doi.org/10.1002/1097-0134(20000815)40:3<502::AID-PROT170>3.0.CO;2-Q
[12] Shatabda, S., Newton,M.A.H., Rashid, M.A., Sattar, A.(2013). An efficient encoding for simplified protein structure prediction using genetic algorithms. IEEE Congress on Evolutionary Computation, pp. 1217-1224. https://doi.org/10.1109/CEC.2013.6557704
[13] Clementi, C., García, A.E., Onuchic, J.N. (2003). Interplay among tertiary contacts, secondary structure formation and side-chain packing in the protein folding mechanism: all-atom representation study of protein. lnt. Journal of Molecular Biology, 326(3): 933-954. https://doi.org/10.1016/s0022-2836(02)01379-7
[14] Sun, Z., Rao, X., Peng, L., Xu, D. (1997). Prediction of protein super secondary structures based on the artificial neural network method. Protein Engineering, 10(7): 763-769. https://doi.org/10.1093/protein/10.7.763
[15] Patel Dinubhai, M., Shah, H.B. (2014). Protein secondary structure prediction using neural network: A comparative study.International Journal of Enhanced Research in Science Technology & Engineering, 3(4): 459-464.
[16] Deka, A., Sarma, K.K. (2012). Artificial neural network aided protein structure prediction. International Journal of Computer Applications, 48(18). https://doi.org/10.5120/7450-0494
[17] Heffernan, R., Paliwal, K., Lyons, et al. (2015). Improving prediction of secondary structure, local backbone angles, and solvent accessible surface area of proteins by iterative deep learning. Science Report, 5: 11476. https://doi.org/10.1038/srep11476
[18] Batuwita, R., Palade, V. (2010). FSVM-CIL: Fuzzy support vector machines for class imbalance learning. IEEE Transactions on Fuzzy System, 18(3): 558-571. https://doi.org/10.1109/TFUZZ.2010.2042721
[19] Jiang, X.F., Yi, Z., Lv, J.C. (2006). Fuzzy SVM with a new fuzzy membership function. Neural Comput. Application, 15: 268-276. https://doi.org/10.1007/s00521-006-0028-z
[20] Rout, S.B., Mishra, S., Swain, D.K. (2020). Protein structure prediction of amino acid compositions using genetic algorithm. Int. J. of All Research Education and Scientific Methods, 8(12): 119-125.
[21] Sun, Z., Blundell, T. (1996). Patterns and conformations of commonly occurring super secondary structures (basic motifs) in protein data bank. Journal of Protein Chemistry, 15(7): 675-690. https://doi.org/10.1007/BF01886750