Vijayakumar Ponnusamy* | Sowmya Natarajan | Nandakumar Ramasamy | Christopher Clement | Prithiviraj Rajalingam | Makino Mitsunori
© 2021 IIETA. This article is published by IIETA and is licensed under the CC BY 4.0 license (http://creativecommons.org/licenses/by/4.0/).
OPEN ACCESS
Augmented reality system enables effective interaction with field view data and executes a particular task effectively by visual display aid. Precision agriculture involves precision measurement, data generation, analysis for interpretation of data, and decision-making to improve the yield and monitor the plant. Augmented reality will help to systematically acquire the needed data and interpret the required information from the analytical result on the field. This paper presents a low-cost development of the augmented reality system for on-field analysis of plant diseases. The article also presents a framework of deep learning-based cloud data analytic to enable on-field real-time interaction between the farmers and cloud data processing systems using a head-mounted unit. The proposed augmented reality system performance is validated for its accuracy in detecting plant diseases, real-time interaction response time, and ease of usage by the farmer community. The results show that the proposed mechanism will be able to produce real-time augment interaction to the farmer for the task of disease inspection of the plant effectively and accurately.
augmented reality, convolutional neural network, cloud computing, deep learning, head mount display, IoT, plant disease detection, smart agriculture
Augmented Reality (AR) is a futuristic technology that provides an interactive experience with the real-world environment. AR defines a simple combination of a real and virtual environment. Specifically, AR feeds the input data from the live environment to the application, which automatically presents them to the eyeglass display. The end- user automatically receives the supervised information without any other need to search for information. AR system has three basic features, first is a fusion of near-real worlds environment, second, it provides an effective and precise 3D registration of virtual as well as real objects and the third feature is live interaction [1].
Enhancement in display technology includes wearable devices and Augmented Reality. This paper proposed situational analytics-supported decision-making and merged with visual analytics augmented reality based on supermarket shopping context [2]. This module evaluated on the simulated supermarket. It supports analytical reasoning in physical space and AR detailed information supports multi-dimensional data analysis about the object decision making. This system is less prone to error and Statistical analysis was faster than the traditional manual methodology.
AR allows users to gain information on image right on the spot. It gives a 3-Dimensional view ignoring the difficulty and hardness nature. By combining image composition and image special effects, the AR system validated and produced a valid result on 3D tracking camera images [3].
Virtual reality technology applied to the agriculture field is called as virtual agriculture. It helps researchers to explore in finding various soil stress conditions, agricultural machinery design, and manufacturing [4]. It can aid the farmers in different ways, like inspect the field, identifying the species of insects, and also determining the ways to handle it.
In smart agriculture, AR wearable glass makes the farmers to view the virtual portion of the field with their naked eye and also provides flexibility to operate by their hands. It serves as a piece of distinct hardware equipment for the farmers [5]. Combining IoT with AR deploys live environment makes superimposed IoT data into physical objects and delineation of such information [6]. A supporting computer graphics system is developed to visualize direction for farming operations and overlay them on a field. For example, it records the driver’s state and viewpoints during their operations [7].
A drone imaging method with AR is proposed by Huuskonen and Oksanen [8] to automatically find the position of soil sampling based on details from the soil map. Samples are taken from the field soil via worn AR smart glass and analyzed the nutrient contents such as pH, Mg (Magnesium), field soil type, Ca (calcium), K(Potassium), phosphorous, and S(Sulphur). Augmented reality wearable was used to guide the farmer based on the generated soil sample points.
Agricultural land will not always be perfect and smooth for the tractor driver's naked eye perception while tractor navigation is carried out. This developed tractor navigation AR model gives superimposed images of virtual graphics (3D) three-dimensional images, and area captured by AR camera [9]. This system is able to do effective and uniform plowing on the soil. This system model will supervise the driver on the tractor to wrap the field areas completely in a uniform manner, by the way, which prepares the soil for more productive cultivation. Regular interval observation is made to measure the positioning accuracy of the navigation system by way of altering the pitch, roll and yaw angle of the tractor. The 3D model is generated by utilizing the tractor position and direction, which can be identified by inertial measurement segment and on-time GPS kinematic unit. Finally, this AR-based navigation system could work for less than 3 cm positioning error and also within 3 m distance from the tractor front end. Another guidance system suggested in which the tractor operator provided with eye monitor glass can able to visualize the live plot and differentiate between the treated and the untreated zones in a different color [10]. AR technology was used to adjust the magnitude of the steering wheel and to control the steering of the tractor wheel rotation to move on the correct trajectory concerning the treated area maps.
Another multi-objective path planner system was suggested, in which the problem of spraying pesticides in greenhouses was addressed as a vehicle routing issue [11]. The probabilistic roadmap path planner was designed to solve the vehicle routing problem, and the routes are generated between the plants for spraying pesticides based on the virtual environment.
An AR-vino system was developed on the AR platform for visualizing 3D data in outdoors, using a mobile tripod-based computer [12]. The combination of GIS (Geographic Information System) and augmented reality provided a new way to visualize viticulture (grape yard/vineyard) and to monitor the yield and quality of grapes. The AR system solves the long-flat view problem to view field or agricultural data over the uniform ground.
One more work with AR aid for large-scale crop distribution is given for the crops planting in uneven areas [13]. It solves the planting problem by adapting the design of visually altering zonal edges to identify the area of sow crops in the virtual surroundings. It is also suggesting a fast building method of the virtual scene which is based on the Even-Odd algorithm and Catmull-Rom spline.
This paper proposes a fixed-point triggering method [14] to address the issue of synchronizing voice and video, which is difficult in the 3D site. The batch loading model on VR says that comparing with the manual batch loading method; the VR method achieved good accuracy. The video, audio, and roaming points are precisely synchronized and also effectively promote multimedia resources. This proposed model provides an interactive experience for the VR module through the HTC vibe.
Augmented Reality on location [15] demonstrated for in site visualization as well as fieldwork navigation. This model enables the farmers to track their crop growth. It also visualizes the sensor data with the point of interest. This system enables the non-expert user’s to make use of this demonstrated module.
Pest identification and insect management system developed [16] with AR for aiding the farmers to control the pests. The designed prototype able to detect the bugs and suggest treatments and pesticide usages to control the growth of pests and to kill the harmful bugs in flora and fauna.
AR image recognition algorithm [17] promotes to identify and quantify weeds by species and also control the weed growth. By integrating AR with weed economic thresholds software, the AR provides results on year-wise crop production, yield loss due to weed, herbicide need for the next season can be known.
Since AR set hardware having limitations on computational proficiency, and on-field image data processing are not processed within the AR set. So, in this paper, we suggest real-time data analysis on the cloud computing platforms. In this article, the design of an AR system models using machine learning and cloud computing are furnished for the application of on-field plant analysis. This study aids in exploring the elaborate architecture of Augmented Reality in smart farming, which helps in determining the diseases on plants.
Major contributions of the article are as follows:
The remaining part of the article is organized as follows; Section 2 provides the system model and cloud data processing; section 3 presents the result and discussion with the data collection mechanism. Finally, section 4 concludes the article with a summary of work and future direction.
The cloud-based augmented reality system has the following components AR head-mounted display unit, cloud data processing module.
2.1 Head-mounted display
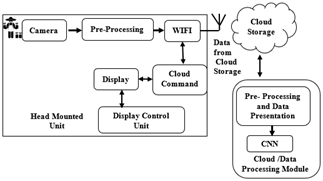
Figure 1 represents cloud-based machine learning supported augmented reality system for detection of plant diseases. In this system, the farmer has to wear the AR HMD (Augmented Reality Head Mounted Display) and observe the plantation on the field via glass. It visualizes a virtual view of the particular information about the plants which are obtained from the cloud server. The HMD camera captures images of the plants and transmit the observed data to the cloud server for analytic.
The ARHMD holds the android software, which is responsible for pre-processing. The captured image like extraction of a specific pattern appears in the image i.e., ROI (Region of Interest). The android software only applies the pre-processing method of Region of Interest (ROI) detection and segmentation. The Green color pixel value-based thresholding mechanism is employed at the pixel level in order to extract the ROI and segment that portion, which is used because our interested portion of leaves are green in color. The threshold values are fixed based on the histogram of green color. Once the pre-processing completed, the data is forwarded to the cloud server via wireless transceiver. Cloud server process the captured field image on real time, generate annotated information and transmit to ARHMD. The cloud is running on the deep learning algorithm of Convolutional Neural Network (CNN) architecture in order to classify the images. More explanation of CNN architecture design is provided in the result and discussion section (section 3) under Figure 5. Once the annotated data is obtained from cloud server, the information will display on the HMD set via glass display.
The processing software module which is running in the cloud utilizes convolution neural networks for analyses of plant diseases. From the output of convolution neural networks, the software model process and generate the annotation, then overlay the data on the HMD set display. Cloud built AR model makes the farmer to identify the plant disease at each and every specific plant extent more accurately, rapidly, efficiently when compared to usual naked-eye inspection.
Figure 1. Block diagram of augmented reality cloud processing system
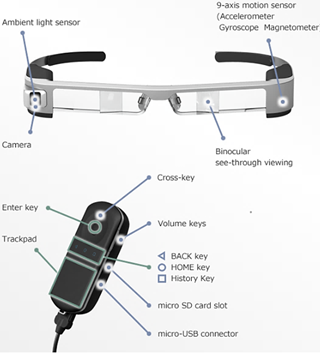
Figure 2. Block diagram of augmented reality cloud processing system [18]
MOVERIO BT-350 AR set is utilized in this research as a VR set. It is one of the efficient performing Augmented Reality head-mounted sets. Its system specifications are listed below:
•Lifetime is approximately 6Hrs (2950mAh).
•Operating voltage - 5V DC.
•Sensors mounted-PS/accelerometer/illumination& gyroscopic sensor/ geomagnetic sensor.
•Dimension of Panel - 0.43” wide panel.
•Memory -2GB internal (16GB/ 32 GB)
•Camera resolution – 5 Million Pixels.
•Screen magnitude – 40” virtual viewing distance 2.5m.
From the above feature set of MOVERIO BT-350, we can conclude that it will be the right choice for the augmented system development. The 2GB internal memory makes it convenient to use for the image processing application.
The virtual view is from 2.5 meters is enough for the viewing of the plant in the field by the farmer. Overall, the MOVERIO BT-350 is a perfect choice for the augmented system design.
Figure 2 shows the picture of MOVERIO BT-350 with a small operating touchpad device. The touchpad device makes the navigation of augmented images. The memory card option is enabled for storing the information and a USB-compatible charger.
The AR HMD set farmer use cases [19] are:
Machine learning and deep learning methods are applied to solve many problems [20], especially in precision agriculture and plant disease detection with VR [21, 22]. In this article, VR handset is used to ensure the farmer hands-free and to make them farming activity conveniently without intervention. The VR handset is emphasized for this application to display the result for diseases while the farmer is looking at the plant. Our system will capture the image wherever the farmer looks on the plant, process them on the cloud server and display the result of detected diseases by overlapping images. This will ensure immediate detection of disease and display them in the annotated image for the farmer.
2.2 Cloud data processing module
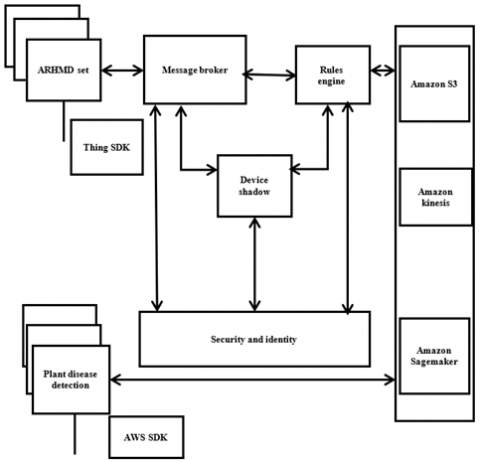
Amazon web service (AWS) cloud platform is used for cloud data processing and storage. Figure 3 visualizes the cloud architecture of AWS. In AWS cloud service, AWS- IoT is used for data collection and processing. These services are able to provide two-way communications between connected Internet devices (sensors, embedded micro-controllers, and actuators) with AWS Cloud in a highly secure way. The user present in the AWS service will be able to collect measurement data from several appliances for analysis and can store those data. This service allows the end-user to control multiple devices from their smart tools like (smartphones, tablets) to create new applications. In this work, the Wi-Fi-enabled MOVERIO BT-350 is registered as an IoT device in AWS -IoT platform and the image data is collected and stored in S3 storage.
The components present in the AWS IoT are listed below.
2.2.1 Device gateway
It serves as a beginning point for IoT- devices. It allows the data transfer to the active device in a structured and reliable mode with AWS IoT. In this work, the MOVERIO BT-350 is connected to the cloud through this device gateway.
2.2.2 Message broker
Allowing assured mechanism and able to get publish and receive messages between connected to AWS IoT device applications. Depends on the applications, the message broker can use the one and other MQTT over Web Socket or its protocol directly to publish and subscribe or HTTP also be used.
Figure 3. AWS cloud architecture for plant disease detection using ARHMD set
REST interface can also be used to publish. The subscribe and publish software architecture is used to get the data and put the data from the cloud. Here, MOVERIO BT-350 will publish the data to the cloud and subscribe to the data to get the analytic result.
2.2.3 Rules engine
This rules engine service provides integration and processing on messages with more SQL-based language, AWS services are used to choose data from message payloads, then process the information and forward the data to various other services, such as Amazon Dynamo DB, AWS Lambda and Amazon S3.
Here, rules are set to store the data in Amazon S3 whenever a packet is received from MOVERIO BT 350, and the analytic result from S3 is pushed to MOVERIO BT-350 whenever it subscribes.
2.2.4 Security and identity service
Security credentials use AWS to authorize and authenticate user requests. Application devices should hold their credentials to transmit information to the message broker securely. Rules engine and message broker employs security features to transmit data securely to the connected devices. Here, the private key generating for MOVERIO BT-350 is used for this purpose.
2.2.5 Registry
This entity classifies the resources correlated with all devices in the AWS Cloud. First, it registers connected devices of MOVERIO BT-350 and associates up to 3 custom attributes with each individual one. It is also possible to associate certificates and MQTT client IDs with each device to improve the ability to manage and troubleshoot.
2.2.6 Group registry
Groups enable the user to manage many devices at once by classifying them into groups. The devices are built in a hierarchical order. Any action performed on one parent group will put into its child groups. This feature not used under the proposed work.
2.2.7 Device shadow
The device shadow preserves the latest updated reported state or future state of a device even though the device is offline. The user can retrieve the state information through API / by using a rules engine.
2.2.8 Device shadow service
This service provides determined representations of the connected appliance in the AWS Cloud. The connected devices can publish and synchronize its updated state information to a device's shadow when it connects. The synchronized appliances can publish its present state to a shadow for use by applications or other devices.
2.2.9 Device provisioning service
This service employs a template which makes the user to provision devices that describes the resources needed for the user device, which may be a certificate, a thing, and added policies. A thing is an arrival in the registry that contains attributes that describe a device.
2.2.10 Jobs service
This service will approve users to determine a set of remote operations that are forwarded to further execution on the AWS IoT attached devices. This feature used to control and display the MOVERIO BT-350 in real-time.
In this paper, input image data are captured from the SRM urban farm center of SRM IST, Faculty of agriculture Science. The Farm view is shown in Figure 4. Tomato leaf samples of the raw data are collected on the field from 340 different healthy plants and for each plant at five different places. Samples collectively give spatial variability. Totally 2000 samples of healthy leaves are collected. Similarly, 2000 Samples of sick leaves also obtained. During data acquisition, plant pathology expert from SRM agriculture science is involved in guiding to collect the proper unhealthy plant image samples.
Figure 4. Data collection Centre-SRM urban farm centre
Table 1. Number of samples taken for experimentation
|
Types of samples |
No of samples taken |
||
|
Dark light |
Dim Light |
Medium Light |
|
|
Healthy |
400 |
400 |
400 |
|
Bacterial |
400 |
400 |
400 |
|
Lesion Spot |
400 |
400 |
400 |
|
Viral |
400 |
400 |
400 |
|
Lesion |
400 |
400 |
400 |
|
Total |
2000 |
2000 |
2000 |
The unhealthy leaves with different varieties of diseases, namely bacterial, viral infections, lesion spots, blight, are covered during data acquisition.
The varieties of healthy and unhealthy leaf images are equally distributed from the total sample that we have taken. Table 1 shows the total no of collected healthy, viral infected, bacterial, blight and lesion spot leaves.
First, the samples are pre-processed in the AR HMD unit, then analyzed in the cloud module using the Convolution Neural Network (CNN). Preprocessing method of ROI detection and segmentation is applied. Before processing the entire image of the leaves is taken. During preprocessing, the green portion of the histogram is extracted by employing ROI detection and segmentation mechanism and the irrelevant background noise is eliminated.
This will result in the reduction of data size, which will improve the transmission speed of the data to the cloud. On the other hand, it will also improve the accuracy of disease detection since the background area is removed. The collected samples are divided into 70% for training, 15% for validation, and 15% for testing purposes.
The convolution neural network architecture employed in the proposed work is shown in Figure 5: 1. The input layer size 256* 256*3. The image size is 256*256 and 3 represents the RGB color space; 2. Convolution layers size of 20 with 5*5 kernel. The 5*5 is a feature identifier applied to select the features by removing the backgrounds; 3. ReLU layer of activation; 4. Pooling layer this layer is probably utilized for resizing image; 5. The fully connected layer, this layer peer for the high-level features; 6. Flatten layer for convert 2D data into 1D 6; 7. Softmax layer (Compute the probability of classes) and Classification.
Figure 5. General CNN architecture
The convolutional neural network architecture is given in Table 2. with its relevant parameters.
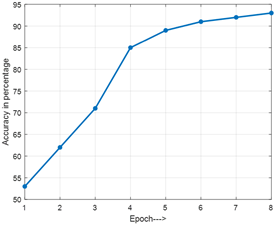
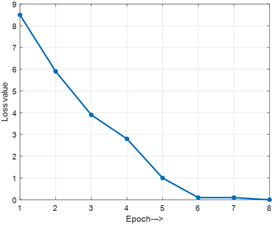
The different data set consist of about 500 samples, 1000 samples, and 2000 samples are executed for analysis of the performance of the system with 56 iterations with eight epochs. Figure 6 shows the accuracy of classification with respect to the number of iterations for 2000 samples on training. From Figure 7, it is evident that the maximum accuracy of about 93% is obtained in classification. Inferred from Figure 6, the loss values are minimized during the training and attained a minimum amount of 0.001 at the last iteration.
Table 2. CNN architecture design
|
Type of Layer |
parameter |
Output shape |
|
In put layer |
In put Size 256x256x3 |
256x256x3 |
|
Convolution layers 1 |
No of filters=20; Size of Kernel=5x5 zero-padding =2, stride size=1, activation='linear' |
256x256 |
|
ReLU |
parameter of alpha=0.1 |
|
|
Pooling-max |
polling with Size of Kernel =2x2 and size=2 |
128x128 |
|
Convolution layers 2 |
No of filters=20; Size of Kernel=5x5 zero-padding =2, stride size=1, activation='linear' |
128x128 |
|
ReLU |
parameter of alpha=0.1 |
|
|
Pooling-max polling |
polling with Size of Kernel =2x2 and size=2 |
64x64 |
|
Flatten layer |
|
|
|
fully connected layer |
size of 64 neurons with activation='linear.' |
4096 |
|
ReLU |
parameter of alpha=0.1 |
4096 |
|
fully connected layer |
with neurons 5 with activation=' softmax ' |
5 |
Table 3. Performance of CNN
|
No of samples tested |
Testing Accuracy |
Latency |
|
500 samples |
65.52% |
Training time-21 sec; Testing – 10ms |
|
1000 samples |
76% |
Training time -2 min 19 sec Testing – 10ms |
|
2000 samples |
93% |
Training time -10 min 12 sec Testing – 10ms |
Figure 6. Testing accuracy
Figure 7. Loss / error value on training
Table 3 shows the accuracy and time complexity of the proposed system for three different data sizes. The hardware involved in this system is Arm-based Amazon EC2 M6g gravitation 2 processor. We run the program in the AWS cloud server. The computational complexity result is valid for the Platform of Intel i5 8th gen- 8250U 8GB RAM, CPU at 1.8 GHz in Windows 10 OS. From the table, it is evident that the proposed method is suitable for the practical deployment for the on-field disease analysis. The maximum computational training time is 10 minutes12 seconds for 2000 samples and testing time is 10ms. This computational time shows that the system can support and meet the real-time response demand of the AR system.
The following comparison charts shows the accuracy of literature work surveyed.
Table 4. Comparison of literature works
|
Literature Work |
Samples taken |
Methods Employed |
Results achieved |
|
Agarwal et al. (2020) [23] |
50,000 images (Tomato) |
CNN |
Accuracy-91.2% |
|
Sardogan et al. (2018) [24] |
50,000 Images(Tomato) |
CNN & LVQ |
Accuracy-86% |
|
Proposed work |
2000 images (Tomato) |
CNN |
Accuracy -93% |
The comparison of the proposed work with literature literary works are presented in Table 4. The images for those literature works are obtained only from the internet sources for tomato leaf disease detection and employed a Convolutional Network algorithm to achieve better accuracy.
Our proposed work involved our own dataset, which is executed on cloud-enabled Virtual Reality headset. The developed system is portable, ensures the real-time analysis for the identification of diseases on the tomato plant leaves.
This paper presents an on-field augmentation of the farmer with IoT-enabled devices for plant disease detection. This cloud-based AR system will enable precious disease detection of the plant, just glancing the plant through the AR HMD system. Typically, general plant diseases are inspected by the farmer's naked eye. The accuracy of naked eye identification relies on the knowledge and experience of the farmer. The above issue is eliminated in the proposed system by a deep learning algorithm, which will be detecting the diseases more precious. The response time is another crucial factor for real-time detection of diseases, which is also evaluated and manifested that the proposed system can be deployed in real-time practice with a latency of 10ms. This work is only dealing with a single plant disease; in the future, multiple plant diseases will be trained in CNN to enable the system to work on broader and other practical usages.
[1] Wu, H.K., Lee, S.W.Y., Chang, H.Y., Liang, J.C. (2013). Current status, opportunities and challenges of augmented reality in education. Computers & education, 62: 41-49. https://doi.org/10.1016/j.compedu.2012.10.024
[2] ElSayed, N.A., Thomas, B.H., Marriott, K., Piantadosi, J., Smith, R.T. (2016). Situated analytics: Demonstrating immersive analytical tools with augmented reality. Journal of Visual Languages & Computing, 36: 13-23. https://doi.org/10.1016/j.jvlc.2016.07.006
[3] Zhao, Q., Sun, Y., Sun, Z. (2015). An augmented reality method with image composition and image special effects. In 2015 8th International Congress on Image and Signal Processing (CISP), pp. 866-870. https://doi.org/10.1109/CISP.2015.7407999
[4] Sharma, P., Hans, P., Gupta, S.C. (2020). Classification of plant leaf diseases using machine learning and image preprocessing techniques. In 2020 10th International Conference on Cloud Computing, Data Science & Engineering (Confluence), pp. 480-484. https://doi.org/10.1109/Confluence47617.2020.9057889
[5] Yu, F., Zhang, J.F., Zhao, Y., Zhao, J.C., Tan, C., Luan, R.P. (2010). The research and application of Virtual Reality (VR) technology in agriculture science. In: Li D., Zhao C. (eds) Computer and Computing Technologies in Agriculture III. CCTA 2009. IFIP Advances in Information and Communication Technology, vol 317. Springer, Berlin, Heidelberg. https://doi.org/10.1007/978-3-642-12220-0_79
[6] Phupattanasilp, P., Tong, S.R. (2019). Augmented reality in the integrative Internet of Things (AR-IoT): Application for precision farming. Sustainability, 11(9): 2658. https://doi.org/10.3390/su11092658
[7] Okayama, T., Miyawaki, K. (2013). The “Smart Garden” system using augmented reality. IFAC Proceedings Volumes, 46(4): 307-310. https://doi.org/10.3182/20130327-3-JP-3017.00070
[8] Huuskonen, J., Oksanen, T. (2018). Soil sampling with drones and augmented reality in precision agriculture. Computers and Electronics in Agriculture, 154: 25-35. https://doi.org/10.1016/j.compag.2018.08.039
[9] Kaizu, Y., Choi, J. (2012). Development of a tractor navigation system using augmented reality. Engineering in Agriculture, Environment and Food, 5(3): 96-101. https://doi.org/10.1016/S1881-8366(12)80021-8
[10] Santana-Fernández, J., Gómez-Gil, J., del-Pozo-San-Cirilo, L. (2010). Design and implementation of a GPS guidance system for agricultural tractors using augmented reality technology. Sensors, 10(11): 10435-10447. https://doi.org/10.3390/s101110435
[11] Mahmud, M.S.A., Abidin, M.S.Z., Mohamed, Z., Abd Rahman, M.K.I., Iida, M. (2019). Multi-objective path planner for an agricultural mobile robot in a virtual greenhouse environment. Computers and Electronics in Agriculture, 157: 488-499. https://doi.org/10.1016/j.compag.2019.01.016
[12] King, G.R., Piekarski, W., Thomas, B.H. (2005). ARVino-outdoor augmented reality visualisation of viticulture GIS data. In Fourth IEEE and ACM International Symposium on Mixed and Augmented Reality (ISMAR'05), pp. 52-55. https://doi.org/10.1109/ISMAR.2005.14
[13] Cheng, C., Li, J., Zhou, J., Kang, L., Sun, R., Li, G. (2018). Rapid construction of virtual scenes for large-scale crops distribution. IFAC-PapersOnLine, 51(17): 591-595. https://doi.org/10.1016/j.ifacol.2018.08.133
[14] Cheng, C., Kang, L., Cai, S., Li, J., Sun, R. (2018). Virtual display and interactive experience platform of farming culture based on Unity3D. IFAC-PapersOnLine, 51(17): 637-642. https://doi.org/10.1016/j.ifacol.2018.08.125
[15] Zheng, M., Campbell, A.G. (2019). Location-based augmented reality in-situ visualization applied for agricultural fieldwork navigation. In 2019 IEEE International Symposium on Mixed and Augmented Reality Adjunct (ISMAR-Adjunct), pp. 93-97. https://doi.org/10.1109/ISMAR-Adjunct.2019.00039
[16] Nigam, A., Kabra, P., Doke, P. (2011). Augmented reality in agriculture. In 2011 IEEE 7th International Conference on Wireless and Mobile Computing, Networking and Communications (WiMob), pp. 445-448. https://doi.org/10.1109/WiMOB.2011.6085361
[17] Vidal, N.R., Vidal, R.A. (2010). Augmented reality systems for weed economic thresholds applications. Planta Daninha, 28(2): 449-454. https://doi.org/10.1590/S0100-83582010000200025
[18] https://epson.com/Support/Wearables/Moverio/Epson-Moverio-BT-350/s/SPT_V11H837020, accessed on 15th August 2019.
[19] https://telanganatoday.com/augmented-reality-for-smart-farming, accessed on 7th Nov. 2017.
[20] Ponnusamy, V., Malarvihi, S. (2017). Hardware impairment detection and prewhitening on MIMO precoder for spectrum sharing. Wireless Personal Communications, 96(1): 1557-1576. https://doi.org/10.1007/s11277-017-4256-6
[21] Ponnusamy, V., Coumaran, A., Shunmugam, A.S., Rajaram, K., Senthilvelavan, S. (2020). Smart glass: real-time leaf disease detection using YOLO transfer learning. 2020 International Conference on Communication and Signal Processing (ICCSP), pp. 1150-1154. https://doi.org/10.1109/ICCSP48568.2020.9182146
[22] Ponnusamy, V., Natarajan, S. (2021). Precision agriculture using advanced technology of IoT, unmanned aerial vehicle, augmented reality, and machine learning. In: Gupta D., Hugo C. de Albuquerque V., Khanna A., Mehta P.L. (eds) Smart Sensors for Industrial Internet of Things. Internet of Things (Technology, Communications and Computing). Springer, Cham. https://doi.org/10.1007/978-3-030-52624-5_14
[23] Agarwal, M., Singh, A., Arjaria, S., Sinha, A., Gupta, S. (2020). ToLeD: Tomato leaf disease detection using convolution neural network. Procedia Computer Science, 167: 293-301. https://doi.org/10.1016/j.procs.2020.03.225
[24] Sardogan, M., Tuncer, A., Ozen, Y. (2018). Plant leaf disease detection and classification based on CNN with LVQ algorithm. In 2018 3rd International Conference on Computer Science and Engineering (UBMK), pp. 382-385. https://doi.org/10.1109/UBMK.2018.8566635