Nalabala Deepika* | Mundukur Nirupama Bhat
© 2020 IIETA. This article is published by IIETA and is licensed under the CC BY 4.0 license (http://creativecommons.org/licenses/by/4.0/).
OPEN ACCESS
The consumer services market greatly depends on the consumers feedbacks. The best provided services will be increasing the rating of those services subsequently annotated with their good feedback. To give feedback one platform is social media like twitter is very suitable one. To attain consumers interest on their services, consumer markets utilizes advertisements via search engine marketing and social media platforms. The advertisements are very attractive and mind catching, people will be informed, motivated, influenced. All advertisers give advertises in form of text, picture, and video, audio and by mixing them with the aid of professional ad-makers. The search engine is a search program for finding particular sites on World Wide Web, which discovers the stuff related to keywords or characters specified by the user. In an increasingly competitive marketplace to expand and grow the business the Search engine marketing (SEM) is the effective approach. The advertisers also select video sharing platforms like YouTube-a video sharing channel, and also the search engine marketing platform to launch their advertisements to be available for consumers publicly. The public can view and share their opinion via likes/dislikes count and also comments for every video. This paper focus on attaining stock predictions from different sources and also discuss about gathering text analysis for the required stock from digital media like search engines, video channels, news feeds. The aim of this study is to consider the stock price prediction from major E-commerce consumer services companies namely Just Dial and Info edge that are publicly traded in NSE/BSE by considering web advertising and their influence on consumer services markets like Just Dial and Info edge, by adopting ensemble machine learning algorithms like Random forest, Gradient boost, XG-boost and it is observed that XG Boost outperforms the other algorithms as it exhibits least RMSE,MAE and MAPE providing the accuracy of 71.78%.
consumer service, web advertisement, social media, E-commerce, stock price, YouTube, comment, sentiment analysis
Utilization of the Internet has disposed the boundaries of agents and geographical location since now financial investors can purchase and sell their shares by getting to the securities exchange from anyplace whenever [1]. Prior to putting away investment, it is significant for speculators to foresee the stock market. In general, the traditional approach follows the prediction of stock market basing on closing price of the previous days data (historical data), which may lead to either tremendous gain or drastic loss for the investor in some cases happened due to lack of prediction accuracy. Therefore, automated predictor systems are required for helping investors to make a perfect investment leading to the development of effective algorithms and methods to predict by adopting strategies like machine learning, sentiment analysis and bigdata analytics using internet medium.
In the present computerized world Internet based advances, for example, Cloud Computing, Big Data analytics, and Sentiment analysis have changed the manner in which we work together. Online advertising is a type of advertising for online/offline marketing, which conveys promotional messages to consumers with the aid of internet services. In this activity the key role actors involved are publisher-who integrates advertisements into its online content, an advertiser - who provides the advertisements to be displayed on the publisher's content, ad servers, advertising agencies and affiliates. There are various forms of online advertising such as display advertising, email marketing, social media marketing, search engine marketing, and mobile advertising. YouTube is a video sharing channel service created in Feb., 2005 by the American people which allows people to upload, view, rate, share, add to playlists, report, comment on videos, and subscribe to other users. Now, it is operating as one of the Google supplementary. On each video there is the option for the viewer to either like or dislike the video and the ability to leave a comment. The likes and dislikes are displayed as a ratio underneath the video, and below that a list of comments. There is also the ability to like or dislike a specific comment, or answer it with a comment of your own. This starts a thread of comments following the main comment. These comments on comments are not displayed until the user clicks on the main comment. No comment can go below 0 likes, a dislike will only affect a comment likes if they already have one or more likes. Disliking a comment with one or more likes subtracts a like from that comment. Various E-commerce companies are evolved to provide consumer services. To attain customer’s attraction for their services they need to deliver promotional messages of their services in online. Then need to track the people opinions in terms of views, likes, dislikes, comments for their each and every promotion. Doing the marketing based on people feedbacks definitely results in good returns.
The largest e-commerce companies in India were Flipkart , Amazon, Myntra, Paytm, and Snapdeal etc. Some of the major e commerce companies traded under BSE/NSE are Justdail, Info edge, Jupiter Info media and Infibeam. Make my trip company listed under NASDAQ. In current days the most wanted market namely niche business gets popularity, with the aid of e-commerce spreading. Niche market is a kind of small market segment in which a specific product is focused. The word niche defines product-specific market needs such as price range, demographics and production quality. As these small segments gets popularity, they are slowly getting acquired by the big players. The e-commerce companies also entered into the stock market. Justdail with the ticker names JUSTDAIL under NSE and BOM: 535648 under BSE entered into stock market listed in the year 2013.Infoedge an internet classifieds company with the ticker names 532777 under BSE and NAUKRI under NSE listed in the year 2006. In India for various services over the phone and online, the local search option is provided by the company named with Just Dial or JD founded in 1996 by VSS Mani. This has offices in Ahmadabad, Bangalore, Chennai, Coimbatore, New Delhi, Hyderabad, Jaipur, Kolkata, and Pune. This company is headquartered in Mumbai, India. The leading online classifieds company in India named with Info Edge (May 1, 1995) is an integrated unit by integrating shiksha.com, jeevansathi.com, Naukri.com, 99acres.com, Zomato Media Private Limited for providing the services in education, matrimony, recruitment, real estate and other related fields respectively. As these two companies are having popular rating, in security exchange also a very good reward is provided to their corresponding investors. For the major e commerce companies namely Justdail, Info edge traded under BSE/NSE the people opinions are collected from the social media called twitter. For the collected tweets the sentiment analysis was carried out to obtain the sentiment value. This research work has been carried out for improving the predicting accuracy, by considering the people opinions shared on YouTube video sharing channel through likes, dislikes and views and comments from YouTube, tweets from twitter. The ensemble methodologies employed to get the predictions.
Bilinski [2] made an analysis of the corporate companies and social media relation via the feeds posted on Twitter, YouTube and Instagram. They gathered FTSE100 firm’s full- and half-year earnings announcements data on twitter and stock information. The authors focused mainly on stock values in the period, 10 days before and after the earnings announcements were made on twitter. They adopted descriptive statistics and regression techniques to their study. They concluded that the Investors react more positively if firms perform transparent communicate on the three social platforms. They found that, after the earnings announcements, the retail investors increase their shares in the corresponding firms and analysts update the stock recommendation.
Kramer [3] presented a study, which explores the correlation between social media and organization’s Enterprise Application Software, is an integration of Customer Relationship Management and Enterprise Resource Planning systems. Their study considered business professionals views in YouTube to analyze the impact on organization.
Bhardwaj and Ansari [4] demonstrated the process of attaining maximum profits and Outline and visualization of the predictions in stock-markets through supervised algorithms namely random forest, K-Nearest neighbor, logistic regression and ARIMA. The stocks considered for analysis are Apple Inc (APPL), TATA Consultancy service Ltd, Johnsons & Johnsons (J&J), Verizon (VZ), Infosys Ltd. Their results analyzed by comparative study and stated that the logistic regression model predicts with the better accuracy.
Basak et al. [5] given the stock market trend prediction comparative analysis of tree based techniques. As the initial step the randomly selected 10 companies’ data was gathered, and then exponential smoothing can be applied as the preprocessing step. By using the stock data technical indicators namely Money Flow Index, EMA, Stochastic Oscillator, and MACD Relative Strength Index (RSI), Stochastic Oscillator were calculated used as extra features. For their study, the data collected in a particular period from January 2013 to July 2014. The ensemble methods namely random forest and XGBoost applied and analyzed in increased window size slots. The results shown that for more window size it shows more accuracy.
Martin nd Teodor et al. [6], tried to address the research question: “Can the comments on a YouTube video be used to determine what ratio of the viewers liked or disliked the video using sentiment analysis?”– with the aid of existed machine learning algorithms namely Logistic Regression, Naïve Bayes, SVM. The authors used the Pearson correlation to find the correlation among the sentiment of comments, likes, and views of a YouTube video. Their study was conducted, only by considering the few popular channels-CNN, FoxNews, TEDTalks, Vice and Vox, which creates videos consistently on the controversial topics. From their work, they found that there is a weak correlation between percentage of positive comments and percentage of number of likes of a particular video. Based on the results and fluctuations in the data, the authors stated that it is not accurate enough to apply these methods to any of the field on the internet; just it can be considered as an indication.
Rahim et al. [7], made an attempt to mine the movie trailers data on YouTube to predict the gross income. They have generated a dataset of 7988 movie trailers from YouTube with the different attributes like opening income, number of views, likes, dislikes, and comments. For this they collected Movie Related Information (release year of the movie, title, the category of the movie, Name of the film studio, opening weekend income of the movie, gross Income, Release date of the movie, release Month, age Of The Movie(month): Total number of month of the movie from its release date) and Movie Trailer Related Information (upload Date, ageOfTheTrailer(month), total Views, noOfLikes, noOfDislikes, like: dislike-noOfLikes / noOfDislike, totalComments).
They depicted a comparative analysis with the four regression techniques namely Linear Regression Polynomial Regression Gradient Boosted Tree, Simple Regression Tree. They found that the linear regression is the most suitable method for movies gross income prediction.
Golmohammadi et al. [8], demonstrated how the Twitter data was utilized for improving the anomaly detection in the stock market. The authors gathered oil and gas sector data from s&p 500 and twitter data of respective stocks. They adopted three classifiers namely Naïve Bayes, Maximum Entropy and Support Vector Machines for tweets classification based on sentiment. They used 5-fold cross validation for classifiers evaluation. The evaluation conducted for 5 times and averaged for final performance result. They stated that their developed model improves the CAD-Contextual Anomaly Detection by removing irrelevant anomalies.
Sharief et al. [9], proposed the stock price forecasting approach with the aid of technical indicators namely Moving Average (MA), Moving Average Convergence Divergence (MACD), Relative Strength Index (RSI) and Accumulation/distribution line (ADL).The study of stock performance conducted by considering the FMCG companies namely Godrej, ITC, PGHH, Marico, and HUL. They adopted technical analysis for their study. The authors concluded that the short term investments are not suggestible for the investors.
Bhuiyan et al. [10], proposed a method for finding relevant, popular and high quality video on YouTube. The datasets are prepared by applying the NLP-Natural Language Processing on comments of the video and sentiment values are calculated with senti strength. The authors revealed that the YouTube video analysis in terms of finding relevant, popular and high quality videos is accurate by considering comments instead of likes and views.
Amar [11], performed the sentiment analysis of the YouTube comments related to popular topics using machine learning methods. The authors demonstrated the importance of a sentiment analysis in trend, seasonality identification and forecasting for giving clear information and influence of human sentiments on real world events. The comments were extracted with keywords like \Federer", \Nadal", \Obama. They adopted the standard sentiment classification approach namely naïvebayes, to identify the sentiments associated with each word in a comment. As the training set IMDb database was used. The authors forecasted sentiment scores for 26 weeks with the aid of WEKA data mining tool forecasting module along with SMO regression, a support vector machine approach. They stated that their study and prediction results were promising. They concluded that their study will definitely helpful in better forecasting.
Deng et al. [12], proposed a stock prediction model by including technical indicators and sentiment analysis. They used Multiple Kernel Learning (MKL) method for prediction. Senti WordNet adopted for text classification. The authors also included the indicators namely ROC and MACD to catch the trends, and BIAS used for identify overbought/oversold signals. The U S stock data for the three Japan stocks namely Sony, Panasonic and Sharp were considered and from Engadget, special community the news was collected for their experimental study. To show the results the authors considered the prediction measures such as RMSE, MAE and MAPE.
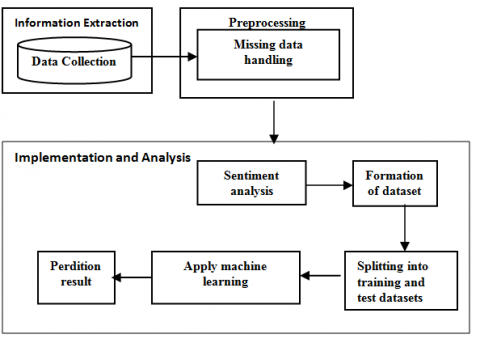
The architecture consists of 3 phases namely information extraction, processing, implementation and analysis. The architecture for the proposed work is presented in Figure 1.
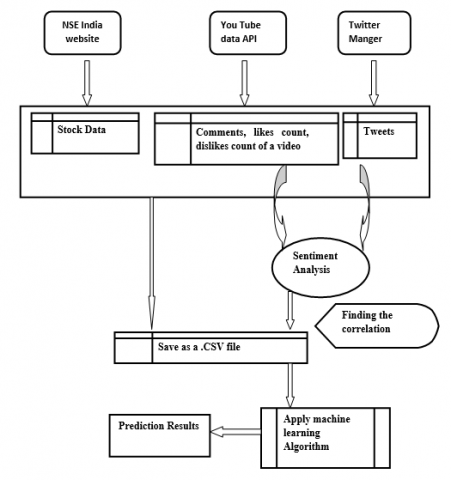
The data flow in current work is as shown in Figure 2.
Figure 1. Proposed architecture
Figure 2. Proposed data flow
Figure 3. Workflow of sentiment analysis
4.1 Gathering data and selecting videos to analyze
The data has been gathered for the period of 6 months i.e., from 1-4-19 to 1-11-19. For each company 10 popular videos views, likes, dislikes from YouTube were collected per day basis. And these cunts are summed up to obtain total number of views, likes and dislikes per day. With the YouTube social service, we can share not only videos and also share experiences and opinions on publicly shared uploaded-videos via the options like, dislike and comment section. For each video, the likes and dislikes are appeared as an integer count just below the video, and it maintains a list of comments.
And also we are allowed to give likes or dislikes to a specific comment, or answers to comment, resulting in formation of a thread; which follows the main comment. This tread is hidden, when only user clicks on a particular comment its list appears. Each and every video have varying amount of likes and dislikes, to perform our study, we considered the famous e commerce companies named info edge and justdail. By automating queries and keyword based searches, the videos and corresponding day wise views, likes and dislikes, comments as shown in Table 1, were gathered with the aid of NPM-package a command line interface called YouTube comment-scraper-cli. The retrieved comments are in json file format with excluded threads. Based on the demography of the commenter, comments may comprise of various languages, with the filtering option only English written comments were filtered in data preprocessing step. From twitter scraper we collected the tweets relevant to infoedge and justdail. From nseindia.com, we considered the day to day stock data for infoedge and justdail as shown in Table 2.
Table 1. Sample data from YouTube
|
|
Just dial |
|||
|
9.7.19 |
ID |
Views |
Likes |
Dislikes |
|
gTp4BRg15g0 |
2346657 |
76675 |
2163 |
|
|
T2mqrx20_Sg |
134838 |
1888 |
184 |
|
|
JH7S5d5Z_IY |
127024 |
1457 |
131 |
|
|
ZBLcFZwPPxE |
112113 |
1390 |
143 |
|
|
ANNVBXAlUeA |
77010 |
423 |
59 |
|
|
6f08QXLC2rQ |
60250 |
1097 |
61 |
|
|
7CzRwjs72Gs |
44110 |
265 |
77 |
|
|
LBYGwfErRXc |
19173 |
946 |
99 |
|
|
BocVSDpK3cQ |
12769 |
479 |
22 |
|
|
oPjsEbx0GAQ |
3815 |
69 |
9 |
|
|
|
Info edge |
|||
|
9.7.19 |
ID |
Views |
Likes |
Dislikes |
|
odI7IN23J4Q |
99654 |
4503 |
184 |
|
|
tni4ag8tKmM |
35750 |
148 |
4 |
|
|
qWPcxrpmQx4 |
12513 |
515 |
13 |
|
|
obQUOowSzs8 |
9525 |
49 |
5 |
|
|
XB4oDJZkdbg |
4895 |
228 |
6 |
|
|
Y_YwwrBNeQc |
2789 |
51 |
2 |
|
|
RKdrzBnBR8s |
1788 |
22 |
2 |
|
|
RghOfJ59Pe4 |
1513 |
59 |
0 |
|
|
fp3WzD6mjk8 |
1505 |
58 |
0 |
|
|
8ou7YWa96xk |
478 |
3 |
0 |
|
Table 2. Sample .csv file
|
Date |
high |
low |
Close |
open |
Views |
V diff |
Like |
Ldiff |
Dislike |
Dldiff |
sentiment |
|
5.7.19 |
790.8 |
765.1 |
770.75 |
780.9 |
2925827 |
5387 |
84379 |
72 |
2928 |
5 |
0.25 |
|
7.7.19 |
- |
- |
- |
- |
2931643 |
5816 |
84457 |
78 |
2934 |
6 |
-0.225 |
|
9.7.19 |
824.8 |
752.5 |
812.25 |
770 |
2938159 |
6516 |
84689 |
232 |
2940 |
6 |
0.2125 |
|
11.7.19 |
783 |
760 |
764.9 |
775.5 |
2944192 |
6033 |
84863 |
174 |
2952 |
12 |
0.037374 |
To improve the model accuracy, we can follow several ways like training more data, treating missing and outlier values, Feature engineering and selection, applying n-number of algorithms, Algorithm tuning by altering parameters and generating a model with ensemble methods. In this research, the concept of ensemble learning was adopted, to get the improvised results. An ensemble mechanism is a technique which combines the resulted predictions from applied ‘n’ number of machine learning algorithms to make better and accurate prediction. There are two methods of ensemble, namely Bagging and Boosting; bagging uses parallel processing mechanism and simple average method to get the finalized prediction, whereas the boosting uses the serial processing mechanism and weighted average method.
4.2 Random forest
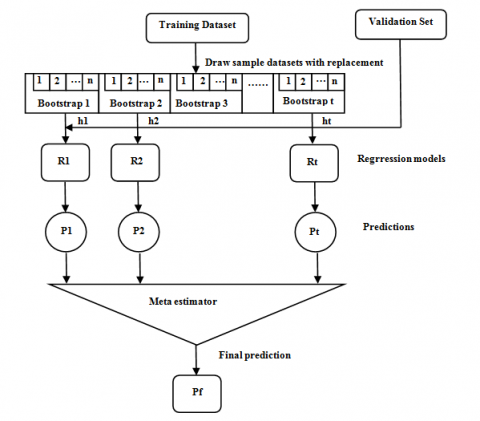
It is a supervised learning technique, which uses an ensemble method namely bagging for classification and regression as shown in Figure 4. The random sampling used for making the developed model more robust than the individual. While constructing a Random Forest regressor, there is no interaction among generated trees and all the trees run in parallel by resulting in mean prediction for each and every tree. Finally the Random Forest aggregates the multiple predictions through averaging of predictions or voting the models.
Advantages: 1) The large amount of training data can handle very efficiently
2) Inherently suited for multi class problems.
3) It is much easier to tune the parameters like number of trees, number of features to be selected at each node.
4) It very difficult to get over-fit with the training data.
Disadvantages:
1) Random forest generates a greater number of trees, which leads to run the model very slow for predictions in real time.
2) For the data sets having categorical variables, it is a biased model. Hence not reliable for such type of data.
Figure 4. The process of Bagging
4.3 XG-boost (extreme gradient boosting-a parallel GBDT)
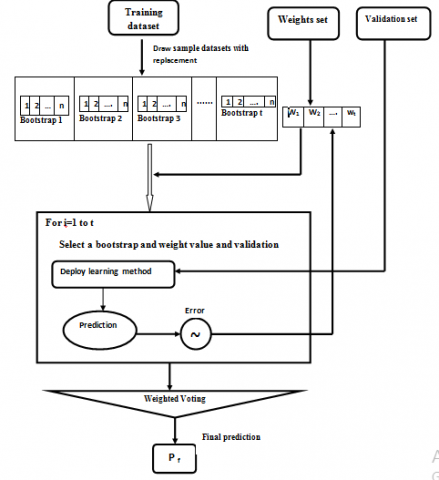
Gradient boosting: It is a supervised learning technique, which uses an ensemble method namely boosting as shown in Figure 5, for classification and regression. It is an approach, where the new models are generated and by using the residuals or errors of the previously generated models. To make the final prediction, we need to add these models in sequential manner. Here the gradient descent algorithm is used to minimize the loss is generated.
Figure 5. The process of boosting
XG Boost: To get the improvised speed and performance than the gradient boosting, a process called parallelization was adopted to the gradient boosting framework. The main contributions in the XGBoost are: i) it considers the 2nd order derivative of the base model loss function as an approximation for minimizing the error of the whole model.
ii) when we are dealing with a large set of features, to improve model generalization and to address feature selection, over-fitting tasks, the advanced regularization techniques namely L1, L2 are used which results in regression models Lasso Regression and Ridge regression respectively.
To handle the over fitting, feature selection tasks, there are traditional methods like stepwise regression and cross-
validation which works well, when only a small set of features.
The experimentation is carried out on the dataset collected for approximately 6 months with the details of comments, likes, dislikes and views from YouTube referring the stock information on a daily basis. The data is evaluated using ensemble machine learning algorithms like Gradient Boost, Random Forest, XG-Boost and observation has been made that XG-Boost performs well by recording minimum MAE, MAPE, RMSE with an accuracy of 71.78% as shown in Table 3. The analytical representation of three algorithms is shown in Figure 6. The performance metrics for various algorithms evaluation is as shown in Figure 7. From Table 2, it can be expressed that the like difference has a greater impact on stock close price i.e., higher is the like difference, maximum closing price. For example, on 9.7.19 date it is observed that like difference is 232 is directly affecting stock close price to hike of 41.50 points on previous close price of 770.75 points dated on 7.7.19 leading to the value of 812.25 points.
Figure 6. Analysis of algorithm’s performance metrics
Figure 7. Performance evaluation
Table 3. Performance metrics for various algorithms
|
Algorithm |
MAE |
MAPE |
RMSE |
Accuracy (%) |
|
Random forest |
1.126 |
1.578 |
1.463 |
67.32 |
|
Gradient boost |
1.098 |
1.549 |
1.226 |
68.67 |
|
XG-Boost |
0.985 |
1.395 |
1.124 |
71.78 |
In this research, the sentiment of comments and tweets were also considered to improve the stock prediction accuracy by introducing the numerical value derived from sentiment analysis along with the data used for predicting the stock trend. In this work, the experimentation is carried out on the data collected from YouTube. The work can be further extended by performing the experiments on data collected from different sources and deploying the stacking concept for obtaining the accurate prediction. The training data need to be improved by excluding irrelevant comments and the amount of videos to analyze need to be increased. Depending on the model and the data selected, the boosting or bagging approaches need to be applied which is used to overcome over-fitting problem but boosting generally exhibits better bais in case of low performance individual models. Depending on the model and the data selected, the boosting or bagging approaches need to be applied which is used to overcome over-fitting problem but boosting generally exhibits better bais in case of low performance individual models. GBM performs better than RF if parameters tuned carefully, Gradient Boosting builds trees in the order of one at a time, where each new tree helps to rectify errors made in the previously trained tree. There exists a correlation among the likes count, dislikes count, comments on YouTube and tweets from twitter but as the variation is very high it is not possible to predict accurately using individual like or dislike counts. In this research, the sentiment of comments and tweets were also considered to improve the stock prediction accuracy by answering the research question, “Can the day to day difference of likes count and dislikes count and comments on a YouTube video and tweets from the twitter be used to determine the respective stock trend prediction” by introducing the numerical value derived from sentiment analysis is used along with the data used for predicting the stock trend. In this work, the experimentation is carried out on the data collected from YouTube. The work can be further extended by performing the experiments on data collected from different sources and deploying the stacking concept for obtaining the accurate prediction. The training data need to be improved by excluding irrelevant comments and the amount of videos to analyze need to be increased.
[1] Bhardwaj, A., Narayan, Y., Vanraj, Pawan, Dutta, M. (2015). Sentiment analysis for Indian stock market prediction using Sensex and nifty. Procedia Computer Science, 70: 85-91. https://doi.org/10.1016/j.procs.2015.10.043
[2] Bilinski, P. (2019). Living in the digital age: The usefulness of Twitter, YouTube and Instagram in corporate communication. Youtube and Instagram in Corporate Communication. http://dx.doi.org/10.2139/ssrn.3311183
[3] Kramer, M. (2019). Social media networking and the impact it has on enterprise application software. Global Journal of Business Research, 13(2): 37-45.
[4] Bhardwaj, N., Ansari, M.A. (2019). Prediction of stock market using machine learning algorithms. International Research Journal of Engineering and Technology, 6(5).
[5] Basak, S., Kar, S., Saha, S., Khaidem, L., Dey, S.R. (2019). Predicting the direction of stock market prices using tree-based classifiers. The North American Journal of Economics and Finance, 47: 552-567. https://doi.org/10.1016/j.najef.2018.06.013
[6] Martin, H., Teodor, I. (2018). Predicting like-ratio on YouTube videos using sentiment analysis on comments. Thesis, School of Electrical Engineering and Computer Science (EECS).
[7] Rahim, M.S., Chowdhury, A.Z.M.E., Islam, M.A., Islam, M.R. (2017). Mining trailers data from Youtube for predicting gross income of movies. In 2017 IEEE Region 10 Humanitarian Technology Conference (R10-HTC), pp. 551-554. https://doi.org/10.1109/R10-HTC.2017.8289020
[8] Golmohammadi, K., Zaiane, O.R. (2017). Sentiment analysis on Twitter to improve time series contextual anomaly detection for detecting stock market manipulation. In International Conference on Big Data Analytics and Knowledge Discovery, pp. 327-342. https://doi.org/10.1007/978-3-319-64283-3_24
[9] Sharief, P.N., Ali, M.M., Prasad, V. (2017). Forecasting stock prices of selected FMCG companies listed in NSE India limited using technical analysis. International Journal of Applied Financial Management Perspectives.
[10] Bhuiyan, H., Ara, J., Bardhan, R., Islam, M.R. (2017). Retrieving YouTube video by sentiment analysis on user comment. 2017 IEEE International Conference on Signal and Image Processing Applications (ICSIPA), pp. 474-478. https://doi.org/10.1109/ICSIPA.2017.8120658
[11] Amar, K. (2013). Polarity trend analysis of public sentiment on YouTube. In Proceedings of the 19th International Conference on Management of Data, pp. 125-128. https://dl.acm.org/doi/abs/10.5555/2694476.2694505
[12] Deng, S., Mitsubuchi, T., Shioda, K., Shimada, T., Sakurai, A. (2011). Combining technical analysis with sentiment analysis for stock price prediction. In 2011 IEEE Ninth International Conference on Dependable, Autonomic and Secure Computing, pp. 800-807. https://doi.org/10.1109/DASC.2011.138