Erwin Sutandar* | Tavio | Daniel Christianto | Ashraf Dhowian Parabi
© 2026 The authors. This article is published by IIETA and is licensed under the CC BY 4.0 license (http://creativecommons.org/licenses/by/4.0/).
OPEN ACCESS
Bauxite refining by Perseroan Terbatas (PT) Indonesia Chemical Alumina (ICA) in Tayan Hilir, West Kalimantan, generates two high-volume by-products: Red mud (RM), a caustic Bayer-process residue, and bottom ash (BA), a coal-combustion residue. Both carry environmental liabilities but also potential value as partial cement replacement materials, evaluated in this study through mechanical performance testing rather than confirmed pozzolanic reactivity, not previously assessed in combination within high-strength concrete (HSC). This study assessed BA and RM as combined partial cement replacements in HSC designed to Indonesian National Standard (SNI) 03-6468-2000 for a 50 MPa target, using five mixtures-a control (V1) and four with BA fixed at 10% and RM varied at 0%, 5%, 10%, and 15% (V2-V5)-across 105 specimens tested for workability, unit weight, compressive strength, splitting tensile strength, and modulus of elasticity, analyzed by descriptive statistics and one-way analysis of variance (ANOVA) with Tukey's honestly significant difference (HSD) (α = 0.05). The 10% BA + 5% RM mixture (V3) reached the highest 28-day compressive strength (53.69 MPa) but was statistically indistinguishable from the control and BA-only mixtures; only V4 and V5 were significantly lower. Splitting tensile strength and modulus of elasticity were significantly reduced, while unit weight was unaffected and remained normal-weight. Combined BA-RM substitution up to 15% can meet the 50 MPa target without a demonstrable strength penalty, though tensile and stiffness performance require independent verification.
bottom ash, compressive strength, high-strength concrete, industrial waste utilization, partial cement replacement, red mud, statistical analysis
Concrete remains the most widely used construction material worldwide because of its high compressive strength, ease of forming [1], ready availability of constituent materials, durability, and resistance to biological decay [2]. The global scale of concrete consumption, however, places sustained pressure on the natural resources from which its constituents-particularly cement-are produced, motivating decades of research into supplementary cementitious materials (SCMs) derived from industrial by-products [3]. High-strength concrete (HSC), defined by Indonesian National Standard (SNI) 03-6468-2000 [4] as concrete with a compressive strength equal to or greater than 41.4 MPa, has become a structural material of choice for high-rise buildings, long-span bridges, dams, piers, chimneys, and tunnels [5] because its superior compressive capacity permits more slender structural elements and more efficient use of space and material [6]. As HSC adoption grows, so too does the need to identify SCMs that are both technically compatible with the demanding mix-design requirements of HSC and environmentally beneficial [7].
Indonesia possesses substantial bauxite reserves [8], with West Kalimantan Province identified as one of the country's most significant bauxite-bearing regions [9]. PT Indonesia Chemical Alumina (ICA), located in Tayan Hilir, Sanggau Regency, processes locally mined bauxite ore into alumina (Al₂O₃) via the Bayer process [10], in which raw bauxite is digested under high temperature and pressure in concentrated sodium hydroxide (NaOH) solution [11]. This process generates red mud (RM), a fine, reddish-brown, highly alkaline semi-solid residue, at an average rate of 0.3–0.5 tonnes per tonne of Al₂O₃ extracted, depending on the bauxite grade processed [12]. Globally, Al₂O₃ refineries generate more than 300 million tonnes of RM annually, and because the material carries high alkalinity and elevated heavy-metal ion content [13-15], Indonesian Government Regulation No. 18 of 1999 classifies RM as hazardous waste; uncontrolled accumulation in tailings ponds presents a recognized ecological liability [10].
The Al₂O₃ refining process is itself energy-intensive, and the energy demand at the ICA facility is met by a coal-fired steam power plant (Pembangkit Listrik Tenaga Uap, PLTU) [11]. Coal combustion in this plant produces fly ash and bottom ash (BA) as residues [16]. BA is the coarser, heavier combustion by-product that settles at the base of the furnace and accumulates in the ash hopper, distinguishing it from the finer, lighter fly ash that is carried with flue gases [16, 17]. BA typically exhibits a granular texture comparable to sand and is reported to carry silica (SiO₂)- and Al₂O₃-bearing phases that motivate its evaluation as a candidate pozzolanic material [17]; the present study does not itself verify pozzolanic reactivity, which requires mineralogical and reactivity testing beyond the scope of this work. Both RM and BA are therefore generated in tandem at the same industrial complex as functionally related by-products of the bauxite-to-Al₂O₃ value chain. Nevertheless, they originate from chemically distinct processes [18]-one hydrometallurgical, one combustion-based-and consequently may offer complementary, though not yet mechanistically confirmed, mineralogical contributions when considered as candidate SCMs [19].
Prior studies have evaluated RM and BA separately as partial cement replacements, generally in normal-strength concrete, with reported optimum dosages around 10% for each material individually [20-23]. Evidence on their combined use specifically within HSC remains limited, leaving open the question of whether the two industrial wastes interact synergistically, neutrally, or antagonistically when incorporated together-a question of direct practical relevance given that both materials are co-located at the same source facility and a combined utilization strategy would simplify waste-valorization logistics.
This study addresses that gap by experimentally evaluating HSC mixtures in which BA is held at a fixed 10% cement replacement-consistent with the optimum dosage reported in prior single-material studies [20, 22, 23]-while RM is varied from 0% to 15% of cement weight, in order to (1) analyze the influence of combined BA and RM addition on the physical and mechanical properties of HSC, and (2) identify, within statistically defensible limits, the best-performing RM dosage within this combined system. The physical properties examined are unit weight and fresh-state workability (mortar consistency, slump, and slump flow); the mechanical properties examined are compressive strength development through 28 days, splitting tensile strength, and modulus of elasticity, each analyzed using the individual replicate results (mean ± standard deviation, one-way analysis of variance (ANOVA), and Tukey's honestly significant difference (HSD) post-hoc test) rather than mean values alone. By isolating the marginal effect of RM against a fixed BA background and subjecting the results to inferential statistical testing, the experimental design provides an evidence base-appropriately qualified by its statistical power and single-laboratory scope-for a dual-waste utilization strategy for the Al₂O₃-refining and coal-power sectors of West Kalimantan.
2.1 Research methods
This study combined a literature review with a laboratory experimental program. The literature review synthesized prior findings on RM and BA as cement substitutes to formulate the testing hypothesis and mix-design boundaries. The experimental program, conducted at the Laboratory of Materials and Construction, Department of Civil Engineering, Faculty of Engineering, Universitas Tanjungpura, Pontianak, generated the physical and mechanical property data analyzed in this paper. Two hypotheses were formulated prior to testing: the null hypothesis (H0) that the addition of BA and RM does not significantly affect the physical and mechanical properties of HSC, and the alternative hypothesis (H1) that the addition of BA and RM significantly affects at least one of these properties. Both hypotheses were evaluated formally using the individual specimen data through one-way ANOVA and Tukey's HSD post-hoc test, as described in Section 2.5, rather than through descriptive comparison of mean values alone.
2.2 Materials
Five constituent materials were used: Portland Composite Cement (PCC) as primary binder, river sand as fine aggregate, crushed stone as coarse aggregate, municipal (Perusahaan Daerah Air Minum (PDAM)) water, and Sikament LN high-range water-reducing admixture (HRWR) at 0.1-1.2% of cement weight. BA was sourced from the coal-fired power plant supplying Perseroan Terbatas (PT) ICA and processed by sun-drying and sieving; as-received material (1,000 g) yielded 865 g of usable graded material. RM was sourced directly from PT ICA and similarly processed; 1,000 g as-received yielded 605 g of usable fine material. All constituent materials were characterized through standardized laboratory testing prior to mix design, based on the density and unit-weight tests reported in the source thesis (SNI 15-2531-1991 [24] for cement specific gravity was applied by analogy to BA and RM, since no dedicated national standard for BA/RM specific gravity exists); the results are summarized in Table 1.
The concrete mix proportions were designed in accordance with SNI 03-6468-2000 [4] for a target 28-day compressive strength of 50 MPa. Five mix variations were prepared, differentiated by BA and RM content as a percentage of cement weight: V1 (control, 0% BA, 0% RM), V2 (10% BA, 0% RM), V3 (10% BA, 5% RM), V4 (10% BA, 10% RM), and V5 (10% BA, 15% RM). BA content was fixed at 10% across V2–V5, consistent with the optimum dosage identified in prior single-material studies [20, 22, 23], so that the experimental design isolates the marginal effect of RM content against a constant BA background. Because RM-only mixtures and bottom-ash levels other than 10% were not tested, this design can isolate the effect of adding RM on top of a fixed bottom-ash background, but it cannot statistically confirm a true BA–RM interaction; claims of synergy between the two materials should therefore be read as a hypothesis for future factorial testing rather than as a demonstrated result. The resulting mix proportions per cubic meter of concrete, at a constant total binder content of 539.8 kg/m³ and water-to-binder ratio of 0.392, are presented in Table 2, where BA and RM percentages are calculated relative to the original cement mass, and total binder is held constant at approximately 539.8 kg/m³.
Total binder content (cement plus BA plus RM) was held constant by design at 539.8 kg/m³ for V1-V4; the value of 539.9 kg/m³ shown for V5 in Table 2 is a rounding artifact of summing the individually rounded component masses (404.9 + 81.0 + 54.0 kg) and not an intentional deviation. Because mixing water was likewise held constant at 211.8 kg/m³ across all five mixtures, the water-to-binder ratio is effectively constant at 0.392 for every variation; the small V5 rounding difference changes this ratio by less than 0.001 and is not practically meaningful. The superplasticizer used was Sikament LN, an HRWR manufactured by PT Sika, reported to reduce mixing water demand by up to approximately 40%; the source thesis states an allowable dosage range of 0.1-1.2% of cement weight but records a single fixed dosage of 4.3 kg/m³ (approximately 0.8% of total binder mass) applied uniformly across all five mixtures.
Table 1. Physical characterization of all constituent materials
|
Material |
Property |
Result |
Standard |
Specification Limit |
Status |
|
Cement (PCC) |
Specific gravity |
3.062 |
SNI 15-2531-1991 [24] |
2.85–3.15 |
Valid |
|
|
Unit weight (kg/m³) |
1,251.534 |
— |
1,100–1,300 |
Valid |
|
|
Normal consistency (%) |
26 |
SNI 15-2049-2004 [25] |
25–29 |
Valid |
|
|
Initial setting time (min) |
100 |
SNI 15-2049-2004 [25] |
≥45 |
Valid |
|
Fine aggregate |
Specific gravity, SSD |
2.619 |
SNI 1970:2008 [26] |
1.6–3.3 |
Valid |
|
|
Water absorption (%) |
1.071 |
— |
<3 |
Valid |
|
|
Silt content (%) |
1.000 |
SNI S-04-1989-F [27] |
<5 |
Valid |
|
|
Fineness modulus |
2.546 |
SNI 03-2834-2000 [28] |
2.5–3.2 |
Valid |
|
Coarse aggregate |
Specific gravity, SSD |
2.650 |
SK SNI T-15-1990 [29] |
2.5–2.7 |
Valid |
|
|
Water absorption (%) |
0.700 |
— |
<2 |
Valid |
|
|
Silt content (%) |
0.700 |
PBI 1971 [30] |
<1 |
Valid |
|
|
Los Angeles abrasion (%) |
15.400 |
SNI 2417:2008 [31] |
<27 |
Valid |
|
Bottom ash (BA) |
Specific gravity |
2.546 |
SNI 15-2531-1991 [24] (analogous) |
2.1–2.7 |
Valid |
|
|
Unit weight (kg/m³) |
1,479.027 |
— |
720–1,600 |
Valid |
|
Red mud (RM) |
Specific gravity |
3.019 |
SNI 15-2531-1991 [24] (analogous) |
2.8–3.6 |
Valid |
|
|
Unit weight (kg/m³) |
1,196.111 |
— |
900–1,300 |
Valid |
Table 2. Mix proportions per cubic meter of concrete for each variation
|
Material (kg/m³) |
V1 |
V2 |
V3 |
V4 |
V5 |
|
Cement |
539.8 |
485.8 |
458.8 |
431.8 |
404.9 |
|
Coarse aggregate |
909.3 |
909.3 |
909.3 |
909.3 |
909.3 |
|
Fine aggregate |
660.0 |
663.9 |
663.6 |
663.3 |
662.9 |
|
Bottom ash (BA) |
0.0 |
54.0 |
54.0 |
54.0 |
54.0 |
|
Red mud (RM) |
0.0 |
0.0 |
27.0 |
54.0 |
81.0 |
|
Water |
211.8 |
211.8 |
211.8 |
211.8 |
211.8 |
|
Superplasticizer |
4.3 |
4.3 |
4.3 |
4.3 |
4.3 |
|
Total binder |
539.8 |
539.8 |
539.8 |
539.8 |
539.9 |
|
Water/binder ratio |
0.392 |
0.392 |
0.392 |
0.392 |
0.392 |
Table 3. Chemical composition of bottom ash (BA)
|
Oxide Compound |
Content (%) |
|
Silica (SiO₂) |
42.870 |
|
Alumina (Al₂O₃) |
16.940 |
|
Iron oxide (Fe₂O₃) |
7.430 |
|
Calcium oxide (CaO) |
15.750 |
|
Magnesia (MgO) |
9.120 |
|
Titanium dioxide (TiO₂) |
0.730 |
|
Sodium oxide (Na₂O) |
0.470 |
|
Potassium oxide (K₂O) |
0.900 |
|
Hausmannite (Mn₃O₄) |
0.461 |
|
Phosphorus pentoxide (P₂O₅) |
0.395 |
|
Sulfur trioxide (SO₃) |
4.390 |
The oxide compositions used to justify the pozzolanic classification of BA and RM are presented in Tables 3 and 4. The bottom-ash composition (Table 3) is dominated by SiO₂ (42.87%) and calcium oxide (CaO, 15.75%), with a significant Al₂O₃ (16.94%) fraction, and was obtained by X-ray fluorescence (XRF) analysis of the specific batch used in this study. The red-mud composition (Table 4) is a non-normalized range compiled from the literature, citing the PT ICA characterization reference, rather than a site-specific XRF result for the RM batch used here. The individual oxide ranges in Table 4 can therefore sum to more than 100% and should not be read as an analytically closed composition. Accordingly, the red-mud oxide data are used only as general context and not to assert specific pozzolanic reaction mechanisms, which would require XRF and X-ray diffraction (XRD) analysis of the RM batch, together with loss-on-ignition, pH, and particle-size distribution data.
Of the characterization parameters commonly required for a candidate supplementary cementitious material (SCM), this study measured specific gravity and unit weight for both BA and RM (Table 1), and chemical composition for BA only (Table 3). The RM oxide identity is corroborated, though not in exact proportions, by XRF and mineralogical characterizations of RM from the same industrial source (PT ICA, Tayan) reported by Damayanti and Khareunissa [10], Zaharah et al. [14], and Wahyinto et al. [15]. Particle size distribution, particle morphology, pH, and loss on ignition were not measured for either material. This is a methodological limitation of the present study, and its consequences for the mechanistic claims in Sections 3.3 and 3.6 are addressed in Section 3.7.
2.3 Specimen preparation and testing program
Cylindrical specimens of two sizes were cast: 100 mm diameter × 200 mm height, used for compressive strength testing at 3, 7, 14, 21, and 28 days; and 150 mm diameter × 300 mm height, used for splitting tensile strength and modulus of elasticity testing at 28 days. Three specimens were cast for each test, age, and variation combination, yielding a total testing matrix of 105 specimens: 75 for compressive strength (5 variations × 5 ages × 3 replicates), 15 for modulus of elasticity (5 variations × 3 nominal replicates; for V1 and V5, only two of the three cast specimens yielded valid chord-modulus readings, the third specimen's result is not reported in the available data and the nominal total of 15 differs from the 13 valid modulus readings actually analyzed statistically-see Section 3.5), and 15 for splitting tensile strength (5 variations × 3 replicates), as summarized in Table 5.
Concrete was batched in a laboratory mixer, with constituent materials introduced in the following sequence: fine aggregate, cement, RM, BA, water, admixture (Sikament LN), and coarse aggregate. After mixing, slump was measured using an Abrams cone, and the mixture was cast into lubricated cylindrical moulds in layers, each layer compacted to remove entrapped air and achieve maximum density. Following demoulding, curing was performed by periodically sprinkling the specimens with water while shielding them from direct sunlight, from the time of demoulding through each specimen's respective testing age (up to 28 days). This is an intermittent moist-curing regime rather than full water immersion, which the SNI/American Society for Testing and Materials (ASTM) references below and considered when comparing results with studies that use immersion curing. Prior to compressive-strength and modulus-of-elasticity testing, the loaded end surfaces of each specimen were capped.
Table 4. Chemical composition of red mud (RM) from PT Indonesia Chemical Alumina (ICA)
|
Oxide Compound |
Content (%) |
|
Alumina (Al₂O₃) |
61.24 |
|
Iron oxide (Fe₂O₃) |
29-42 |
|
Silica (SiO₂) |
12-24 |
|
Titanium oxide (TiO₂) |
1-2 |
|
Sodium oxide (Na₂O) |
7-13 |
|
Other minerals |
10-22 |
Table 5. Specimen testing matrix
|
Variation |
Compressive Strength & Unit Weight (3, 7, 14, 21, 28 Days) |
Modulus of Elasticity (28 Days) |
Splitting Tensile Strength (28 Days) |
|
V1 |
15 |
3 |
3 |
|
V2 |
15 |
3 |
3 |
|
V3 |
15 |
3 |
3 |
|
V4 |
15 |
3 |
3 |
|
V5 |
15 |
3 |
3 |
|
Total |
75 |
15 |
15 |
2.4 Test methods
Fresh-state properties. Mortar flow consistency was evaluated in accordance with ASTM C1437-07 (“Standard Test Method for Flow of Hydraulic Cement Mortar”) [32] to assess the workability of the mortar fraction before incorporation of coarse aggregate. Slump was measured following SNI 1972:2008 [33] after superplasticizer addition; per SNI 03-6468-2000 [4], slump for HSC mixtures incorporating HRWR admixture may exceed 200 mm. Slump flow was measured following ASTM C1611 [34] to characterize the flowability and filling ability of the fresh mixture.
Unit weight. Hardened unit weight was determined for 100 × 200 mm cylinders at 28 days by dividing specimen mass by specimen volume, following the mass/volume approach analogous to ASTM C138/C138M [35], and benchmarked against the SNI 03-2847-2002 [36] normal-weight concrete range of 2,200-2,500 kg/m³.
Compressive strength. Compressive strength was determined on 100 × 200 mm cylinders at 3, 7, 14, 21, and 28 days following SNI 1974:2011 [37] (“Cara Uji Tekan Beton dengan Benda Uji Silinder,” analogous to ASTM C39/C39M [38]), using a compression testing machine (MBT brand, 2,000 kN capacity) and calculated as the failure load divided by the nominal cross-sectional area (7,850 mm²).
Splitting tensile strength. Splitting tensile strength was determined on 150 × 300 mm cylinders at 28 days following SNI 03-2491-2002 [39] (analogous to ASTM C496/C496M [40]), calculated as T = 2P/(πLD), where T is splitting tensile strength (MPa), P is the maximum applied load (N), L is the specimen length (mm), and D is the specimen diameter (mm), applied continuously at a constant loading rate of 0.7-1.4 MPa/min. Results were compared against the American Concrete Institute (ACI) 318-1999 [41] empirical reference, T = 0.56√fc′, evaluated using the measured 28-day compressive strength of each individual mixture rather than the 50 MPa design value, so that the benchmark reflects the concrete actually produced in each mixture (see Section 3.4).
Modulus of elasticity. Modulus of elasticity was determined on 150 × 300 mm cylinders at 28 days following SNI 03-4169-1996 [42] (analogous to ASTM C469/C469M [43]) using a longitudinal compressometer and extensometer, with load applied continuously in increments of 50 kN. Results were computed using four approaches-secant modulus, chord modulus, initial tangent modulus, and tangent modulus-and compared against the empirical prediction of ACI 363R-92 [44] for HSC, Ec = (3,320√fc′ + 6,900) × (Wc/2,320)1.5, where Ec is the predicted modulus of elasticity (MPa), fc′ is the measured compressive strength (MPa), and Wc is the measured unit weight (kg/m³), both evaluated per mixture. Because ASTM C469 [43] defines the standard elastic modulus as the chord modulus measured between 0.05fc′ and 0.40fc′, the discussion in Section 3.5 treats the chord modulus as the primary reported value, with the secant, initial-tangent, and tangent moduli reported for comparison only.
2.5 Statistical analysis
Individual specimen results for all 105 nominally cast specimens (75 compressive-strength, 15 splitting-tensile-strength, and 15 modulus-of-elasticity specimens) were compiled, of which 13 of the 15 modulus-of-elasticity specimens yielded valid readings and were included in the statistical analysis (two specimens, one each from V1 and V5, did not; see Section 3.5 for the valid count per mixture), while all 75 compressive-strength and 15 splitting-tensile-strength specimens were valid from the laboratory data sheets in the source thesis. For each property, age, and mixture, results are reported as mean ± standard deviation (n = 2-3, as available) together with the coefficient of variation (CV). Differences among the five mixtures were tested using one-way ANOVA after inspecting the data for approximate normality and homogeneity of variance given the small sample sizes; where the ANOVA F-test indicated a significant overall difference (α = 0.05), Tukey's HSD post-hoc test was applied to identify which specific pairs of mixtures differed significantly, and compact letter groupings are reported alongside the corresponding figures. The sample size of n = 3 per group follows common practice in concrete mechanical testing under SNI 1974:2011 [37] and the analogous ASTM C39/C39M [38] series, which specify a minimum of three specimens per test condition; this size was adopted given the laboratory-scale resource constraints of the source study, and the reported CV and post-hoc pairwise comparisons are provided to make the resulting statistical power transparent to the reader. Because compressive strength was measured at five ages, a two-factor (mixture × age) ANOVA could in principle also be applied; the present analysis instead reports one-way ANOVA separately at each age, which is more conservative and does not assume a common variance structure across ages. All statistical computations were performed in Python (SciPy and statsmodels); the underlying individual specimen values are available as supplementary data and should be deposited alongside the final manuscript.
3.1 Fresh-state properties and workability
Incorporation of BA and RM produced a visually detectable change in concrete color, progressing from light gray in the control and bottom-ash-only mixtures (V1, V2) to grayish-brown in the moderate red-mud mixtures (V3, V4) and to a reddish light-brown in the highest red-mud mixture (V5), consistent with the characteristic reddish-brown coloration of RM itself. This color shift is a convenient qualitative field indicator of red-mud dosage during batching, though it is not itself a performance measure and is not treated as such in the hypothesis testing below.
Table 6. Fresh-state properties of high-strength concrete (HSC) mixtures
|
Variation |
Mortar Consistency, Mean (%) |
Slump after Superplasticizer, Mean ± SD (cm) |
Slump Flow, Mean ± SD (cm) |
|
V1 (0% BA, 0% RM) |
103.75 |
23.50 ± 0.46 |
38.00 ± 1.41 |
|
V2 (10% BA, 0% RM) |
107.75 |
17.30 ± 0.70 |
32.00 ± 1.41 |
|
V3 (10% BA, 5% RM) |
110.50 |
16.50 ± 0.50 |
33.25 ± 0.35 |
|
V4 (10% BA, 10% RM) |
105.00 |
14.90 ± 0.66 |
30.00 ± 0.00 |
|
V5 (10% BA, 15% RM) |
100.50 |
15.23 ± 0.25 |
32.00 ± 1.41 |
Mortar flow consistency after superplasticizer addition, based on the mean of four dial readings per mixture (without an independent replicate structure suitable for computing a standard deviation), ranged from 100.50% (V5) to 110.50% (V3) (Table 6), comfortably within the 100-150% workability range reported by Neville and Brooks. Consistency increased from V1 (103.75%) to a peak at V3 (110.50%) before declining at V4 (105.00%) and V5 (100.50%). Slump after superplasticizer addition, reported as mean ± SD across n = 3 field readings, was highest for the control mixture V1 (23.50 ± 0.46 cm) and decreased across the substituted mixtures to 14.90-17.30 cm for V2-V5, consistent with the increased fines content associated with bottom-ash incorporation; BA is reported in the literature to have an angular, porous particle texture that increases internal friction in fresh mixtures [17], though this texture was not independently verified for the batches used in this study (Section 3.7), so the reduction is described here as consistent with, rather than demonstrated to result from, that mechanism. All slump values remained within the SNI 03-6468-2000 [4] allowance for HRWR-modified HSC mixtures. Slump flow, reported as mean ± SD across n = 2 field readings, followed a parallel trend, ranging from 30.00 to 38.00 cm, with the control mixture again showing the highest flowability. Given the small number of replicates available for these fresh-state indices (n = 2-3 per mixture), formal ANOVA is reported only for the properties measured on hardened specimens (Sections 3.2-3.5); the fresh-state trends described here should be read as descriptive rather than as statistically confirmed differences. Figure 1 presents workability indicators with their standard deviations.
Figure 1. Slump, slump flow, and mortar consistency across mix variations (mean ± standard deviation (SD))
3.2 Unit weight
Hardened unit weight at 28 days ranged from 2,321.54 ± 31.24 kg/m³ (V4) to 2,353.37 ± 12.05 kg/m³ (V1), as summarized in Table 7 and Figure 2. All five variations fall within the SNI 03-2847-2002 [36] normal-weight concrete classification of 2,200-2,500 kg/m³. A one-way ANOVA across the five mixtures did not detect a statistically significant difference in unit weight (F(4,10) = 2.09, p = 0.157); the apparent downward trend in unit weight from V1 through V4 is therefore descriptive and is consistent with, but not statistically proven by, the lower specific gravities of BA (2.546) and RM (3.019) relative to cement (3.062). Because the unit-weight variation across all mixtures spans only about 1.4% of the mean value and is not statistically distinguishable among mixtures, the practical structural-design implication of bottom-ash and red-mud substitution on self-weight is negligible within the tested dosage range.
Figure 2. Unit weight of high-strength concrete (HSC) at 28 days (mean ± standard deviation (SD)); shaded band shows the SNI 03-2847-2002 normal-weight range
Table 7. Unit weight of high-strength concrete (HSC) at 28 days (n = 3 per mixture)
|
Variation |
Unit Weight, Mean ± SD (kg/m³) |
CV (%) |
SNI 03-2847-2002 [36] Range (kg/m³) |
Classification |
|
V1 (0% BA, 0% RM) |
2,353.37 ± 12.05 |
0.51 |
2,200–2,500 |
Normal-weight |
|
V2 (10% BA, 0% RM) |
2,350.19 ± 6.63 |
0.28 |
2,200–2,500 |
Normal-weight |
|
V3 (10% BA, 5% RM) |
2,345.94 ± 8.42 |
0.36 |
2,200–2,500 |
Normal-weight |
|
V4 (10% BA, 10% RM) |
2,321.54 ± 31.24 |
1.35 |
2,200–2,500 |
Normal-weight |
|
V5 (10% BA, 15% RM) |
2,330.03 ± 11.03 |
0.47 |
2,200–2,500 |
Normal-weight |
3.3 Compressive strength development
Mean compressive strength results (± SD, n = 3) for each variation at curing ages of 3, 7, 14, 21, and 28 days are presented in Table 8 and Figure 3. All five mixtures show the expected pattern of strength gain with curing age. A one-way ANOVA (df = 4, 10) was performed separately at each age to test for differences among the five mixtures (Table 9); statistically significant differences were detected at 3, 14, 21, and 28 days (p < 0.05 in each case) but not at 7 days (p = 0.444), indicating that the mixture effect on compressive strength is not uniform across the curing period and should not be assumed present at every age from the 28-day result alone.
Table 8. Compressive strength by curing age and mix variation, mean ± SD (MPa), n = 3 per cell
|
Variation |
3 Days |
7 Days |
14 Days |
21 Days |
28 Days |
|
V1 (0% BA, 0% RM) |
26.31 ± 0.74 |
34.17 ± 0.74 |
41.81 ± 0.37 |
46.26 ± 2.65 |
52.20 ± 1.68 |
|
V2 (10% BA, 0% RM) |
27.80 ± 1.33 |
30.98 ± 1.47 |
35.65 ± 3.37 |
46.69 ± 3.51 |
52.84 ± 1.68 |
|
V3 (10% BA, 5% RM) |
29.29 ± 0.64 |
33.53 ± 5.74 |
40.32 ± 3.01 |
48.60 ± 0.37 |
53.69 ± 2.24 |
|
V4 (10% BA, 10% RM) |
25.04 ± 2.57 |
30.56 ± 0.64 |
35.44 ± 0.97 |
42.23 ± 4.52 |
45.41 ± 3.73 |
|
V5 (10% BA, 15% RM) |
28.22 ± 1.47 |
32.04 ± 0.37 |
36.08 ± 0.37 |
40.96 ± 0.74 |
42.87 ± 0.97 |
Table 9. One-way analysis of variance (ANOVA) results for compressive strength at each curing age
|
Curing Age |
One-Way ANOVA F(4,10) |
p-Value |
Significant at α = 0.05 |
|
3 days |
3.63 |
0.045 |
Yes |
|
7 days |
1.02 |
0.444 |
No |
|
14 days |
6.17 |
0.009 |
Yes |
|
21 days |
3.84 |
0.038 |
Yes |
|
28 days |
14.20 |
<0.001 |
Yes |
Figure 3. Compressive strength development with curing age (mean ± standard deviation (SD), n = 3)
Figure 4. 28-day compressive strength by mix variation (mean ± standard deviation (SD), n = 3)
At 28 days, Tukey's HSD post-hoc test partitions the five mixtures into two statistically distinct groups (Figure 4): V1, V2, and V3 form one group (compact letter “a”), not significantly different from one another (all pairwise p > 0.19), while V4 and V5 form a second, significantly lower group (“b”, both significantly below V1, V2, and V3 at p < 0.05; V4 versus V5 itself is not significant p = 0.65). This is an important qualification of the numerically highest result: although V3 (10% BA + 5% RM) recorded the highest mean 28-day compressive strength (53.69 ± 2.24 MPa), exceeding V1 (52.20 ± 1.68 MPa) by 2.85% and V2 (52.84 ± 1.68 MPa) by 1.61%, this difference is not statistically significant given the observed within-group variability (n = 3 per mixture). V3 should therefore be described as the numerically best-performing composition among the tested mixtures at 28 days, and not as significantly superior to the control or to the bottom-ash-only mixture. What is statistically supported is that raising RM content to 10% and 15% (V4, V5, on a fixed 10% bottom-ash background) produces a significant reduction in 28-day compressive strength relative to V1, V2, and V3-both V4 (45.41 MPa) and V5 (42.87 MPa) fall below the 50 MPa design target, whereas V1, V2, and V3 meet or exceed it.
The quadratic and exponential regression models used in an earlier draft of this analysis to describe the relationship between RM content and 28-day compressive strength, and to model the strength-gain curve with age, have been removed from this revision. Refitting a second-order polynomial through the measured 28-day means for V2-V5 (BA fixed at 10%; RM at 0%, 5%, 10%, 15%) produces a curve that decreases monotonically over the entire tested range (0-15% RM) with its vertex located outside the tested domain; it therefore does not mathematically substantiate an optimum at 5% RM, even though 5% is the best-performing dosage among the four discrete levels actually tested. Likewise, an exponential strength-gain model of the form fc(t) = fc,28(1 − e−kt) fitted to the 3-28-day data produced “asymptotic” 28-day strength parameters that were, for several mixtures, lower than the actually measured 28-day strength-an internally inconsistent result that cannot be reported as a valid model. Both observations are described here as a methodological caution: with only four to five discrete dosage levels and no replication at intermediate red-mud contents, the present data can identify which of the tested compositions performed best, but cannot support a continuous mathematical optimum or growth-rate model without additional intermediate dosages and repeated testing.
Two hypotheses may explain the pattern in which V3 performs numerically, though not statistically significantly, better than V1 and V2, while V4 and V5 perform significantly worse: at low red-mud dosage, RM-rich in Al₂O₃ (61.24% Al₂O₃ by the literature-derived composition in Table 4) and iron oxide-may act as a fine filler that improves particle packing without a large dilution penalty, consistent with the corresponding increase in mortar consistency from V1 to V3 (Section 3.1); at higher combined replacement (10% BA plus 10% or 15% RM, i.e., 20-25% of cement mass), the cumulative reduction in reactive Portland cement may outweigh any packing or pozzolanic contribution. Because no scanning electron microscopy (SEM), XRD, thermogravimetric analysis (TGA), or actual XRF characterization of the RM used was performed in this study, these mechanisms remain hypotheses consistent with the observed mechanical trend rather than confirmed explanations, and are stated using hedged language (“may be attributed to,” “is consistent with”) throughout this discussion. A further, independent constraint applies specifically to any reading of this pattern as a BA-RM synergy: because BA was held fixed at 10% and only RM content was varied (Section 2.2), the experimental design cannot statistically test a BA×RM interaction term, and the numerically favorable V3 result should not be interpreted as statistical evidence of a synergistic effect between the two materials.
3.4 Splitting tensile strength
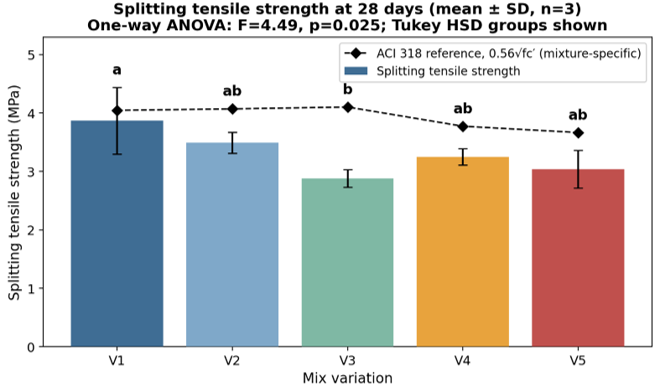
Splitting tensile strength results at 28 days, recalculated from the individual specimen loads, are presented in Table 10 and Figure 5. Unlike compressive strength, splitting tensile strength did not follow a simple monotonic trend with combined substitution: the control mixture V1 recorded the highest mean splitting tensile strength (3.87 ± 0.57 MPa), followed by V2 (3.49 ± 0.18 MPa), V4 (3.25 ± 0.14 MPa), V5 (3.04 ± 0.32 MPa), and V3 (2.88 ± 0.15 MPa) as the lowest. A one-way ANOVA indicated a statistically significant overall difference among mixtures (F(4,10) = 4.49, p = 0.025); however, Tukey's HSD post-hoc test identifies only the V1–V3 pair as individually significant (p = 0.022), while V2, V4, and V5 are not significantly different from either V1 or V3 (compact letters: V1 = a, V3 = b, V2/V4/V5 = ab). The practical reading of this result is that the reduction in tensile strength is clearly established between the control and the V3 optimum-compressive-strength mixture, but the intermediate mixtures cannot be confidently ranked against one another with the available replication (n = 3 per mixture). The ACI 318-1999 [41] reference value in Table 10 is evaluated using each mixture's own measured 28-day compressive strength (Table 8) rather than the 50 MPa design value, so the comparison reflects the concrete actually produced.
Table 10. Splitting tensile strength at 28 days
|
Variation |
Splitting Tensile Strength, Mean ± SD (MPa) |
CV (%) |
ACI 318 [41] Reference, 0.56√fc′ (MPa) |
Ratio to Reference (%) |
Tukey Group |
|
V1 (0% BA, 0% RM) |
3.87 ± 0.57 |
14.79 |
4.046 |
95.6 |
a |
|
V2 (10% BA, 0% RM) |
3.49 ± 0.18 |
5.09 |
4.071 |
85.7 |
ab |
|
V3 (10% BA, 5% RM) |
2.88 ± 0.15 |
5.12 |
4.103 |
70.1 |
b |
|
V4 (10% BA, 10% RM) |
3.25 ± 0.14 |
4.35 |
3.774 |
86.2 |
ab |
|
V5 (10% BA, 15% RM) |
3.04 ± 0.32 |
10.66 |
3.666 |
83.0 |
ab |
Every mixture, including the control, fell below its own mixture-specific ACI 318-1999 reference value, with the shortfall most pronounced for V3 (70.1% of the reference) despite V3 having the highest compressive strength among all mixtures. This divergence between compressive and tensile performance is consistent with the general understanding that splitting tensile strength is governed strongly by the interfacial transition zone (ITZ) and the tensile capacity of the cement paste matrix, both of which the literature reports as more sensitive to angular, porous SCM particle texture than bulk compressive strength; this literature-based mechanism has not been verified for the present materials, since neither particle morphology nor microstructural imaging of the BA/RM batches or the hardened paste was performed in this study (Section 3.7), and it is offered here only as one plausible, unconfirmed explanation for the observed divergence between compressive and tensile results. The practical implication is that meeting or exceeding the compressive-strength target at V2 or V3 does not imply a proportional tensile-strength benefit, and designers should verify splitting tensile strength independently rather than inferring it from compressive-strength compliance when specifying these SCMs in HSC.
3.5 Modulus of elasticity
Modulus of elasticity was evaluated at 28 days using four calculation approaches under ASTM C469 [43] -secant modulus, chord modulus, initial tangent modulus, and tangent modulus-alongside the mixture-specific ACI 363R-92 [44] empirical prediction; the individual-method means are summarized in Table 11 and shown in full in Figure 6 (chord modulus) for statistical comparison. Because ASTM C469 [43] defines the standard reported elastic modulus as the chord modulus (measured between 0.05fc′ and 0.40fc′ on the stress–strain curve), the statistical analysis in this section is reported for chord modulus specifically. This choice avoids treating all four values as equivalent alternative outputs of the same standard method, consistent with reviewer guidance that presenting four unqualified moduli side by side makes interpretation ambiguous.
Of the 15 modulus specimens cast (three per mixture), 13 yielded valid chord-modulus readings: V2, V3, and V4 each contributed all three specimens, while V1 and V5 each contributed two, one specimen from each having failed to produce a valid reading in the source data (Table 11). A one-way ANOVA on these 13 chord-modulus readings indicated a highly significant overall difference among mixtures (F(4, 8) = 16.60, p < 0.001). Tukey's HSD post-hoc test shows that the control mixture V1 (32.47 ± 4.19 GPa) is significantly stiffer than all four bottom-ash/red-mud mixtures (V2-V5, all p < 0.01), while V2 (22.16 ± 1.36 GPa), V3 (17.93 ± 1.31 GPa), V4 (22.23 ± 2.54 GPa), and V5 (17.28 ± 0.38 GPa) do not differ significantly from one another (all pairwise p > 0.18). This indicates that incorporating BA and RM together-at any of the tested red-mud dosages-produces a statistically significant stiffness penalty relative to the unmodified concrete, but the present data cannot statistically distinguish among the different red-mud dosages themselves in terms of chord modulus. For the control mixture V1, the secant and chord moduli exceed the ACI 363R-92 [44] prediction (26.80 GPa) by roughly 20–24%, consistent with V1's denser, single-binder matrix. For the modified mixtures, the chord modulus falls below the ACI 363R-92 [44] prediction by roughly 8% (V2) to 34% (V3, V5). This indicates that the empirical ACI relationship, calibrated broadly across conventional HSC, tends to overestimate stiffness for bottom-ash/red-mud-modified mixtures at the higher substitution levels and should not be applied to this system without an appropriate reduction factor, which would need to be established from a larger dataset than the present study provides.
Table 11. Modulus of elasticity by calculation method and mix variation (MPa)
|
Variation |
n |
Secant Modulus |
Chord Modulus |
Initial Tangent Modulus |
Tangent Modulus |
ACI 363R-92 [44] Prediction |
|
V1 (0% BA, 0% RM) |
2 |
33,224.27 |
32,473.25 |
40,991.96 |
25,294.31 |
26,795.87 |
|
V2 (10% BA, 0% RM) |
3 |
22,485.78 |
22,163.79 |
27,852.97 |
17,379.90 |
26,971.44 |
|
V3 (10% BA, 5% RM) |
3 |
18,151.19 |
17,933.69 |
22,698.53 |
13,744.98 |
27,203.17 |
|
V4 (10% BA, 10% RM) |
3 |
22,541.17 |
22,230.75 |
26,463.46 |
18,156.65 |
24,151.27 |
|
V5 (10% BA, 15% RM) |
2 |
17,583.44 |
17,276.65 |
22,538.50 |
13,520.37 |
24,015.15 |
3.6 Synthesis: Best-performing composition and governing mechanisms
Considered together, the statistically tested results converge on a qualified narrative around the V3 mixture (10% BA + 5% RM) as the numerically best-performing composition within the tested range, rather than an unambiguous optimum across all properties. Table 12 consolidates the complete set of results, together with their statistical qualification, against the relevant reference standards.
Two hedged hypotheses may explain the pattern in which mechanical performance diverges between compressive strength (numerically peaking at V3, though not significantly above V1/V2) and both splitting tensile strength and chord modulus (both significantly reduced by BA/RM incorporation relative to V1, largely independent of red-mud dosage beyond the initial addition of BA). First, RM at low dosage may act as a fine filler that improves particle packing in the paste, broadly consistent with the corresponding rise in mortar consistency from V1 to V3; this filler effect, if present, appears to benefit compressive strength more than tensile strength or stiffness, plausibly because compressive strength is governed by the bulk paste-aggregate system while tensile strength and modulus are more sensitive to the ITZ and micro-flaw distribution, which the literature associates with angular, porous SCM particle texture-a texture reported for BA and RM generally, but not independently verified for the batches used here, since particle morphology was not measured in this study (Section 3.7). Second, at higher combined replacement (V4, V5), compressive strength is significantly reduced (Section 3.3), while tensile strength and modulus-already reduced at the V2/V3 dosages-do not deteriorate much further; the cumulative dilution of reactive Portland cement is proposed as one plausible explanation for the compressive-strength reduction specifically, but this causal attribution is itself untested and should be distinguished from the statistical significance of the strength reduction it attempts to explain. Both explanations remain hypotheses consistent with the measured mechanical trends; confirming them would require SEM, XRD, TGA, and porosity measurements that were outside the scope of this study, and the language above (“may,” “plausibly,” “appears to”) is used throughout to reflect that these are proposed, not demonstrated, mechanisms. Likewise, because RM content was the only factor varied against a BA level held fixed at 10% (Section 2.2), neither explanation should be read as evidence of a statistically confirmed BA–RM interaction; the present one-factor-at-a-time design can describe the marginal effect of RM but cannot establish that the two materials act synergistically.
Table 12. Consolidated summary of physical and mechanical test results with statistical qualification
|
Property |
V1 |
V2 |
V3 |
V4 |
V5 |
Statistical Result |
|
Unit weight (kg/m³) |
2,353.4 |
2,350.2 |
2,345.9 |
2,321.5 |
2,330.0 |
No significant difference (p = 0.157) |
|
Compressive strength, 28 d (MPa) |
52.20 |
52.84 |
53.69 |
45.41 |
42.87 |
V1 ≈ V2 ≈ V3 > V4 ≈ V5 (p < 0.001) |
|
Splitting tensile strength (MPa) |
3.87 |
3.49 |
2.88 |
3.25 |
3.04 |
V1 > V3 only (p = 0.025 overall) |
|
Chord modulus (GPa) |
32.47 |
22.16 |
17.93 |
22.23 |
17.28 |
V1 > V2 ≈ V3 ≈ V4 ≈ V5 (p < 0.001) |
Taken together, and subject to the statistical qualifications established in Sections 3.3-3.5, the evidence supports 10% BA combined with 5% RM (V3) as the best-performing combined substitution level identified in this study for meeting the 50 MPa compressive-strength target while utilizing the maximum combined waste content (15% of cement mass) before mechanical performance deteriorates significantly; however, V3 does not show a statistically demonstrated compressive-strength advantage over the control, and it does show a significant tensile-strength penalty relative to the control. Any structural application of this mixture should therefore weigh the compressive-strength result against the tensile and stiffness trade-offs documented here, and should not describe the compressive result as a proven improvement over unmodified concrete.
3.7 Study limitations
Several limitations constrain the interpretive scope of this study and are consolidated here rather than left as isolated caveats. Characterization of the BA and RM materials used was limited to specific gravity and unit weight (Table 1); particle size distribution, particle morphology, and the pH and loss-on-ignition of these materials were not measured for the batches used, and the chemical compositions in Tables 3 and 4 are literature-derived rather than batch-specific XRF results (Section 2.2). This constrains the pozzolanic-filler mechanism proposed in Sections 3.3 and 3.6 to a hypothesis consistent with the observed mechanical trends rather than a microstructurally confirmed explanation, a constraint that also applies to the absence of SEM, XRD, and TGA of the hardened paste.
Because BA was held fixed at 10% while only RM content was varied, the experimental design isolates the marginal effect of RM against a constant bottom-ash background but cannot statistically confirm an interaction between the two materials; any synergy implied by the V3 result should be read as a hypothesis for future factorial testing rather than a demonstrated finding. The dataset further originates from a single undergraduate thesis conducted in one laboratory with n = 2–3 replicates per condition, limiting the statistical power to detect smaller effects, particularly for splitting tensile strength and the descriptively reported fresh-state indices (Section 3.1); two data-reconciliation discrepancies between the source thesis’s raw specimen data and its summary tables, affecting the 28-day compressive strength of V4 and the splitting tensile strength of V1, V2, and V5, should be resolved against the original laboratory records before submission (Sections 3.3-3.4).
Finally, the solid content and specific gravity of the superplasticizer and the capping compound and the thickness used before compressive and modulus testing are not recorded in the source data and should be obtained and reported by the author (Sections 2.2-2.3). None of these limitations undermines the mechanical performance results reported in Sections 3.2-3.5, which rest on directly measured, standardized test methods, but together they bound the strength of the mechanistic and generalization claims drawn from this study.
Based on the experimental results and the statistical analysis presented in this study, the following conclusions are drawn.
Unit weight was not significantly affected by BA and RM incorporation (one-way ANOVA, p = 0.157) and remained within the SNI 03-2847-2002 normal-weight range (2,200-2,500 kg/m³) across all variations (2,321.5-2,353.4 kg/m³), confirming that combined BA and RM substitution up to 25% of cement mass does not compromise the normal-weight classification of the concrete. Compressive strength at 28 days differed significantly among mixtures (one-way ANOVA, p < 0.001), but Tukey's HSD post-hoc test shows that the numerically highest value, recorded for V3 (10% BA + 5% RM, 53.69 ± 2.24 MPa), is not statistically distinguishable from the control (V1, 52.20 ± 1.68 MPa) or the bottom-ash-only mixture (V2, 52.84 ± 1.68 MPa); what is statistically established is that increasing RM content to 10% and 15% (V4, V5) produces a significant reduction in 28-day compressive strength relative to V1, V2, and V3, with both V4 (45.41 MPa) and V5 (42.87 MPa) falling below the 50 MPa design target. Splitting tensile strength and chord modulus of elasticity were both significantly reduced by BA and RM incorporation relative to the control (one-way ANOVA, p = 0.025 and p < 0.001, respectively); for splitting tensile strength, only the V1–V3 pairwise comparison reached significance in the Tukey post-hoc test, while for chord modulus, the control was significantly stiffer than all four modified mixtures, which did not differ significantly among themselves, so meeting or exceeding the 50 MPa compressive-strength target at V2 or V3 does not imply an equivalent tensile-strength or stiffness benefit, and these properties require independent verification when specifying BA and RM as combined SCMs in HSC. Within the limits of the tested dosages, V3 (10% BA + 5% RM) is identified as the best-performing composition for meeting the 50 MPa compressive-strength target while maximizing combined waste utilization (15% of cement mass), but this identification should be read as “best among the tested mixtures,” not as a proven, statistically significant improvement over the unmodified control, and not without accounting for its documented tensile and stiffness trade-offs. The mechanisms proposed to explain these trends-pozzolanic/filler contribution at low red-mud dosage and cement dilution at higher dosage-are hypotheses consistent with the measured mechanical data, and they are not confirmed by microstructural evidence (SEM, XRD, TGA) or by an actual XRF analysis of the RM used in this study, both of which are necessary before the underlying reaction mechanisms can be stated as established findings rather than plausible explanations. Finally, two data-reconciliation issues identified while cross-checking the source thesis's raw specimen-level data against its own summary tables-affecting the 28-day compressive strength of V4 and the splitting tensile strength of V1, V2, and V5-should be resolved against the original laboratory records before this manuscript is submitted; see Sections 3.3 and 3.4 for details.
[1] Song, X.S., Ma, X.H., Sun, H.Y., Xu, Z.M., Liu, K., Wang, S.J. (2026). Seismic performance and damage evolution of a two-story full-scale concrete superposed shear wall structure system. Journal of Building Engineering, 129: 116735. https://doi.org/10.1016/j.jobe.2026.116735
[2] Al Khalil, A.E. (2026). Assessment of the readiness of architectural design companies to adopt eco-friendly nanotechnologies in sustainable building design. Doctoral dissertation, Portland State University. https://www.proquest.com/openview/178fc7d2a62bb3f14210f32573619096/1?pq-origsite=gscholar&cbl=18750&diss=y.
[3] Nicoara, A.I., Stoica, A.E., Vrabec, M., et al. (2020). End-of-life materials used as supplementary cementitious materials in the concrete industry. Materials, 13(8): 1954. https://doi.org/10.3390/ma13081954
[4] Badan Standardisasi Nasional (BSN). (2000). SNI 03-6468-2000: Tata cara perencanaan campuran beton berkekuatan tinggi dengan semen portland dan abu terbang [Procedure for mix design of high-strength concrete with Portland cement and fly ash]. BSN, Jakarta, Indonesia. https://pesta.bsn.go.id/produk/detail/6047-sni03-6468-2000.
[5] Shah, S.N.R., Akashah, F.W., Shafigh, P. (2019). Performance of high strength concrete subjected to elevated temperatures: A review. Fire Technology, 55(5): 1571-1597. https://doi.org/10.1007/s10694-018-0791-2
[6] Ali, B., Fahad, M., Ullah, S., Ahmed, H., Alyousef, R., Deifalla, A. (2022). Development of ductile and durable high strength concrete (HSC) through interactive incorporation of coir waste and silica fume. Materials, 15(7): 2616. https://doi.org/10.3390/ma15072616
[7] Alshahrani, A. (2024). Towards sustainable construction: Experimental approach and multi-scale simulation in high-strength self-compacting concrete design. Doctoral dissertation, Cardiff University. https://orca.cardiff.ac.uk/id/eprint/170652.
[8] Hendrik, H., Arofah, N., Erusani, A.S., et al. (2026). Analysis and projection of bauxite extraction in Indonesia through system dynamics modeling. Circular Economy and Sustainability, 6(2): 56. https://doi.org/10.1007/s43615-026-00739-z
[9] Hakim, A.Y.A., Sunjaya, D., Hede, A.N.H., Indriati, T., Hidayat, T. (2023). Critical raw materials associated with the lateritic bauxite and red mud in West Kalimantan, Indonesia. Geochemistry: Exploration, Environment, Analysis, 23(3): geochem2022-064. https://doi.org/10.1144/geochem2022-064
[10] Damayanti, R., Khareunissa, H. (2016). Composition and characteristics of red mud: A case study on Tayan bauxite residue from alumina processing plant at West Kalimantan. Indonesian Mining Journal, 19(3): 179-190. https://doi.org/10.30556/imj.vol19.no3.2016.660
[11] Haryadi, H. (2016). Analysis of the value-added for Tayan bauxite ore and chemical grade alumina. Indonesian Mining Journal, 19(3): 167-178. https://doi.org/10.30556/imj.Vol19.No3.2016.631
[12] Hendrik, Fauzi, A., Suryaningtyas, D.T., Firdiyono, F. (2022). Qualitative data envelopment assessment of different alumina refinery plants: The case of bauxite mining in West Kalimantan Province. In 2nd International Seminar on Natural Resources and Environmental Management, Bogor, Indonesia, 950(1): 012018. https://doi.org/10.1088/1755-1315/950/1/012018
[13] Pal, D.B., Tiwari, A.K., Jana, S.K. (2024). Alumina industrial waste management of red mud: A review. International Journal of Mining and Mineral Engineering, 15(4): 396-415. https://doi.org/10.1504/IJMME.2024.142844
[14] Zaharah, T.A., Rossalina, W., Silalahi, I.H. (2021). Elemental composition and characterization of magnetic minerals in red mud, a bauxite residue at PT Indonesia Chemical Alumina (ICA), West Kalimantan. Indonesian Journal of Pure and Applied Chemistry, 4(3): 139-144. https://doi.org/10.26418/indonesian.v4i3.49660
[15] Wahyinto, I.R., Aritonang, A.B., Zaharah, T.A. (2022). Extraction and characterization of Fe2O3 from red mud PT. Indonesia Chemical Alumina West Kalimantan. Berkala Sainstek, 10(3): 155-161. https://doi.org/10.19184/bst.v10i3.30252
[16] Ekaputri, J.J., Wibowo, Y.G., Safitri, H., et al. (2026). Unlocking the circular economy potential of FABA in Indonesia: Challenges, opportunities, and implications. Circular Economy and Sustainability, 6(3): 279. https://doi.org/10.1007/s43615-026-01005-y
[17] Aygun, B.F., Bilir, T., Uysal, M. (2024). Coal bottom ash and its applications in cement and concrete technologies: A review. Discover Civil Engineering, 1(1): 86. https://doi.org/10.1007/s44290-024-00090-y
[18] Traoré, S., Diarra, A., Kourouma, O., Traoré, D.L. (2019). Survey of bauxite resources, alumina industry and the prospects of the production of geopolymer composites from the resulting by-product. In Geopolymers and Other Geosynthetics. https://doi.org/10.5772/intechopen.82413
[19] Burduhos-Nergis, D.D., Burduhos-Nergis, D.P., Baltatu, S.M., Vizureanu, P. (2022). Ceramics and composites: Preparation and applications. Materials Research Forum LLC. https://doi.org/10.21741/9781644901717
[20] Umar, T., Yousaf, M., Akbar, M., Abbas, N., Hussain, Z., Ansari, W.S. (2022). An experimental study on non-destructive evaluation of the mechanical characteristics of a sustainable concrete incorporating industrial waste. Materials, 15(20): 7346. https://doi.org/10.3390/ma15207346
[21] Venkatesh, C., Durga, C.S.S., Sujatha, T., Bellum, R.R., Chaitanya, B.K., Meharie, M.G. (2025). Microstructural evolution and mechanical property enhancement of red mud incorporated high strength concrete. Scientific Reports, 15(1): 26794. https://doi.org/10.1038/s41598-025-05596-8
[22] Alosta, M., Mamdouh, A., Al Mufargi, H., et al. (2024). Properties and microstructure of treated coal bottom ash as cement concrete replacement. Civil Engineering Journal, 10(4): 1125-1144. https://doi.org/10.28991/CEJ-2024-010-04-08
[23] Dewi, S.U., Prasetyo, F. (2021). Analysis of the addition of bottom ash on the compressive strength and splitting tensile strength of concrete. Journal of Infrastructural in Civil Engineering, 2(2): 31-45. https://doi.org/10.33365/jice.v2i02.1307
[24] Badan Standardisasi Nasional (BSN). (1991). SNI 15-2531-1991: Metode pengujian berat jenis semen portland [Test method for specific gravity of Portland cement]. BSN, Jakarta, Indonesia.
[25] Badan Standardisasi Nasional (BSN). (2004). SNI 15-2049-2004: Semen portland [Portland cement]. BSN, Jakarta, Indonesia.
[26] Badan Standardisasi Nasional (BSN). (2008). SNI 1970:2008: Cara uji berat jenis dan penyerapan air agregat halus [Test method for specific gravity and water absorption of fine aggregate]. BSN, Jakarta, Indonesia.
[27] Badan Standardisasi Nasional (BSN). (1989). SNI S-04-1989-F: Spesifikasi bahan bangunan bagian A (bahan bangunan bukan logam) [Specification of building materials, part A (non-metallic building materials)]. BSN, Jakarta, Indonesia.
[28] Badan Standardisasi Nasional (BSN). (2000). SNI 03-2834-2000: Tata cara pembuatan rencana campuran beton normal [Procedure for normal concrete mix design]. BSN, Jakarta, Indonesia.
[29] Departemen Pekerjaan Umum. (1990). SK SNI T-15-1990-03: Tata cara pembuatan rencana campuran beton normal [Procedure for normal concrete mix design]. Yayasan LPMB, Bandung, Indonesia.
[30] Departemen Pekerjaan Umum dan Tenaga Listrik. (1971). Peraturan Beton Bertulang Indonesia 1971 (PBI 1971) N.I.-2 [Indonesian reinforced concrete regulation 1971]. Bandung, Indonesia.
[31] Badan Standardisasi Nasional. (BSN) (2008). SNI 2417:2008: Cara uji keausan agregat dengan mesin abrasi Los Angeles [Test method for abrasion of aggregate using the Los Angeles abrasion machine]. BSN, Jakarta, Indonesia.
[32] ASTM International. ASTM C1437-07: Standard Test Method for Flow of Hydraulic Cement Mortar. ASTM International, West Conshohocken, PA, USA.
[33] Badan Standardisasi Nasional (BSN). (2008). SNI 1972:2008: Cara uji slump beton [Test method for concrete slump]. BSN, Jakarta, Indonesia.
[34] ASTM International. ASTM C1611/C1611M: Standard Test Method for Slump Flow of Self-Consolidating Concrete. ASTM International, West Conshohocken, PA, USA.
[35] ASTM International. ASTM C138/C138M: Standard Test Method for Density (Unit Weight), Yield, and Air Content (Gravimetric) of Concrete. ASTM International, West Conshohocken, PA, USA.
[36] Badan Standardisasi Nasional. (BSN). (2002). SNI 03-2847-2002: Tata cara perhitungan struktur beton untuk bangunan gedung [Procedure for structural concrete design of buildings]. BSN, Jakarta, Indonesia.
[37] Badan Standardisasi Nasional. (BSN) (2011). SNI 1974:2011: Cara uji kuat tekan beton dengan benda uji silinder [Test method for compressive strength of concrete using cylindrical specimens]. BSN, Jakarta, Indonesia.
[38] ASTM International. ASTM C39/C39M: Standard Test Method for Compressive Strength of Cylindrical Concrete Specimens. ASTM International, West Conshohocken, PA, USA.
[39] Badan Standardisasi Nasional (BSN). (2002). SNI 03-2491-2002: Metode pengujian kuat tarik belah beton [Test method for splitting tensile strength of concrete]. BSN, Jakarta, Indonesia.
[40] ASTM International. ASTM C496/C496M: Standard Test Method for Splitting Tensile Strength of Cylindrical Concrete Specimens. ASTM International, West Conshohocken, PA, USA.
[41] ACI Committee 318. (1999). Building Code Requirements for Structural Concrete (ACI 318-99) and Commentary (ACI 318R-99). American Concrete Institute, Farmington Hills, MI, USA.
[42] Badan Standardisasi Nasional (BSN). (1996). SNI 03-4169-1996: Metode pengujian modulus elastisitas statis dan rasio Poisson beton dengan kompresometer [Test method for static modulus of elasticity and Poisson's ratio of concrete using a compressometer]. BSN, Jakarta, Indonesia.
[43] ASTM International. ASTM C469/C469M: Standard Test Method for Static Modulus of Elasticity and Poisson's Ratio of Concrete in Compression. ASTM International, West Conshohocken, PA, USA.
[44] ACI Committee 363. (1992). State-of-the-Art Report on High-Strength Concrete (ACI 363R-92). American Concrete Institute, Farmington Hills, MI, USA.