Modelling Wear Behavior of AA5052/TiO2 Nanocomposite Using Response Surface Methodology

Suad H. Abbas Raubye
© 2026 The author. This article is published by IIETA and is licensed under the CC BY 4.0 license (http://creativecommons.org/licenses/by/4.0/).
OPEN ACCESS
AA5052 aluminum alloy is widely used in industry due to its favorable properties; however, its limited wear resistance remains a significant research gap in high-performance tribological applications. This study developed an AA5052/TiO2 nanocomposite to enhance wear resistance using the stir casting method with reinforcement fractions of 0, 2, 4, 6, and 8 wt.%. Furthermore, a predictive model for wear behavior was established. The weight percentage of TiO2, rotational speed, and applied load were considered as input variables, while the wear rate was taken as the output response. Wear data were obtained using a pin-on-disc test, and response surface methodology (RSM) based on a central composite design (CCD) was applied. The statistical result, including a p-value < 0.0001 and an F-value of 42.77, indicates the model is statistically significant. The model showed strong predictive capability with a small difference between adjusted R2 (0.9519) and predicted R2 (0.8825). Analysis of variance (ANOVA) identified TiO₂ content as the dominant factor (F-value = 238.05). Increasing the TiO₂ improved wear resistance, reducing the wear rate by 47.7% at a 20 N load and 1000 r.p.m, and by approximately 60% at 4 N. Microstructural analysis revealed a uniform dispersion with slight agglomeration at 8 wt.%. These findings indicate a transition wear behavior from severe plastic deformation to a moderate regime with the addition of TiO2 nanoparticles. The model can be used to predict and optimize performance.
metal matrix nanocomposite, AA5052 aluminum alloy, TiO2 nanoparticles, response surface methodology, stir casting, dry sliding wear
Metal matrix nanocomposites have become more important in materials science due to their ability to satisfy specific application requirements. Compared to other metals, aluminum-based composites have attracted considerable attention as matrix materials because of their properties like low density, high strength–to-weight ratio, and good corrosion resistance. Among these properties, AA5052 alloy is widely used in marine applications because it provides a balance of medium strength and excellent weldability [1-6]. Despite these advantages, aluminum alloys still show limited mechanical properties, specifically wear resistance. To address these limitations, researchers frequently incorporate ceramic reinforcements like Al2O3, SiC, fly ash, B4C, graphite and ZrB2 into the metal matrix. Among these, TiO2 particles have emerged as a superior choice for aluminum matrix composites. This is due to their ability to provide exceptional hardness and excellent chemical and thermal stability [7-12].
Several processing methods are used to prepare aluminum matrix nanocomposites (AMC), including powder metallurgy, mechanical alloying, high-energy ball milling, stir casting, nano-sintering, and spray techniques. Among these, stir casting is particularly favored because it is simple, flexible, and economical, making it ideal for mass production and a cost-effective way to evenly disperse nanoparticles in liquid aluminum. Effectively preventing them from agglomeration [13-16].
Previous studies have shown that adding hard ceramic reinforcements to AA5052 can significantly enhance its tribological behavior. For example, the study on AA5052 reinforced with tungsten carbide (WC) has shown that using 5 wt.% reinforcement leads to a reduction in both the coefficient of friction and the specific wear rate when suitable processing conditions are selected using Taguchi experimental approaches [17]. In a similar direction, research on AA5052 reinforced with titanium carbide (TiC) has reported an improvement in wear resistance at reinforcement content between 5 and 9 wt.%. By applying response surface methodology (RSM) and fuzzy logic to evaluate the influence of wear parameters, these studies confirmed that increasing the reinforcement content significantly reduces volumetric wear loss while keeping the coefficient of friction relatively stable [18, 19]. Other studies on AA5052 reinforced with 5 wt.% SiC or B4C using the stir casting method confirmed that these reinforcements provide good abrasive wear resistance [20, 21]. Furthermore, AA5052 reinforced with TiB2 (0-7.5 wt.%) revealed that the addition of 5 wt.% TiB2 provided optimum wear resistance, showing a maximum improvement of 36% under high load and speed conditions [7]. Additional study has examined hybrid reinforcements and shown that the combined addition of Al2O3 and ZrO2 further enhances wear performance by applying the Taguchi-Grey relational approach [13]. With respect to TiO2 reinforcement, a study on AA7075-based composites has shown that adding 10 wt.% nano TiO2 particles reduces material loss during dry sliding conditions [8]. Additionally, an investigation of AA2024 composite reinforced with TiO2 nanoparticles revealed that 5 wt.% TiO2 content offers an optimal balance of properties leading to a 22% improvement in wear resistance after suitable heat treatment [22].
In this study, the sliding wear behavior of AA5052/TiO2 nanocomposite is modeled using RSM. Although AA5052 has been extensively reinforced with ceramics such as WC, TiC and TiB2, limited attention has been given to reinforcement with TiO2 nanoparticles, particularly in terms of predictive modeling. To address this gap, composites containing 0, 2, 4, 6, and 8 wt.% TiO2 were investigated. Data required for model development were generated using a central composite design (CCD), enabling an evaluation of the influence of key input parameters on sliding wear performance.
2.1 Materials
The matrix material utilized was the 5052 aluminum alloy, with its chemical composition shown in Table 1. Titanium dioxide (TiO2) nanoparticles, with an average particle size of 40 nm, were selected as the ceramic reinforcement. They were incorporated at various weight percentages of 0, 2, 4, 6, and 8 wt.%.
Table 1. Elemental composition of aluminum alloy 5052 [23]
|
Elements |
Weight, % |
|
Mg |
2.2-2.8 |
|
Si |
0.25 |
|
Cr |
0.15-0.35 |
|
Fe |
0.4 |
|
Cu |
0.1 |
|
Mn |
0.1 |
|
Zn |
0.1 |
|
Others |
0.15 |
|
Al |
Balance |
2.2 Nanocomposite specimen preparation
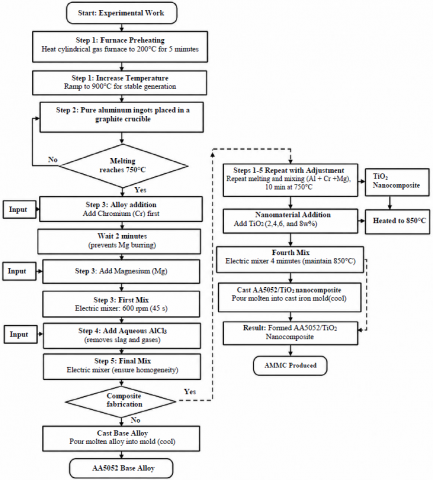
Aluminum matrix nanocomposites (AA5052/TiO2) were produced using a stir casting process. Figure 1 shows the flowchart of the process steps. To achieve stable thermal conditions, a cylindrical gas furnace was first preheated to 200 ℃ for five minutes, after which the temperature was gradually increased to a maximum of 900 ℃. Pure aluminum ingots were placed in a graphite crucible and melted at 750 ℃. Once fully molten and stable conditions were achieved, alloying elements were introduced through the top charging opening of the furnace. Chromium was added first, followed by magnesium after two minutes to minimize magnesium oxidation and burn-off. The molten alloy was then mechanically stirred at 600 r.p.m. for 45 seconds to ensure uniform elemental distribution. To enhance melt quality, 1 g of aqueous AlCl3 was added to remove the slag and expel gases from the resulting mixture.
Subsequently, for composite fabrication, the melt temperature was increased and maintained at 850 ℃ for the addition of TiO2 nanoparticles at weights of 2, 4, 6, and 8%. This step was necessary to compensate for the chilling effect induced by the nanoparticles and to reduce melt viscosity, thereby improving particle dispersion. After holding the temperature for 10 minutes, the TiO2 particles were gradually introduced, and the slurry was mechanically stirred for an additional 4 minutes to minimize particle agglomeration. Finally, the composite melt was gravity-cast into a preheated cast iron mold to prevent thermal shock and reduce porosity. The cast samples were allowed to solidify under ambient conditions.
Figure 1. Flowchart for the stir casting process steps
2.3 Wear test
The wear behavior of the A5052/TiO₂ metal matrix composites was evaluated using a Vertical Universal Friction and Wear Testing Machine (BEIJING UNITED TEST CO., LTD) in accordance with ASTM G99-17 [24]. The pin dimensions were 12.7 mm in length and 4.8 mm in diameter; the material of the disk was carbon steel with an average Vickers hardness of 275 HV. Experiments were performed under varying loads (4, 8, 12, 16 and 20 N), rotational speeds (200, 400, 600, 800 and 1000 r.p.m.), and TiO₂ reinforcement percentages (0, 2, 4, 6 and 8 wt.%) with a constant test duration of 10 minutes for each run. The parameters were controlled through a computer interface, which also recorded the input values and wear data. The wear rate (Wr) was calculated using the equation below:
Wear Rate (Wr) =∆W / S.D
where, ΔW = (W₁ – W₂) is the weight loss of the specimen, and S.D is the sliding distance given by $S . D=2 \pi * r * n * t$ with r = disk radius (cm), n = rotational speed (r.p.m.), and t = sliding time (min).
2.4 Experimental design
The primary goal of this research is to develop a predictive model that quantifies the influence of sliding wear parameters on the resulting wear rate in fabricated AA5052/TiO2 composites. To analyze the complex wear behavior, a statistical approach rooted in RSM was employed, utilizing the Design-Expert 13 software package. RSM is an effective tool that integrates the fundamentals of experimental design with regression modeling and optimization to identify suitable empirical models and check their adequacy. It provides an approximate mathematical relationship between the independent input factors and the dependent output responses, allowing for the identification of influential parameters as well as their interaction effects. A three-factor, five-level CCD was selected, as it is highly effective within RSM for developing a second-order (quadratic) model of the response variable while minimizing the necessary number of experimental runs. The variables investigated included applied load, rotational speed, and the weight percentage of TiO2 as the input factors, while the wear rate was measured as the primary output response. The specific levels used for the input parameters are provided in Table 2. The 20 sets of experimental points resulting from the CCD are presented in Table 3, which includes 8 factorial points, 6 axial points, and 6 center-point replicates (n = 6). These center points were utilized to explicitly account for experimental error and to ensure the reproducibility of the experimental measurements. The variability among these replicates is presented as the standard deviation (SD) in the subsequent analysis, providing a basis for evaluating the adequacy of the predictive model.
Table 2. Process parameters and their levels
|
Parameters |
Levels |
||||
|
-2 |
-1 |
0 |
2 |
1 |
|
|
Load |
4 |
8 |
12 |
16 |
20 |
|
Rotation speed |
200 |
400 |
600 |
800 |
1000 |
|
TiO2 |
0 |
2 |
4 |
6 |
8 |
Table 3. Experimental design matrix and the results
|
Run |
RS |
L |
wt |
Actual Value (Wr) |
Predicted Value (Wr) |
|
r.p.m. |
N |
% |
g/m |
g/m |
|
|
1 |
800 |
8 |
2 |
5.10618 × 10⁻⁶ |
5.143 × 10⁻⁶ |
|
2* |
600 |
12 |
4 |
3.11477 × 10⁻⁶ |
2.708 × 10⁻⁶ |
|
3* |
600 |
12 |
4 |
2.25589 × 10⁻⁶ |
2.708 × 10⁻⁶ |
|
4* |
600 |
12 |
4 |
3.0133 × 10⁻⁶ |
2.708 × 10⁻⁶ |
|
5 |
600 |
4 |
4 |
2.83682 × 10⁻⁶ |
2.911 × 10⁻⁶ |
|
6 |
800 |
16 |
2 |
6.48741 × 10⁻⁶ |
6.289 × 10⁻⁶ |
|
7* |
600 |
12 |
4 |
2.45376 × 10⁻⁶ |
2.708 × 10⁻⁶ |
|
8 |
600 |
12 |
8 |
1.81706 × 10⁻⁶ |
1.965 × 10⁻⁶ |
|
9 |
400 |
16 |
6 |
2.24445 × 10⁻⁶ |
1.883 × 10⁻⁶ |
|
10* |
600 |
12 |
4 |
2.67487 × 10⁻⁶ |
2.708 × 10⁻⁶ |
|
11 |
400 |
16 |
2 |
4.7046 × 10⁻⁶ |
4.477 × 10⁻⁶ |
|
12 |
400 |
8 |
6 |
1.68916 × 10⁻⁶ |
1.563 × 10⁻⁶ |
|
13 |
800 |
8 |
6 |
2.52426 × 10⁻⁶ |
2.428 × 10⁻⁶ |
|
14 |
800 |
16 |
6 |
3.88551 × 10⁻⁶ |
3.848 × 10⁻⁶ |
|
15 |
600 |
20 |
4 |
4.12694 × 10⁻⁶ |
4.377 × 10⁻⁶ |
|
16 |
400 |
8 |
2 |
4.71874 × 10⁻⁶ |
4.432 × 10⁻⁶ |
|
17 |
200 |
12 |
4 |
2.38135 × 10⁻⁶ |
2.720 × 10⁻⁶ |
|
18 |
1000 |
12 |
4 |
5.41198 × 10⁻⁶ |
5.397 × 10⁻⁶ |
|
19* |
600 |
12 |
4 |
2.41396 × 10⁻⁶ |
2.708 × 10⁻⁶ |
|
20 |
600 |
12 |
0 |
7.09857 × 10⁻⁶ |
7.275 × 10⁻⁶ |
3.1 Microstructural investigations
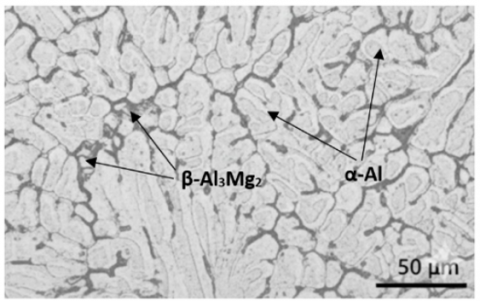
The initial microstructure of the investigated AA5052 alloy is consistent with the Al-Mg binary system, manifesting a dual-phase morphology. This microstructure consists of a primary α-Al matrix with magnesium in solid solution, supplemented by secondary β-phase (Al3Mg2) precipitates. As illustrated in Figure 2, these β particles are preferentially localized along the grain boundaries.
Figure 2. Optical microstructure of the AA5052 alloy
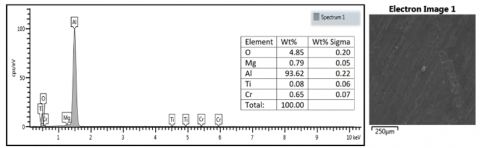
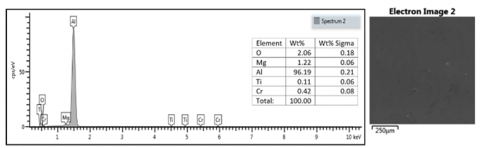
Figures 3(a) and (b) illustrate the energy dispersive X-ray spectroscopy (EDS) analysis for the AA5052/TiO2 nanocomposites at 4 wt.% and 8 wt.% fractions, respectively. The presence of TiO2 nanoparticles within the aluminum matrix is confirmed by the distinct peaks of titanium (Ti) and oxygen (O) alongside the base alloy elements. For the 4 wt.% sample, the weight percentages of Ti remain relatively low, indicating a modest but uniform distribution. As the reinforcement content increases to 8 wt.%, a corresponding increase in the titanium peak intensity is observed.
Figure 3. Energy dispersive X-ray spectroscopy (EDS) of the AA5052/TiO2 nanocomposite
Figure 4. Scanning electron microscopy (SEM) of the 8 wt.% TiO2 nanocomposite
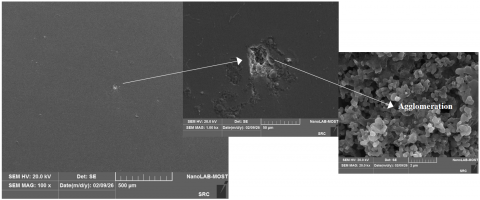
The scanning electron microscopy (SEM) micrograph investigation of the 8 wt.% TiO2 sample (Figure 4) reveals a localized area of agglomeration. However, this agglomeration does not cause failure in the composite, as the sample is free of cracks and capable of withstanding various loads. Agglomeration of reinforcement particulates, during the fabrication of stir casting nanocomposites, can occur due to the high surface energy of the nanoparticles, which leads them to cluster together to reduce their overall surface energy. Additionally, the presence of impurities or contaminants can promote agglomeration by providing nucleation sites for particles to cluster.
3.2 Statistical analysis of wear data
Mathematical models, specifically non-linear regression equations, were developed to predict the responses based on the measured wear parameters. The non-linear regression equations for the wear rate are given below.
$\begin{aligned} & W r=0.000012-1.12 \times 10^{-8} \cdot R S-4.99 \times 10^{-7} \cdot L \\ &-1.77 \times 10^{-6} \cdot w t+3.43 \times 10^{-10} \cdot R S \cdot L \\ &+9.55 \times 10^{-11} \cdot R S \cdot w t \\ &+8.58 \times 10^{-9} \cdot L \cdot w t+8.43 \times 10^{-12} \cdot R S^2 \\ &+1.46 \times 10^{-8} \cdot L^2+1.19 \times 10^{-7} \cdot w t^2\end{aligned}$
The sign of a variable's coefficient determines its impact on wear; a positive coefficient indicates that increasing that variable increases the sliding wear of the composite material. while a negative coefficient indicates that increasing the variable reduces wear loss. Furthermore, the numerical magnitude of each coefficient reveals its relative influence or weight on the overall wear outcome. Although the regression equation provides a mathematical fit, it also reflects how the composite material responds to different operating conditions. The large negative coefficient for TiO2 content shows that increasing the amount of reinforcement leads to a significant reduction in the wear rate. In physical terms, TiO₂ ceramic particles behave as a protective phase within the softer matrix. These hard particles strengthen the surface and help resist penetration and abrasion during sliding contact. As a result, the resistance to material removal increases, which explains the noticeable decrease in the wear rate as the TiO₂ content increases. This behavior identifies TiO2 content as the dominant factor in the system. In contrast, the positive coefficients for rotational speed and applied load indicate that increasing these parameters leads to an increase in wear rate. This response is related to the frictional heat generated during the sliding process. Higher rotational speeds and applied loads raise the interface temperature, resulting in matrix softening and a higher wear rate. This behavior is mainly related to the generation of frictional heat during sliding. Higher rotational speeds and greater loads intensify the contact conditions at the interface, which can lead to thermal softening of the matrix and make the material more susceptible to material removal. The applied load has the least effect compared with the other parameters because its coefficient is the smallest. The TiO₂ particles help to uniformly distribute the applied stress within the composite, thereby minimizing the direct effect of the load.
The design of experiments (DoE) model’s accuracy was evaluated using analysis of variance (ANOVA) with a significance level α of 0.05. Table 4 summarizes the ANOVA results. According to the analysis, with a p-value < 0.0001 and an F-value of 42.77, the model is statistically significant. This indicates that the variation in the response is not due to random noise. The statistical significance of each term was determined by comparing its p-value with the significance level α. A p-value ≤0.05 indicates that the corresponding term is statistically significant. In this model, the terms RS, L, and wt.% are highly significant statistically. The wt.% factor has the highest F-value (238.05), showing it is the most influential variable. This is followed by the rotational speed (RS) with an F-value of 60.52, while the applied load (L) also has a significant effect but with a lower relative influence, reflected by an F-value of 18.15. Also, the terms RS2, L2, wt2 and RS. L are statistically significant, while RS.wt and L.wt are not significant. Additionally, the SD for each run is within acceptable upper and lower limits.
Table 4. Results of analysis of variance (ANOVA) for wear test
|
Source |
Sum of Squares |
Degree of Freedom |
Mean Square |
F-Value |
P-Value |
|
Model |
4.55 × 10⁻¹¹ |
9 |
5.06 × 10⁻¹² |
42.77 |
<0.0001 |
|
RS |
7.16 × 10⁻¹² |
1 |
7.16 × 10⁻¹² |
60.52 |
<0.0001 |
|
L |
2.14 × 10⁻¹² |
1 |
2.14 × 10⁻¹² |
18.15 |
0.0017 |
|
wt |
2.81 × 10⁻¹¹ |
1 |
2.81 × 10⁻¹¹ |
238.0 |
<0.0001 |
|
RS. L |
6.05 × 10⁻¹³ |
1 |
6.05 × 10⁻¹³ |
5.12 |
0.0472 |
|
RS. wt |
1.17 × 10⁻¹⁴ |
1 |
1.17 × 10⁻¹⁴ |
0.098 |
0.7597 |
|
L. wt |
3.77 × 10⁻¹⁴ |
1 |
3.77 × 10⁻¹⁴ |
0.318 |
0.5848 |
|
RS² |
2.86 × 10⁻¹² |
1 |
2.86 × 10⁻¹² |
24.20 |
0.0006 |
|
L² |
1.37 × 10⁻¹² |
1 |
1.37 × 10⁻¹² |
11.62 |
0.0067 |
|
wt² |
5.74 × 10⁻¹² |
1 |
5.74 × 10⁻¹² |
48.49 |
<0.0001 |
|
Residual |
1.18 × 10⁻¹² |
10 |
1.18 × 10⁻¹³ |
|
|
Figure 5. Standard deviation analysis of externally studentized residuals versus run number
Table 5. Coefficient of determination values for the wear rate model
|
R² |
Adjusted R² |
Predicted R² |
Adequacy Precision |
|
0.9747 |
0.9519 |
0.8825 |
23.4734 |
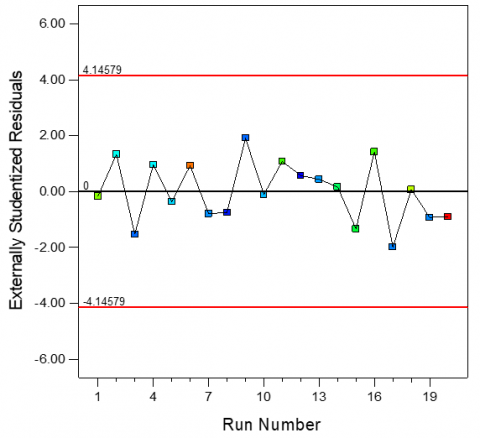
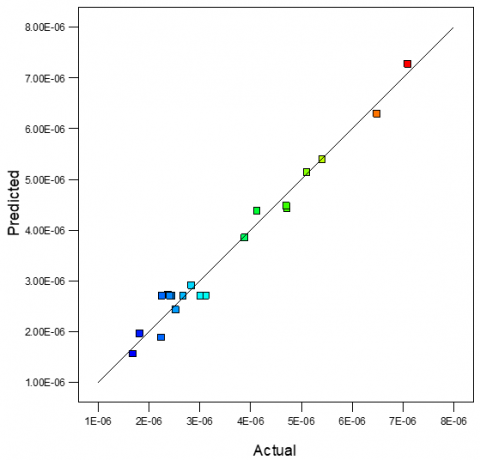
As shown in Figure 5, the model’s predictions align well with the observed SD. Furthermore, the coefficient of determination R2 of 0.9747 (Table 5) is very close to 1, indicating a high degree of fit between the experimental data and the model. The model shows strong predictive capability because the difference between the adjusted R2 (0.9519) and the predicted R2 (0.8825) is less than 0.2. Figure 6 shows a 98% agreement between the predicted and actual values. In addition, the model’s signal-to-noise ratio is 23.4734, which is well above the minimum required value of 4.
Figure 6. Scatter diagram illustrating the distribution of wear rate data
3.3 The influence of processing parameters on wear rate
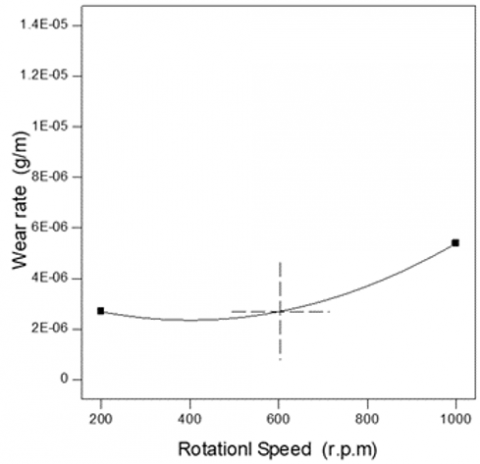
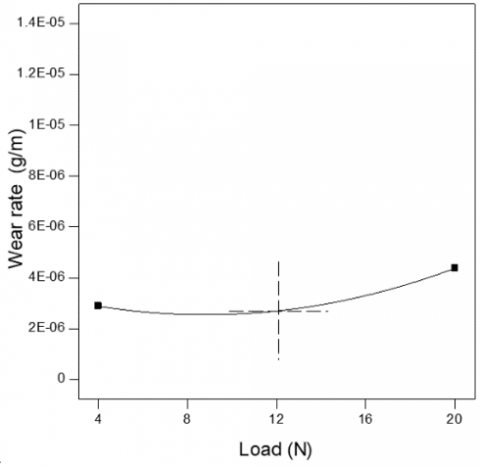
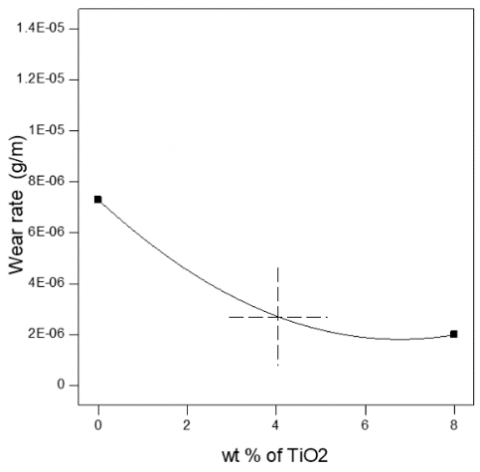
The wear behavior of the AA5052/TiO₂ composite was evaluated and compared with that of unreinforced AA5052. The assessment was conducted under the conditions listed in Table 3, using RSM to identify the parameters controlling the wear rate. Figure 7 presents the one-factor response curves, illustrating the individual impact of each parameter. The curve for TiO₂ content exhibits a clear negative slope, indicating that increasing the reinforcement significantly reduces the wear rate. This decrease is not only related to the increase in bulk hardness but also to the underlying strengthening mechanisms. When TiO₂ nanoparticles are uniformly distributed as observed in Figure 3, they act as physical barriers to dislocation movement, thereby restricting plastic deformation at the sliding surface. Mechanistically, this limits the depth of asperity penetration from the counterface, ultimately enhancing the composite's wear resistance. A critical observation from the microstructural analysis in Figure 4 is the presence of some TiO₂ particle agglomeration at 8 wt.%. This clustering did not increase the wear rate; this is due to the strong bonding between these clusters and the matrix, which prevents them from being pulled out and acting as third-body abrasives. In addition, the nanoparticles still provide a uniform distribution, which facilitates strengthening and load transfer. As a result of the high model accuracy confirmed in Figure 6, quantitative results demonstrate a dramatic improvement in wear resistance as the TiO₂ content increases. At the maximum applied conditions (20 N load and 1000 r.p.m.), the wear rate decreased from 8.42 × 10⁻⁶ g/m for the base AA5052 alloy to 4.40 × 10⁻⁶ g/m for the 8 wt.% TiO2 nanocomposite, marking a total reduction of 47.7%. Notably, even at a lower load of 4 N, the wear rate decreased from 8.75 × 10⁻⁶ g/m for the base AA5052 alloy to 3.46 × 10⁻⁶ g/m for the 8 wt.% TiO2 nanocomposite, achieving a reduction of approximately 60% compared to the unreinforced alloy. This confirms that the TiO₂ nanoparticles effectively transform the wear mechanism from severe plastic deformation to mild wear by acting as load-bearing elements. The reinforcement content of TiO2 is identified as the most significant factor impacting the wear rate. This quantitative improvement is mathematically represented by the large negative coefficient of the wt.% term (−1.764 × 10⁻⁶) in the regression equation, which confirms that the addition of TiO₂ particles is the primary driver for enhancing the surface durability of the AA5052 matrix.
Figure 7. Main effects of rotational speed, load, and TiO₂ reinforcement on the wear rate
In contrast, both rotational speed and applied load exhibit a positive correlation with the wear rate, in which higher values lead to increased material loss. This behavior occurs due to an increase in the real contact area, which intensifies plastic deformation at the sliding interface. The contact stresses between surfaces become higher when the applied load rises, increasing plastic deformation of the matrix, which accelerates material removal. The applied load (L) shows a direct positive correlation with the wear rate. Quantitative analysis indicates that increasing the load from 4 N to 20 N results in an average increase in material loss of approximately 28-32% for the base alloy. According to the regression model, the load possesses a significant positive coefficient (+5.167 × 10⁻⁷), which mathematically confirms that higher mechanical pressure intensifies the wear process. However, this increase is notably less severe in the 8 wt.% TiO₂ composite, where the wear rate only increases by 12% under the same load transition, demonstrating the reinforcement's ability to withstand the applied pressure and protect the matrix.
Figure 8. 3D surface plots of the wear rate as a function of process parameters
Similarly, increasing the rotational speed raises the frictional energy generation and interface temperature, leading to thermal softening of the aluminum matrix, reducing its resistance to deformation and increasing wear. Furthermore, the sensitivity to the applied load is lower than that of the rotational speed, demonstrating that the wear rate is influenced more strongly by rotational speed. Quantitative analysis of the rotational speed impact shows a consistent positive correlation with material loss. For the unreinforced AA5052 alloy, the wear rate increases by approximately 18-22% as the speed increases from 200 to 1000 r.p.m., while the wear rate increases from 2.38 × 10⁻⁶ g/m to 5.41 × 10⁻⁶. This sharp acceleration is due to enhanced thermal softening of the matrix. However, the interaction effect (RS. L) indicates that the presence of TiO₂ successfully moderates this thermal degradation, maintaining surface integrity even at high velocities.
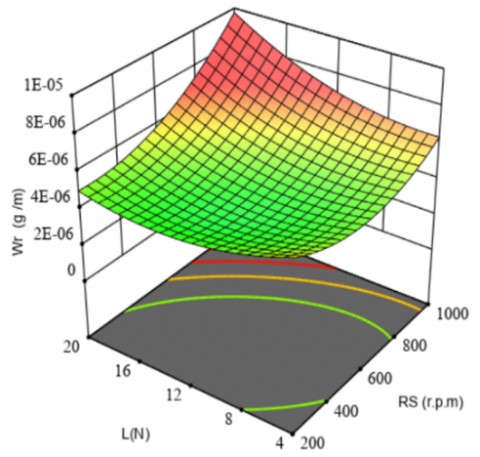
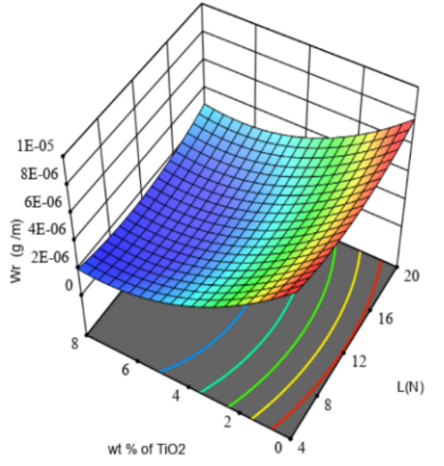
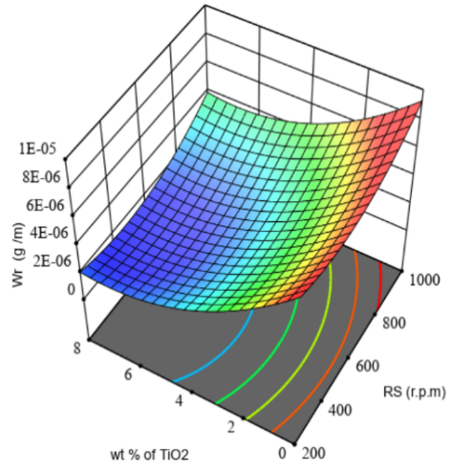
3D response surface plots provided in Figure 8 show the interaction effects of rotational speed, applied load, and TiO₂ content on the wear rate of the composite. In Figure 8(a), which represents the surface where rotational speed is combined with load, the wear rate accelerates significantly when both parameters increase simultaneously. This behavior is expected because higher speed adds more frictional energy, while higher load increases the real contact area, and the combined effect produces more severe surface damage. Figure 8(b), displaying rotational speed against TiO₂ content, shows that the surface bends downward as the amount of TiO₂ increases. Even when the rotational speed is high, adding more TiO₂ keeps the wear rate from rising as sharply. This interaction is consistent with the recorded 60% reduction in wear rate at controlled intensities, demonstrating that TiO₂ improves the composite’s resistance to thermal softening and plastic deformation, thereby moderating the wear rate even under more aggressive operating conditions. Figure 8(c) illustrates the interaction between applied load and TiO₂ percentage. Similar to the previous case, the wear rate decreases as the TiO₂ content increases, even under higher loading conditions. The steep downward slope toward the 8 wt.% TiO₂ region visually validates the 47.7% reduction observed at 20 N, confirming that the reinforcement has a dominant influence on the wear response. From a mechanistic perspective, the hard TiO₂ particles act as load-bearing elements that reduce the direct contact between the aluminum matrix and the counterface. In addition, the improved microstructural strengthening caused by the dispersion of nanoparticles limits plastic deformation and micro-ploughing during sliding. Overall, the response surface analysis shows that the wear behavior of the composite is controlled by the interaction between operational parameters and microstructural strengthening.
In this research, AA5052/TiO2 nanocomposites were fabricated using the stir-casting method. The Pin-on-Disc test was employed to determine the wear rate. Furthermore, RSM was utilized to model the wear behavior. Based on these fabrication, testing, and modeling efforts, the following conclusions are found in this study:
[1] Samal, P., Vundavilli, P.R., Meher, A., Mahapatra, M.M. (2020). Recent progress in aluminum metal matrix composites: A review on processing, mechanical and wear properties. Journal of Manufacturing Processes, 59: 131-152. https://doi.org/10.1016/j.jmapro.2020.09.010
[2] Arulraj, M., Palani, P., Sowrirajan, M. (2021). Optimization of squeeze casting parameters of hybrid aluminium matrix composite using Taguchi approach. Proceedings of the Institution of Mechanical Engineers, Part E: Journal of Process Mechanical Engineering, 235(4): 1073-1081. https://doi.org/10.1177/0954408921989864
[3] Ibrahim, F.A., Kadhim, Z.D., Abdulrazzaq, M.A., Aydi, A. (2025). Effect of Al₂O₃ particle size on mechanical properties of Al-12%Si alloy via taguchi method. Revue des Composites et des Matériaux Avancés-Journal of Composite and Advanced Materials, 35(4): 601-608. https://doi.org/10.18280/rcma.350401
[4] Khodabakhshi, F., Simchi, A., Kokabi, A.H., Sadeghahmadi, M., Gerlich, A.P. (2015). Reactive friction stir processing of AA 5052–TiO2 nanocomposite: Process–microstructure–mechanical characteristics. Materials Science and Technology, 31(4): 426-435. https://doi.org/10.1179/1743284714y.0000000573
[5] Singh, A.K., Soni, S., Rana, R.S. (2020). A critical review on synthesis of aluminum metallic composites through stir casting: Challenges and opportunities. Advanced Engineering Materials, 22(10): 2000322. https://doi.org/10.1002/adem.202000322
[6] Miladinović, S., Gajević, S., Savić, S., Miletić, I., Stojanović, B., Vencl, A. (2024). Tribological behaviour of hypereutectic Al-Si composites: A multi-response optimisation approach with ANN and Taguchi grey method. Lubricants, 12(2): 61. https://doi.org/10.3390/lubricants12020061
[7] Farooq, S.A., Mukhtar, S.H., Raina, A., Haq, M.I.U., Siddiqui, I.H., Naveed, N., Dobrota, D. (2024). Effect of TiB2 on the mechanical and tribological properties of marine grade Aluminum Alloy 5052: An experimental investigation. Journal of Materials Research and Technology, 29: 3749-3758. https://doi.org/10.1016/j.jmrt.2024.02.106
[8] Nagaral, M., Auradi, V., A Kori, S., Shivaprasad, V. (2020). Mechanical characterization and wear behavior of nano TiO2 particulates reinforced Al7075 alloy composites. Mechanics of Advanced Composite Structures, 7(1): 71-78. https://doi.org/10.22075/macs.2019.17075.1194
[9] Balaji, S., Maniarasan, P., Alagarsamy, S.V., Alswieleh, A.M., Mohanavel, V., Ravichandran, M., Jeon, B., Allasi, H.L. (2022). Optimization and prediction of tribological behaviour of Al-Fe-Si alloy-based nanograin-refined composites using taguchi with response surface methodology. Journal of Nanomaterials, 2022(1): 9733264. https://doi.org/10.1155/2022/9733264
[10] Baradeswaran, A., Elayaperumal, A., Issac, R.F. (2013). A statistical analysis of optimization of wear behaviour of Al- Al2O3 composites using taguchi technique. Procedia Engineering, 64: 973-982. https://doi.org/10.1016/j.proeng.2013.09.174
[11] Surendrana, R., Kumaravelb, A. (2023). Optimization of wear properties on LM24 aluminium alloy reinforced with nano alumina and graphite using response surface methodology. Journal of Ceramic Processing Research, 24(5): 899-906. https://doi.org/10.36410/jcpr.2023.24.5.899
[12] Papabathina, M.R., Chinka, S.S.B., Putta, N.R., Vijaya, M., Dhoria, S.H., Chilakala, D.R., Jarubula, R.R.C., Kancharla, P.K. (2023). Effect of graphite on mechanical and tribological properties of Al6061/SiC hybrid composites. Annales de Chimie - Science des Matériaux, 47(3): 125-132. https://doi.org/10.18280/acsm.470301
[13] Gugulothu, B., Sankar, S.L., Vijayakumar, S., Prasad, A. S.V., Thangaraj, M., Venkatachalapathy, M., Rao, T. (2022). Analysis of wear behaviour of AA5052 Alloy composites by addition alumina with zirconium dioxide using the Taguchi-grey relational method. Advances in Materials Science and Engineering, 2022(1): 4545531. https://doi.org/10.1155/2022/4545531
[14] Sahu, M.K., Sahu, R.K. (2018). Fabrication of aluminum matrix composites by stir casting technique and stirring process parameters optimization. In Advanced Casting Technologies. InTech. https://doi.org/10.5772/intechopen.73485
[15] Manikandan, M., Prabhavathi, K., Kumar, C.S., Al-Attabi, K., Saxena, A. (2024). ANOVA study on wear parameters in aluminum metal matrix nano composites. E3S Web of Conferences, 491: 02023. https://doi.org/10.1051/e3sconf/202449102023
[16] S, F.R., J, A., Chanakyan, C. (2023). Optimization of squeeze casting process parameters on mechanical properties of SiCp reinforced LM25 composites through Taguchi technique. Materials Research Express, 10(7): 076515. https://doi.org/10.1088/2053-1591/ace75e
[17] Kishore, P., Kumar, P.M., Dinesh, D. (2019). Wear analysis of Al 5052 alloy with varying percentage of tungsten carbide. AIP Conference Proceedings, 2128: 040003. https://doi.org/10.1063/1.5117965
[18] Samal, P., Vundavilli, P. R., Meher, A., Mahapatra, M.M. (2021). Multi-response modeling for sliding wear behavior of AA5052/TiC composites by stir casting: A comparative analysis using response surface methodology and fuzzy logic system. Proceedings of the Institution of Mechanical Engineers, Part E: Journal of Process Mechanical Engineering, 236(2): 254-266. https://doi.org/10.1177/09544089211037443
[19] Samal, P., Vundavilli, P.R., Meher, A., Mahapatra, M.M. (2019). Influence of TiC on dry sliding wear and mechanical properties of in situ synthesized AA5052 metal matrix composites. Journal of Composite Materials, 53(28-30): 4323-4336. https://doi.org/10.1177/0021998319857124
[20] Patel, M., Sahu, S.K., Singh, M.K. (2020). Abrasive wear behavior of SiC particulate reinforced AA5052 metal matrix composite. Materials Today: Proceedings, 33: 5586-5591. https://doi.org/10.1016/j.matpr.2020.03.572
[21] Patel, M., Sahu, S.K., Singh, M.K., Sahu, D.P. (2022). Investigation of tribological properties of stir cast AA5052/B4C MMC under different loads. Jurnal Tribologi, 34: 69-86.
[22] Mahan, H.M., Konovalov, S.V., Panchenko, I., Al-Obaidi, M.A. (2023). The effects of titanium dioxide (TiO2) content on the dry sliding behaviour of AA2024 aluminium composite. Journal of Mechanical Engineering, 20(3): 239-261. https://doi.org/10.24191/jmeche.v20i3.23910
[23] ASM Handbook Committee. (1990). Properties and selection: Nonferrous alloys and special-purpose materials. ASM International, 2: 978-1-62708-162-7. https://doi.org/10.31399/asm.hb.v02.9781627081627
[24] ASTM G99-17. (2017). Standard test method for wear testing with a pin-on-disk apparatus. ASTM International, West Conshohocken, PA. https://store.astm.org/g0099-17.html.