Foraq A. Obaid![]() | Mahmoud Sh. Hussain*
| Mahmoud Sh. Hussain*![]()
© 2025 The authors. This article is published by IIETA and is licensed under the CC BY 4.0 license (http://creativecommons.org/licenses/by/4.0/).
OPEN ACCESS
This work investigates the enhancement of the physical and mechanical properties of the polyvinyl acetate using the newly prepared monomer to produce nanocopolymers via emulsion polymerization. The monomers were characterized by infrared spectrum FTIR, H-NMR, thermal analysis TGA, and differential scanning calorimetry (DSC). The morphological and dynamic light scattering (DLS) analysis were used to provide information about the volumetric distribution of strong particles, stability and dynamic behavior of the submitted polymers in the aqueous or organic medium. Likewise, the scanning electron microscopy (SEM) used to analyze the particles (forms, distribution, and gatherings). The size of volumetric distribution, X-ray diffraction (XRD) was used for the detection of surface and porridge defects in polymer films. Provides accurate information about the degree of crystallization, the brown structure and the size of the crystals.
copolymer, emulsion polymerization, SEM
The common polymer molecule resulting from a suitable monomerize polymer is different from the properties of the polymer resulting from the polymerization each monomer separately, however, the common polymer collects the new benefits of both homogeneous polymeric, the joint polymer for vinyl acetate and vinyl chloride has a highly ductility degree in relation to the vinyl chloride Polymer, an addition to high thermal staple relative to the vinyl acetate [1, 2]. It is how the different monomer units in the polymer series are associated with the common polymer type and have a significant impact on the mechanical and physical polymer properties. On this basis, common polymers are classified into two types of monomeric units that are distributed in the polymer series randomly. Block polymers are prepared by linking the successive linear chains of two different homogeneous polymers, and living polymers are one of the important types used in preparing joint mass polymers, as this technology provides an important advantage, which is the ability to control the size of the mass when the conditions are correct [3, 4]. Emulsion polymerization is a pigeon that resembles plankton pulp in terms of ease of cooling the interaction mixture and using water as a medium to spread. Ammonium persulphate and some of the Azo and others. The water medium contains an emulsifying - Agent and is usually a solution of soap, and it has been found from the microscopic studies of the emulsifier medium that the molecules of the soapy material arrange themselves in the form of different Michel’s soapy particles, and their end -loving water -loose end, its hydrophobic water ends [5]. There are different types of these subordinated materials that may be ionic, such as the sulfate of the wail, the array or phosphate, and some of them are familiar compounds, such as sodium lories sulfate. The submitted substance may be non -ionic, such as silicon octagonal hydroxide or polyethylene alcohol. Polymeric nanoparticles are defined as dispersed particles or solid particles ranging from 10-1000 nanometers [6]. The properties of polymeric nanotechnologies must be improved according to special applications such as biotechnology, medicine, the environment and drug carriers in the pharmaceutical and electronics field. The emulsion is one of the fastest ways to prepare the nanoparticles and can be easily developed, and this method is classified into two categories based on the use of a continuous organic or water phase and includes the continuous organic phase methodology of distraction in the emulsion or exact emulsion or in a material that does not melt in the monomer [7]. The nanocelets of the ultra-amid urine in this way and as one of the first methods of producing the nanoteants produced Settled materials or soluble protective polymers were used to prevent clumping in the early stages of polymerization. The term nano emulsion indicates dispersion that is not mixed with oil, such as oil and water, thermally stable, transparent and equal properties, installed with a Benny membrane of the stimulant materials of the surfaces and nanoparticles, with free radicals [8]. The aim of this research is to synthesis new nano copolymers via emulsion polymerization, and use FTIR, 1H-NMR, DSC, TGA, XRD, dynamic light scattering (DLS) and FESEM to characterize it.
2.1 Chemicals
All materials used in the preparation of subscriber polymers, submitted cobulimrat, solvents, and initially polymers are pure materials produced by (Sigma Aldrich, BDH, Merk, Fluka, H & W).
2.2 Characterization methods
FTIR infrared spectra have been recorded in the range 400-4000 cm-1 using KBR tablets. The 1H-NMR protection spectrum of the Bruker -prepared vehicles with a temperature of 25℃ was recorded. DMSO as a solvent and TMS as an internal reference. DSC differential scanning curves and TGA thermal analysis curves were recorded using the Perken ELMAR device, as the models were measured in an inactive atmosphere of Arcon and at a rate of 50 min/ml and the 10℃-improvement rate within the range (800 - 20) using a platinum eyelid. X-ray diffrance (XRD) the imbued cobulimrat prepared with an X-ray breeze with a Panalytic type with a potassium-CU-KA copper and a wave length of 1.5406 = λ. field emission scanning electron microscopy )FESEM), TESCAN Vega 3 model.
2.3 Methods of preparation
2.3.1 II-acrylamidoundedecanoic acid (F1)
It is prepared from the II-amino undecanoic acid 2.5 gm (0.1 mol) reaction with 9 ml. (0.1 mol) of Acryloyl Chloride with (0.1 M). NaOH and 10 ml ethanol alcohol as a solvent for two hours with continuous stirring, at 75℃ in a three-neck round flask of 250 ml, after which a solution is obtained with a little of diluted HCL acid, the precipitate is washed with distilled water [9], as shown in Figure 1.
Figure 1. The reaction of synthesis II-acrylamidounde-decanoic acid, (F1) monomer
2.3.2 Preparation of the F2 copolymer
It,s synthesis from the free radical polymerization by reaction of 2.5 gm (0.1 mol) acrylamidoundecanoicacid II- prepared (F1) with 0.6 ml (0.1 mol) of acrylonitrile dissolved in 10 ml DMF and added 0.02 gm Ammonium persulfate as a intiator polymerization in a 250 ml round flask at a temperature of 75℃ for two hours with continuous stirring, after which a solution is obtained with a little HCI acid at a concentration of 0.5 is normal for a precipitate washed with distilled water according to the following equation as shown in Figure 2.
Figure 2. Synthesis of the F2 copolymer
2.3.3 Preparation of the F3 copolymer
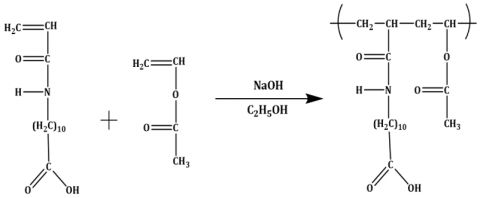
This copolymer is prepared by mixing 2.5 gm of the monomer 11-acrylamidoundecanoic acid (0.1 mol) with 0.9 ml (0.1 mol) of vinyl acetate dissolved in DMF 10 ml and adding 0.02gm of ammonium persulphate as a polymerization intiator in a round flask of 250 ml at a temperature of 75℃ for two hours with continuous stirring to obtain a clean solution of a little HCl acid at a concentration of 0.5N to obtain a precipitate washed with distilled water [10], as shown in Figure 3.
Figure 3. Synthesis of F3 copolymer
2.3.4 Preparation of emulsified copolymers
Two emulsified copolymers were prepared by mixing 0.2 g of each of the two previously prepared copolymers, namely F2 and F3, with 10 ml of a pH-regulated solution of 8 and 0.2 g of ammonium persulfate starter with 5 ml of monomer vinyl acetate, with continuous stirring and with the presence of an atmosphere of nitrogen in a round flask of 250 ml, for one hour, at room temperature, and the separation time of the aqueous and organic layers was recorded and was (181,198)sec. The reaction continues for another three hours at a temperature of 75℃ to obtain two emulsified copolymers [11].
3.1 Infrared spectra (FTIR)
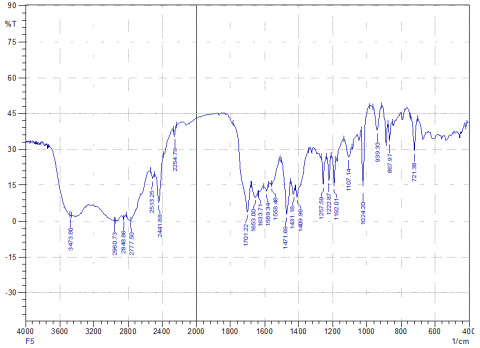
The infrared spectra of the F2 copolymer are shown in Figure 4(a). It is characterized by a broad band at 3437 cm-1 attributed to the O-H group, which appears broad due to hydrogen bonding and its overlap with the N-H stretching band. which appears in approximately the same region. The band in the range of 2777-2950 cm-1 corresponds to aliphatic C-H stretching vibrations. A distinct band observed at 2245cm-1 is assigned to the nitrile group. The band at 1701 cm-1 corresponds to the carbonyl group (C=O) of the carboxylic acid, while the band at 1653cm-1 is attributed to the amide carbonyl (C=O) group.
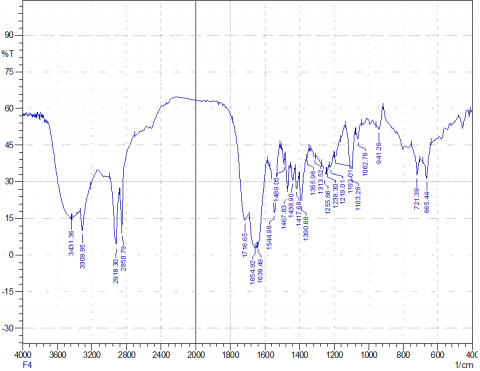
In the spectrum of this copolymer as in Figure 4(b), a wide beam at 3431 cm-1 belonging to the OH group and it was wide due to hydrogen fusion, while the beam at 3309 cm-1 belongs to the NH group, the beam within the range 2850-2918 cm-1 belongs to the Aliphatic -CH group, the beam at 1716 cm-1 belongs to the estrical carbonyl group, the beam 1654 cm-1 belongs to the carbonyl acid carboxylic group, the beam at 1639 cm-1 belongs to the Amide carbonyl group and the beam at 1236 cm-1 belongs to the Esterial C-O, and also shwoed in Table 1 [12].
(a)
(b)
Figure 4. (a) Infrared spectrum of the F2 copolymer. (b) Infrared spectra of the copolymer F3
Table 1. Presents the main characteristic bands of these copolymers
|
Symbol Complex |
OH Carboxylic Acid |
-NH |
-CH the Elephantiac |
Nitrile |
C=O Asteria |
C=O Sour |
C= Amade |
C-O |
|
F3 |
3431 |
3309 |
2850-2918 |
- |
1716 |
1654 |
1639 |
1236 |
|
F2 |
3437 |
3437 |
2777-2950 |
2254 |
|
1701 |
1653 |
|
3.2 Interpretation of the HNMR and Copolymeric spectra
3.2.1 Magnetic nuclear resonance spectrum
Figure 5 showed the return to the copolymer F2 with a signal at 9.1 ppm attributed to the proton of the (O-H) group of the carboxylic acid. The signal at 8.3 ppm corresponds to the proton of amide (-NH) group. The signal at 3.26 ppm is assigned to the proton of the –CH group attached to the nitrile group. the signal at 2.16 ppm corresponds to the proton of the –CH2 group among the ten methylene groups located near the carboxylic group. The signal in the range of 1.4 - 1.6 ppm is attributed to the proton of the –CH2 groups among the ten methylene groups close to the amide group. while the signal at 1.2 ppm corresponds to the protons of the remaining eight –CH2 groups (-(CH2)8-) [13].
Figure 5. The proton nuclear magnetic resonance (¹H-NMR) spectrum of the copolymer F2
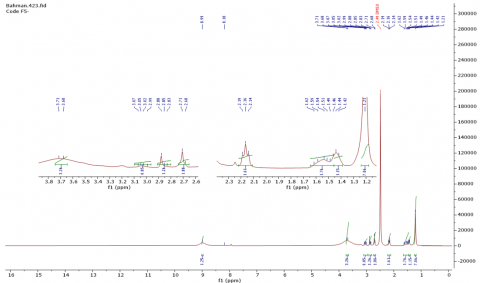
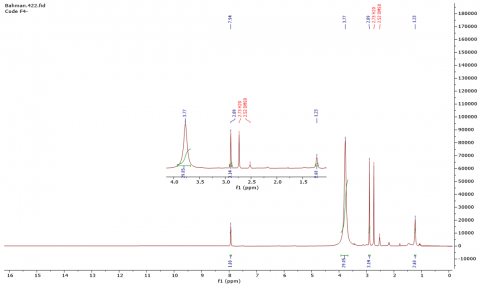
The following signals in the spectrum of the F3 copolymer as shown in Figure 6. The presence of a signal at 8.1 belongs to the proton of the amide group, and the multiple signals from (1.2-1.6) belong to the sum of CH2(10) and the signal at 2.6 belongs to the group of two of the main and near chain on the signal at 1.7 is for the protons of the methyl group in acetate. A signal at 2.2 is for the protons of the methyl group associated with acetate [13].
Figure 6. The proton nuclear magnetic resonance (¹H-NMR) spectrum of the copolymer F4
3.2.2 Interpretation of TGA and DSC thermal analyzes for the prepared cobalamin
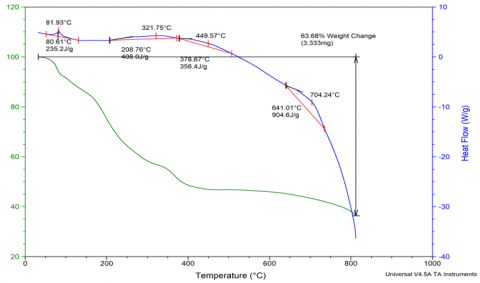
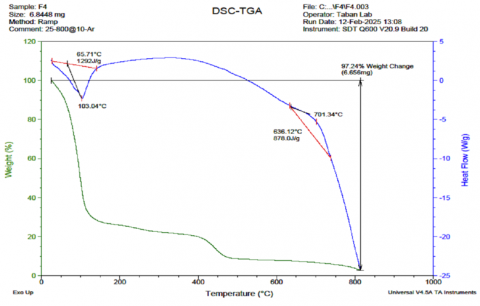
The curves of the thermal analysis of the prepared cobalamin show that they participate together in one behavior, which is the presence of more than one summit for the disintegration process and the distinctive thing that there are two summits of the disintegration process before 300℃ and this is due to a fracture in the NH- hids and the C=O The emergence of a bundle of decomposition below 100℃, and with regard to the last two packages, it is due to the disintegration of the altoalieg groups that need temperatures higher than 300℃ and this is what the decomposition curves have shown. This clear behavior of these copolymers was confirmed by DSC interactive scanning curves, which showed that these copolymers begin to disintegrate before 200℃ .To find out the thermal stability of the prepared copolymer through TGA / DSC curves. The copolymer loses more than half of its weight within the measuring range, and the degree of disintegration of it calculated 50% of the weight of the T50%, Figures 7 and 8 [14].
Figure 7. The thermogravimetric analysis (TGA) and differential scanning calorimetry (DSC) of the copolymer F2
Figure 8. The TGA and DSC analyses of the copolymer F3
The high loss ratio indicates the high thermal stability and high stability of the prepared compounds, where Ti represents the temperature at which the change in mass begins, Tm is the maximum rate of change or the degree of crystallization of the polymer, and Tf is the degree at which the change ends, Table 2.
Table 2. Dissociation temperatures (Ti, Tm, Tf) and T50% loss ratio of TGA and DSC curves
|
Compound |
Wt. (mg) |
%Weight Change |
T50℃ |
Ti℃ |
Tm℃ |
Tf℃ |
|
F3 |
6.656 |
97.24 |
701.34 |
65.71 |
103.09 |
162.32 |
|
636.12 |
701.34 |
741.28 |
||||
|
F2 |
3.333 |
93.98 |
321.75 |
80.61 |
81.93 |
120.00 |
|
208.76 |
321.75 |
368.98 |
||||
|
378.63 |
449.57 |
490.36 |
||||
|
644.01 |
704.24 |
728.66 |
3.2.3 Field emission –scanning electron microscop FESEM
Scanning electron microscopy with a light emission field (FE-SEM) is one of the important techniques in examining the studied surfaces, as it gives details about the shape of the particles and the nature of the clustering between them, as well as the nature of the surfaces in terms of being porous or smooth, as well as knowing the amount of homogeneity between the components and their distribution on the surface.
Figure 9. The photoluminescence emission electron microscopy images of the emulsified copolymer F3
Figure 10. The field emission scanning electron microscopy (FE-SEM) images of the emulsified copolymer F4
The images of the scanning electron microscope showed the photo-emission scanner of the prepared copolymers, as shown in Figures 9 and 10.
The two samples are characterized by an advanced nanostructure in terms of shape, size, distribution and surface nature, which reflects the efficiency of the preparation methodology used in the production of these polymeric systems [15]. In terms of morphological shape, the particles showed a spherical to aspherical structure in the two samples, which indicates a balance in the forces of surface tension during the emulsification and polymerization process.
This is an indication of the stability of the system and the absence of heterogeneous particle growth, and we have observed the presence of some irregular particles in some samples indicating the possibility of heterogeneity in the polymerization speed or rapid partial evaporation of the solvent during formation. The average molecular size ranged between (50-200) nm with slight variation between samples depending on the composition of the emulsion and experimental conditions such as the concentration of active substances and monomers. The existence of this nanoscale confirms the high susceptibility of these materials to enter into nano applications, especially in the fields of drug delivery, smart coatings, cosmetics and nanocomposite materials [16].
3.2.4 Dynamic light scattering
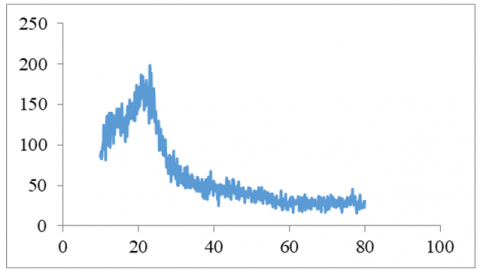
DLS technology plays an important role in the diagnosis of emulsified polymers as it provides accurate information about the hydrodynamic diameter, PI distribution index and dynamic properties of the system. The Zetasizer device used in DLS measurement provides a lot of information depending on the software provided by the device, as the device gives the arithmetic mean (average volumes), as well as the so-called Mode Pattern, which represents the relative abundance versus the volume in nanometers, where it chooses the highest abundance, which represents the pattern. Figure 11 shows the distribution of the DLS particle size of the emulsified copolymer F2, as the figure shows a clear peak at about 105 nm, which indicates a relatively narrow distribution of the particle size, and this indicates a good homogeneity in the size of the prepared particles, and that the particle sizes were within the range (93-112) nm, and the value of the rate is equal to 105.9 nm, and the value of the mode is equal to 106.2, which are two close values, and this indicates a great homogeneity in the prepared sample [17].
Figure 11. Particle sizes of emulsified copolymer through DLS
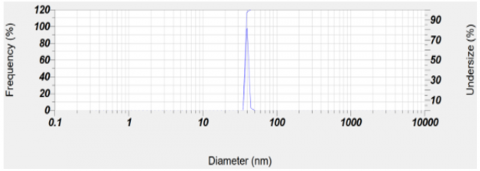
As for the emulsion copolymer F4, the analysis of the particle distribution using DLS technique showed that there is a sharp peak at 37.3 nm, which indicates a narrow and homogeneous distribution of particle size, and that the particle sizes were within the range of (35-46) nm, and the value of the mean rate is 37.3 nm, which is the same as the norm value, which reflects high regularity and the absence of agglomerations or multiple distributions, and these results confirm the efficiency of the preparation method and the stability of the nanostructure of the sample, Figure 12.
Figure 12. Particle sizes of emulsified copolymer through DLS
3.2.5 X-ray diffraction XRD
X-ray diffraction technique is an important method for the diagnosis of nanomaterials, as well as its importance in studying the crystal nature of prepared emulsified copolymers, and the size of crystals can be calculated using the Debye-Sherrer equation, which often relies on peaks of higher intensity in calculating the size of the crystals. XRD spectra of the prepared emulsion copolymers (F2, F3) were recorded at 2Θ range (10-80). Figure 13 shows the X-ray diffraction pattern of the F3 emulsion copolymer where the results showed clear peaks at the angular range of 2Θ = (20.6, 47.9, 48.1, 57.2, 69.3) and the highest peak at 2Θ is equal to 20.6 [18].
Figure 13 shows the X-ray diffraction pattern of the F3 emulsion copolymer. The results reveal distinct peaks at 2θ values of 20.6°, 47.9°, 48.1°, 57.2°, and 69.3°, with the most intense peak observed at 2θ = 20.6° [18].
The X-ray diffraction pattern of the F2 emulsion copolymer shows distinct peaks at 2θ values of 14.3°, 21.2°, 44.9°, 54.2°, 60.3°, 64.04°, 75.7°, and 79.6°, with the most intense peak observed at 2θ = 21.2° (Figure 14).
Figure 13. X-ray diffraction (XRD) pattern of the F2 emulsion copolymer
Figure 14. XRD style for the emulsion
The sizes of the crystals also calculated the use of the Dibai -Shearer Eq. (1), and by displaying the summit at the middle of the greatest intensity, it was found that the prepared, and prepared cobulimimar has sizes the nanopolitan (F3 = 36.26, F4 = 36.53) [19, 20].
$D=\mathrm{K} \lambda / \beta h k l \cdot \cos \theta$ (1)
where,
D: The size of the crystal.
K: Represents the shape factor or a stereotype. Its value of 0.9 and λ the wavelength of the copper and equals 0.154 nm after converting it.
It is clear from the previous two forms of the urban emulsion; the two samples enjoy a clear crystal composition and good crystallization. The presence of sharp values at specific angles and small FWHM values that emphasize the purity of the crystal phase and the presence of nanoparticles (Table 3).
Table 3. The sizes of the nanoparticles of the prepared emulsions
|
F3 |
F2 |
Copolymer Symbol |
|
36.26 |
36.53 |
The size of the crystals in the nanometer |
The demand for innovative materials with improved qualities, whether continuous or in the form of particles, is critical for progress in sample preparation in general, and miniaturized extraction procedures in particular. The usage of emulsions is particularly interesting since the synthetic methods are far simpler, and in the case of Pickering emulsions, they eliminate the use of harmful stabilizing components, while the micro and nanoparticles used can also endow the solid with additional features like as magnetic. Furthermore, the capability of surface modification allows for the control of the final material's hydrophobicity. This feature, together with optimal monomer selection, increases the selectivity and sensitivity of the linked analytical techniques. Polymerization can occur within a plastic container with varying geometry. The created extraction unit can be immersed in the sample to isolate analytes. The ease of emulsion polymerization and the controlled porosity of the finished material are cited as advantages for its widespread application in material science and its interface with analytical chemistry. The finished solids are also environmentally sustainable because they have similar selectivity to standard MIPs while utilizing fewer resources.
This research is supported by the Department of Chemistry, College of Education of Pure Sciences, University of Basrah, as part of a PhD graduation requirements.
[1] Lovell, P.A., Schork, F.J. (2020). Fundamentals of emulsion polymerization. Biomacromolecules, 21(11): 4396-4441. https://doi.org/10.1021/acs.biomac.0c00769
[2] Fresco-Cala, B., Cárdenas, S. (2022). Advanced polymeric solids containing nano-and micro-particles prepared via emulsion-based polymerization approaches. A review. Analytica Chimica Acta, 1208: 339669. https://doi.org/10.1016/j.aca.2022.339669
[3] Natour, S., Levi-Zada, A., Abu-Reziq, R. (2019). Magnetic polyurea nano-capsules synthesized via interfacial polymerization in inverse nano-emulsion. Molecules, 24(14): 2663. https://doi.org/10.3390/molecules24142663
[4] Anton, N., Benoit, J.P., Saulnier, P. (2008). Design and production of nanoparticles formulated from nano-emulsion templates—A review. Journal of Controlled Release, 128(3): 185-199. https://doi.org/10.1016/j.jconrel.2008.02.007
[5] Letchford, K., Burt, H. (2007). A review of the formation and classification of amphiphilic block copolymer nanoparticulate structures: Micelles, nanospheres, nanocapsules and polymersomes. European Journal of Pharmaceutics and Biopharmaceutics, 65(3): 259-269. https://doi.org/10.1016/j.ejpb.2006.11.009
[6] Abd El-Wahab, H., Hassan, W.A. (2005). Preparation and characterization of nano-copolymers (styrene/2-Ethyl hexyl acrylate) based on two different surfactants and use it as a binder for surface coatings. Nano Tech Nano Science IND Journal, 12(2): 127.
[7] Raheem, M.A., Abdulnabi, Z.A., Al-Shawi, A.A.A. (2025). Synthesis and characterization of multiwalled carbon nanotubes decorated by ZnO and Ag2O for using to remove methyl green and Erythrosin B dyes from their aqueous solutions. Annales de Chimie - Science des Matériaux, 49(1): 83-93. https://doi.org/10.18280/acsm.490111
[8] Yang, C., Xuan, Y., Pang, S., An, Y. (2024). Preparation of nano-micron copolymers for polymer flooding using aqueous solution polymerization and inverse emulsion polymerization and their comparison. Journal of Dispersion Science and Technology, 45(13): 2394-2407. https://doi.org/10.1080/01932691.2023.2265999
[9] Sharma, S., Poddar, M.K., Moholkar, V.S. (2017). Enhancement of thermal and mechanical properties of poly (MMA-co-BA)/Cloisite 30B nanocomposites by ultrasound-assisted in-situ emulsion polymerization. Ultrasonics Sonochemistry, 36: 212-225. https://doi.org/10.1016/j.ultsonch.2016.11.029
[10] Reis, C.P., Neufeld, R.J., Ribeiro, A.J., Veiga, F. (2006). Nanoencapsulation I.Methods for preparation of drug-loaded polymeric nanoparticles. Nanomedicine: Nanotechnology, Biology and Medicine, 2(1): 8-21. https://doi.org/10.1016/j.nano.2005.12.003
[11] Yamak, H.B. (2013). Emulsion polymerization: Effects of polymerization variables on the properties. Polymer Science, 35: 35-73. https://doi.org/10.5772/51498
[12] Liang, L., Wen, T., Xin, J., Su, C., et al. (2023). Fluoropolymer: A review on its emulsion preparation and wettability to solid-liquid interface. Molecules, 28(2): 905. https://doi.org/10.3390/molecules28020905
[13] Torrecillas, C.M., Halbert, G.W., Lamprou, D.A. (2017). A novel methodology to study polymodal particle size distributions produced during continuous wet granulation. International journal of pharmaceutics, 519(1-2): 230-239. https://doi.org/10.1016/j.ijpharm.2017.01.023
[14] Liu, H., Bian, J., Wang, Z., Hou, C.J. (2017). Synthesis and characterization of waterborne fluoropolymers prepared by the one-step semi-continuous emulsion polymerization of chlorotrifluoroethylene, vinyl acetate, butyl acrylate, Veova 10 and acrylic acid. Molecules, 22(1): 184. https://doi.org/10.3390/molecules22010184
[15] Kohut, A., Voronov, S., Demchuk, Z., Kirianchuk, V., et al. (2020). Non-conventional features of plant oil-based acrylic monomers in emulsion polymerization. Molecules, 25(13): 2990. https://doi.org/10.3390/molecules25132990
[16] Hoo, C.M., Starostin, N., West, P., Mecartney, M.L. (2008). A comparison of atomic force microscopy (AFM) and dynamic light scattering (DLS) methods to characterize nanoparticle size distributions. Journal of Nanoparticle Research, 10(Suppl 1): 89-96. https://doi.org/10.1007/s11051-008-9435-7
[17] Hamzah, Y.B., Hashim, S., Rahman, W.A.W.A. (2017). Synthesis of polymeric nano/microgels: A review. Journal of Polymer Research, 24(9): 134. https://doi.org/10.1007/s10965-017-1281-9
[18] Monshi, A., Foroughi, M.R., Monshi, M.R. (2012). Modified Scherrer equation to estimate more accurately nano-crystallite size using XRD. World Journal of Nano Science and Engineering, 2(3): 154-160. https://doi.org/10.4236/wjnse.2012.23020
[19] Souza, T.G., Ciminelli, V.S., Mohallem, N.D.S. (2016). A comparison of TEM and DLS methods to characterize size distribution of ceramic nanoparticles. Journal of Physics: Conference Series, 733(1): 012039. https://doi.org/10.1088/1742-6596/733/1/012039
[20] Jiang, W., Li, W., Chen, L. (2015). Synthesis and characterization of novel acrylate emulsion containing phosphorus and silicon prepared via semi-continuous seeded emulsion polymerization. Designed Monomers and Polymers, 18(2): 180-184. https://doi.org/10.1080/15685551.2014.971393