Adnan A. Ismael![]() | Abdulnaser A. Ahmed
| Abdulnaser A. Ahmed![]() | Emad Toma Karash*
| Emad Toma Karash*![]() | Ahmed Mohammed Mahmood
| Ahmed Mohammed Mahmood![]()
© 2025 The authors. This article is published by IIETA and is licensed under the CC BY 4.0 license (http://creativecommons.org/licenses/by/4.0/).
OPEN ACCESS
Modern construction technology employing non-traditional materials offers advantages beyond conventional building materials, such as complex geometric design, unique surface finishes, weight savings, enhanced durability, improved dimensional stability, and faster installation. Composite materials, in particular, present a promising alternative due to these superior characteristics. This study aims to compare composite-based alternative materials with conventional building materials in terms of deformation and stress–strain behavior under compressive loading. Models were designed using Solid Works software, then imported into ANSYS for finite element analysis. A compressive load was applied to both conventional and composite material models to evaluate resistance, deformation, and stress intensity. The seventh model, made of jute–epoxy composite, showed a 77.95% reduction in deformation compared to the first model. Stress intensity ratios in the seventh and eighth models decreased by 4.03% and 13.79%, respectively. Weight calculations revealed significant reductions, with the seventh and eighth models weighing 56.97% and 47.52% less than the first model. Composite materials demonstrate superior mechanical performance and considerable weight savings compared to conventional building materials. Their use reduces structural loads and construction costs, confirming their potential as an effective alternative in modern construction applications.
deformation, non-traditional materials, finite elements, building materials, epoxy, jute
The demand for special materials with distinctive qualities not present in metal alloys, ceramics, or polymer mixes has grown as a result of technological breakthroughs. To address these demands, composite materials have been developed. Their composition consists of two or more separate, immiscible elements with various mechanical, physical, and/or chemical characteristics. In composites, the reinforcement adds stiffness and prevents the structure from cracking, while the matrix transfers loads between the fibers and holds the reinforcement together. Composites are classified as heterogeneous, multiphase engineering materials. They can be categorized according to the matrix (metallic, polymeric, ceramic) or type of reinforcement (particles or fibers) employed. Continuous fiber materials with a polymeric matrix are highly desirable because of their superior mechanical qualities, good. Polymeric materials featuring continuous fibers and an excellent mechanical performance are highly desirable because of their low density, good thermal stability, and excellent mechanical properties [1-6]. A composite's performance characteristics are those that none of its constituents could accomplish on their own. High strength, stiffness, and low weight can be achieved with these combinations; high temperature, corrosion resistance, and impact resistance are additional essential qualities. When taken as a whole, these factors increase the interest, utility, and appeal of composites over other options [7-12]. The amount of work involved in strengthening elements is growing in modern construction, both in the process of erecting new structures and in the course of repair and restoration projects. In the construction of buildings and other industrial and civil structures, reinforced concrete structural elements such as floors, beams, and columns are frequently utilized. The great majority of the time, columns support other structural components like beams, floor slabs, purlins, and beams. Reinforced concrete constructions can be made stronger and have a longer service life by using composite materials.
Building structure strengthening projects must be designed and carried out with the least amount of expense to the structure rather than compromising its stability and strength. During the construction of reinforced concrete structures, the influence of polymer composite materials on the design of a structure can be achieved by altering the mechanical and physical properties of components, analyzing the structure of a composite construction, and controlling technological parameters at every stage from component manufacture to structure creation. Able to select the best solution to the problem by utilizing different reinforcement options such as carbon fabrics or tapes, different types of material winding, altering the composition of the adhesive, and adjusting the application method to the surface [13-18]. One of the most important aspects of planning is the utilization and preparation of materials. Here, the materials are prepared with the intention of implementing energy efficiency in order to lower building operating costs. Building energy use is influenced by a well-designed architectural and energy system as well as efficient building operation and maintenance following occupancy. Systems are complex, integrated, and interconnected [19, 20].
This article [21] reviews the use of composite materials in civil engineering structures and presents significant findings and techniques based on current research. It is a succinct and practical study. Based on linear static analysis, it is discovered that lower floor beams are more important in column loss scenarios than upper floor beams. Furthermore, under sudden column loss, beams with Demand Capacity Ratios (DCRs) greater than two will fail, according to linear static evaluation. This study [22] aims to demonstrate the superiority of using composite materials over other reinforcing elements in terms of dependability, cost-effectiveness, and environmental friendliness when used to strengthen building structures. Conclusion: Without better design solutions for strengthening structures that would guarantee their dependability, durability, economy, and environmental friendliness, it is currently impossible to improve the efficiency of repair and restoration works. The study [23] offers a summary of conventional building materials that can aid in the development of novel building materials to lessen the effects of climate change. Sand, brick, wood, and water are some of these materials. According to the study, using traditional building materials has helped modern construction make significant progress. Studying conventional building methods and learning about the characteristics of these materials can still be very beneficial. This study [24] aims to give a general overview of advanced composite materials, their uses, and their place in modern construction. The capabilities of advanced composite materials can solve complex design problems. They do, however, have special qualities that set them apart from conventional building materials with high elasticity properties, making them extremely useful for repairing existing buildings and structures. Three mathematical models were created for this study [25]; Concrete was used in the first, carbon fibers in the second, and glass fibers in the third. The findings indicate that the von Mises stress in the second model is 57% more than that in the first model, whereas the von Mises stress in the third model is 47% lower. Jute composites have higher flexural stiffness and tensile modulus than jute-polyester composite laminates, according to research on their mechanical behaviors and characteristics. Composites made of natural fibers are utilized because of their mechanical and thermal characteristics, as well as their vulnerability to moisture absorption. debonding of the fiber-matrix at the interface as a result of insufficient fiber-polymer adhesion and exceptional moisture absorption. Reinforcement of natural fibers is necessary to enhance the characteristics of epoxy composites [26, 27].
In order to create new structures with unique specifications, as well as ones that are inexpensive and lightweight, researchers have employed unconventional materials in place of conventional ones in a number of studies. These materials have been used to build various structures, buildings, aircraft, military equipment, and other fields. As a result, new and creative structures are produced as an alternative to those made of conventional materials [28-31].
The main objective of this study is to design eight models using Solid Works and then convert them to ANSYS. The models are as follows:
Concrete Brick; Hollow Concrete Brick; Pressed Clay Brown Brick; Pressed Clay Biscuit; Pressed Clay Red Brick; Calcium Silicate Brick; Composite Jute (20%) - Epoxy (80%); Composite Glass (20%) - Epoxy (80%).
Then, the deformation, stress, and strain conditions of traditional building materials will be compared with alternative materials based on composites. Solid Works will be used to build models of these materials to apply a compressive load, measure the deformation rate, and evaluate the material's resistance to this type of force. These models will then be converted to ANSYS and tested using finite element analysis.
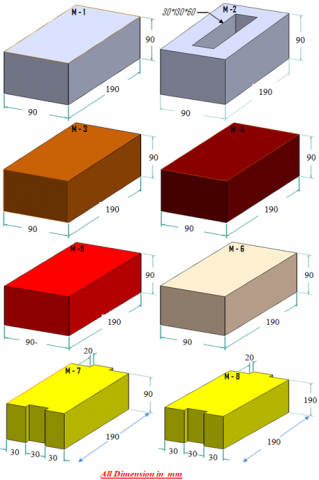
Eight 3D models with the same size were created in Solid Works and then imported into ANSYS for the finite element analysis of a wall structure. The materials employed in the models included solid block, hollow block, solid brick, hollow brick, jute–epoxy composite, and fiberglass–epoxy composite. Figure 1 displays the geometric models (M-1 through M-8) that were utilized in the study. Each model had a base size of 190 × 90 × 90 mm, albeit their configurations varied: M-1: A straightforward solid rectangular block.
Figure 1. The eight geometric models, their precise measurements, and their use in applying the finite element method to assess the mechanical reaction
Table 1. Mechanical parameters adopted in the present study [25, 28-33]
|
Model |
Materials |
Density (ρ, Kg/m3) |
Thermal Conductivity (W/m.k) |
Modulus of Elasticity (E, GPa) |
Tensile Strength (MPa) |
Compressive Strength (MPa) |
Passion Ratio |
Volume (m3) |
Weight (Kg) |
|
|
M1 |
Concrete Brick |
2050 |
0.8 |
14 |
3.57 |
13.8 |
0.33 |
0.001305 |
2.275 |
|
|
M2 |
Hollow Concrete Brick |
2050 |
0.8 |
14 |
3.57 |
13.8 |
0.33 |
0.001539 |
2.616 |
|
|
M3 |
Pressed Clay Brown Brick |
1700 |
0.54 |
7 |
20 |
3.1 |
0.21 |
0.001539 |
2.770 |
|
|
M4 |
Pressed Clay Biscuit |
1800 |
0.54 |
10 |
20 |
2.5 |
0.29 |
0.001305 |
2.275 |
|
|
M5 |
Pressed Clay Red Brick |
1900 |
0.43 |
14 |
33.1 |
3.5 |
0.22 |
0.001539 |
2.924 |
|
|
M6 |
Calcium Silicate Brick |
2100 |
0.07 |
6 |
10 |
25.3 |
0.17 |
0.001539 |
3.232 |
|
|
M7 |
Composite |
Jute (20%) |
1800 |
0.17 |
230 |
3500 |
889 |
0.3 |
0.001539 |
0.979 |
|
Epoxy (80%) |
1200 |
0.23 |
3.5 |
50 |
82 |
0.3 |
||||
|
M8 |
Composite |
Glass (20%) |
2500 |
0.8 |
87 |
- |
11.02 |
0.2 |
0.001539 |
1.194 |
|
Epoxy (80%) |
1200 |
0.23 |
3.5 |
50 |
82 |
0.3 |
||||
M-2: A block with a rectangular hole in the middle that measures 30 × 90 × 50 mm. Solid blocks that resemble M-1 but are made of different materials are M-3 and M-4. Other solid blocks M-5 and M-6 are made of different materials but have the same dimensions.
M-7: A modified block featuring two vertical slits that are 30 mm wide and divided by a wall that is 30 mm thick, with a top edge that is 20 mm thick. M-8: Like M-7, but with a 20 mm thick top edge and a single 30 mm wide slit between two parallel 50 mm thick walls. The density, mechanical, and thermal properties of the materials, together with other relevant data utilized in the six models, are summarized in Table 1. The weight economy, temperature resistance, deformation behavior, and structural strength of various models are quantitatively compared in the study. The objective is to compare the performance of natural fiber composites (jute–epoxy) and synthetic composites (fiberglass–epoxy) to conventional masonry units (blocks and bricks) under identical stress circumstances and shape.
Insufficient Description of FEA Methodology: Mesh size - Smoothing (High); transiting (Fast); initial size seed (Active); relevance center (Fine); middle of the span angle (Fine); 90 mm is the minimum edge length; 542772 elements and 23057 nodes, respectively.
3.1 Deformation behaviour and structural stiffness
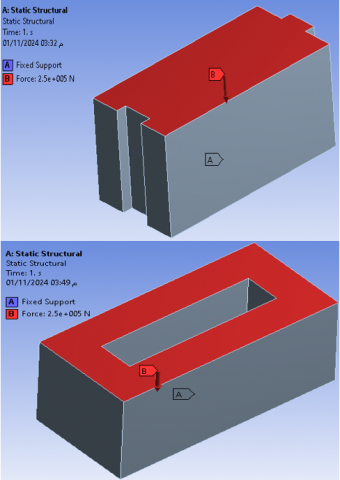
Static structural analysis models created with the engineering simulation program ANSYS are depicted in the Figure 2.
One side of both models (designated A and indicated in blue) has a fixed support condition, which means that this face is totally fixed and cannot move or rotate.
The upper surface (designated B and indicated in red) receives a focused force (Force = 25 MN). The mechanical load applied to the model is represented by this force.
Left model: Usually employed to minimize weight while preserving rigidity, this design style has longitudinal chambers at the bottom that change the body's stress distribution.
The right model has a rectangular cavity that is open at the top. It may be used to transfer other elements through it or to reduce weight. It displays distinct structural behavior in terms of force and stress distribution.
The illustrations demonstrate the use of static structural analysis to the investigation of load effects on structures with different designs. To choose the most effective form in terms of strength and weight, the distribution of stresses and deformations between several designs will be compared.
Figure 2. Type, magnitude, and point of application of force
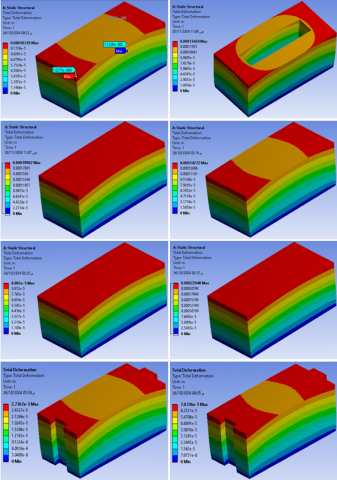
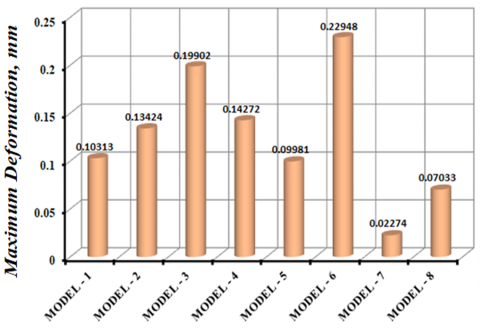
Following the construction of eight Solid Works models of a wall structure composed of various materials, the models were imported into ANSYS in order to apply loads and perform analysis using the finite element method. Following the results analysis process, the results are displayed in Figures 3-10. The results of the distribution and comparison of the deformation resistance in the eight models are displayed in Figures 3 and 4. The results clearly show that the sixth model with the biggest distortion (0.22948 mm) and the seventh model with the least deformation (0.02274 mm). Figures 3 and 4 display the highest deformation values for each of the eight models. It is noteworthy that Model-6, which is the least rigid of the models, recorded the highest deformation value (0.22948 mm). Models three and four came next, with respective values of 0.19902 mm and 0.14272 mm. Models 7 and 8 have the strongest resistance to deformation, as seen by the least amount of deformation (0.02274 mm) and 0.07033 mm, respectively. Model-2 (0.13424 mm) and Model-5 (0.09981 mm), two of the other models, have modest deformation and fall between these ranges. Overall, the graph demonstrates that the models' resistance to deformation differs greatly; Model-6 is the weakest and most prone to deformation, while Model-7 has the best stiffness.
Figure 3. The results of the deformations appear for every model
Figure 4. A comparison of the maximum deformation of the eight models
3.2 Stress-distribution analysis: von mises and principal stresses
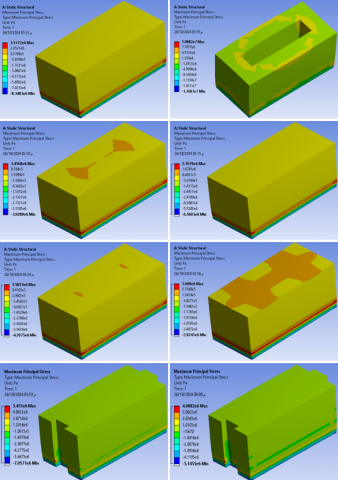
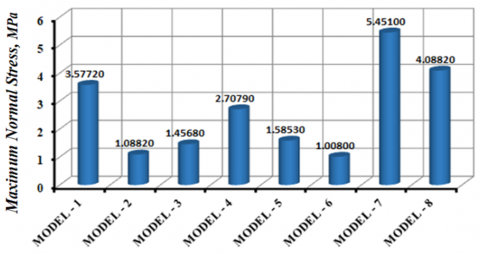
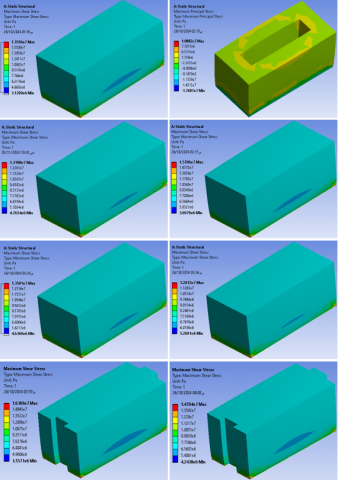
The distribution and comparison of the eight models' maximum normal stress are displayed in Figures 5 and 6. The results showed that the maximum normal stress was highest in the seventh model (5.451 MPa) and lowest in the sixth model (1.008 MPa). Figure 5-6 shows the highest normal stress values for each of the eight models. The highest value was 5.45100 MPa for Model-7, 4.08820 MPa for Model-8, and 3.57720 MPa for Model-1. Lower stress tolerance was indicated by the lowest values obtained by Models 2 (1.08820 MPa) and 6 (1.00800 MPa). Model-4 (2.70790 MPa), Model-5 (1.58530 MPa), and Model-3 (1.45680 MPa) were among the other models that were within the average range. The graphic, in summary, clearly contrasts the models; Models 2 and 6 are the least vulnerable to extreme stress, while Models 7 and 8 are the most.
Figure 5. For each model, the maximum principal stress results are displayed
Figure 6. Among all models, compare the maximum normal stress ($\sigma_{\max}$)
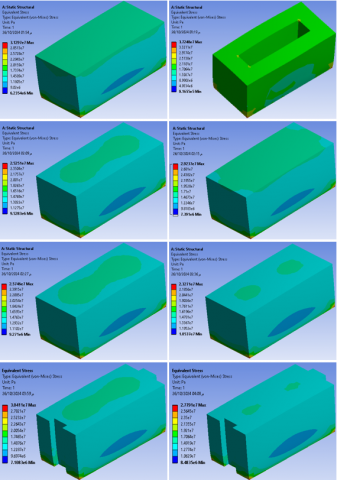
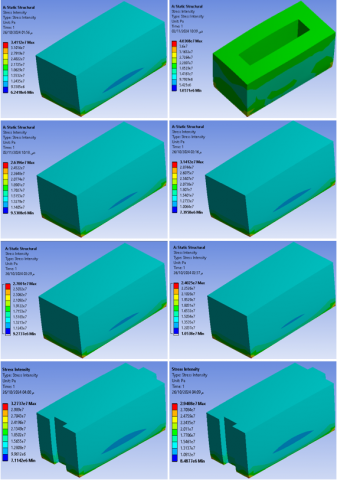
The distribution and comparison of the von Mises stresses ($\sigma_{v o n}$) for the eight models are displayed in Figures 7 and 8. The results showed that the maximum normal stress was highest in the seventh model (3.1041) and lowest in the sixth model (2.327 MPa).
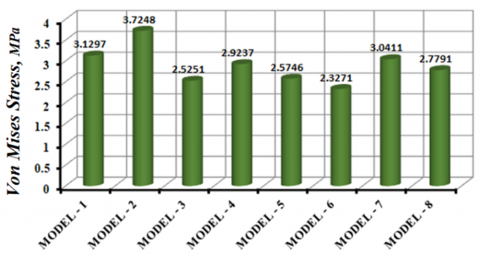
Figure 8 displays the highest von Mises stress values for each of the eight models. Model-2 had the highest value, 3.7248 MPa, which showed that it was most vulnerable to the same amount of stress. Model-7 (3.0411 MPa) and Model-1 (3.1297 MPa) came after it. These models were least impacted by stress, as seen by the lowest values found in Model-3 (2.5251 MPa) and Model-6 (2.3271 MPa). In the intermediate range (2.57–2.93 MPa) were the remaining models (Models 4, 5, and 8). As can be seen from the figure, von Mises stress was experienced by the majority of models within a rather narrow range, with Model-2 having the greatest value and Model-6 exhibiting the best resistance.
Figure 7. The results of the von Mises stresses appear for every model
Figure 8. Compare the von Mises stress ($\sigma_{v o n}$), for each model
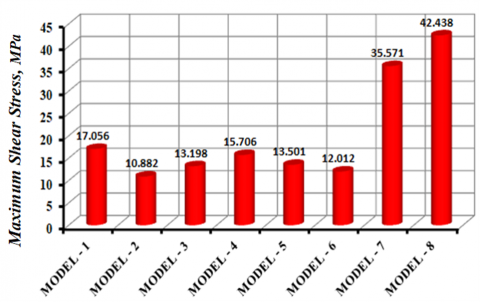
Figures 9 and 10 show the distribution and comparison of the maximum shear stresses for each of the eight models. maximum shear stress was found to be the highest in the eighth model (42.44 MPa) and the lowest in the second model (10.88 MPa). Figure 10, shows the maximum shear stress values in MPa for each model, ranging from MODEL-1 to MODEL-8. The values that were obtained from the figure are as follows: It is evident that models 2–6 showed comparatively low and stable values (between 10 and 17 MPa), whereas models 7 and 8 showed much higher maximum shear stress values (36 and 42 MPa, respectively). Accordingly, models 7 and 8 might be more vulnerable to high loads and so need more research or better design.
Figure 9. The results of the maximum shear stresses appear for every model
Figure 10. Among all models, compare the maximum shear stresses ($\tau_{\max}$)
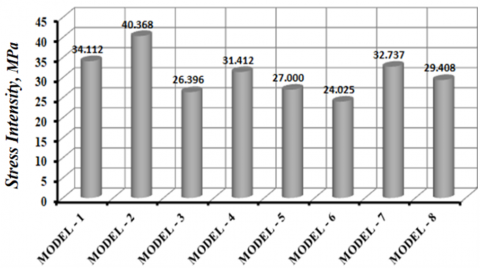
Figures 11 and 12 show the distribution and comparison of the Stresses Intensity ($\tau_{\max}$) for the eight models. According to the results, the sixth model had the lowest maximum Stresses Intensity (24.03 MPa) and the second model had the highest (40.37). Figure 12 displays the following:
1. MODEL-2 was found to have the greatest stress value (40.368 MPa), suggesting that it is the most stressed model.
2. MODEL-6, which reduces stress intensity the best, had the lowest stress value (24.025 MPa).
3. Models that fall into the middle range are MODEL-3 (26.396 MPa), MODEL-5 (27.0000 MPa), and MODEL-8 (29.408 MPa). These values are below 30 MPa, indicating that they perform good concentration reduction.
4. While other models, such MODEL-1 (34.112 MPa) and MODEL-7 (32.737 MPa), showed comparatively high values, they fall short of MODEL-2.
5. The models can generally be ordered as follows, going from best (lowest stress) to worst (highest stress): Models six, three, five, eight, four, seven, one, and two.
In summary, MODEL-6 is the best for reducing stress-related concentration. The remaining models show intermediate behavior, with Models 3, 5, and 8 surpassing the others in lowering stress. Model-2 is the poorest when it comes to high stress intensity. The following is revealed by statistical analysis of the values in the figure: Average: around 30.68 MPa, the standard deviation is around 4.85 MPa. Variance: about 23.53, MODEL-6 minimum: 24.03 MPa, MODEL-2 Maximum: 40.37 MPa, Range: around 16.34 MPa.
Figure 11. The stress intensity results are displayed for each model
Figure 12. Among all models, compare the stresses intensity ($\sigma_{int}$)
In conclusion, the majority of models have distributions between 30 and 31 MPa, which is near the mean.
3.3 Strain-energy absorption and material toughness
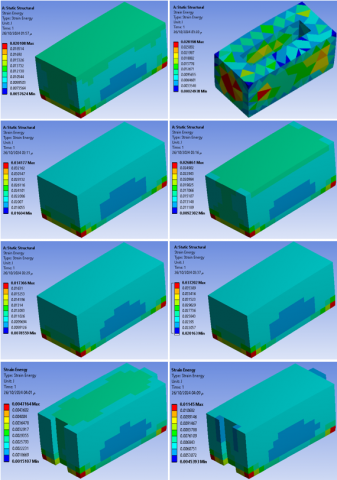
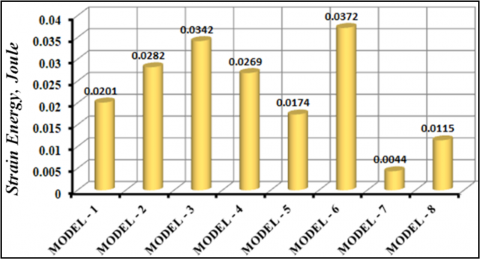
A comparison and distribution of the strain energy for each of the eight models are presented in Figures 13 and 14. Strain Energy was lowest in the seventh model (0.0043602 J) and highest in the sixth model (0.0372 J). The material's fracture mechanism, elasticity, and modulus of elasticity are to blame for this. Because of the formation and expansion of fissures in its component constituents, concrete fractures abruptly. The fibers and matrix that make up composite materials (jute and epoxy) offer a variety of energy absorption methods, including fiber pullout, matrix cracking, tensile strength, and fiber-matrix friction. A significantly higher energy absorption capacity before collapse is possible with this method. The strain energy estimates for eight distinct models are displayed in Joules in Figure 14. The figure clearly shows the following: MODEL-6 has the highest value (0.0372 J), which indicates the largest energy absorption, followed by MODEL-3 (0.0342 J). It stores the least strain energy, as seen by the lowest value in MODEL-7 (0.0044 J) and MODEL-8 (0.0115 J). The remaining models stand for intermediate levels and range from 0.0174 to 0.0282 J (MODEL-1, 2, 4, and 5). In summary, the strain energy of MODEL-6 is the largest, whereas MODEL-7 has the lowest. In terms of relative similarity, the remaining models are dispersed between the two values. In order to connect strain energy to stress intensity, we compare the results of the figure (stress) and observe the following:
Figure 13. The strain energy results are displayed for each model
Figure 14. Among all models, compare the strain energy ($\varepsilon_{\text {energy}}$)
1. Highest-value models: MODEL-2: modest strain energy (0.0282 J) but maximum stress (40.368 MPa). MODEL-6: significant strain energy (0.0372 J) but relatively low stress (24.025 MPa). This illustrates that a model's heightened capacity to absorb and store energy may be reflected in its low stress, which does not necessarily translate into low strain energy.
2. The lowest-valued models: MODEL-7: Its elasticity and energy absorption are weaker because to its high stress (32.737 MPa) and lowest strain energy (0.0044 J). MODEL-8: Below-average performance with medium stress (29.408 MPa) and low strain energy (0.0115 J).
3. Equilibrium Models: Models 3 and 4 exhibit good balance with medium stress values (26–31 MPa) and somewhat high strain energies (0.0342 and 0.0269 J).
3.4 Integrated performance comparison and practical implications
Models 2, 3, 4, and 6 all exhibited notable declines in strain energy ratios (40.23, 69.97, 33.58, and 85.00%) compared to Model 1, however Models 5, 7, and 8 showed increases (13.64, 78.32, and 43.06%). This is due to the elasticity and modulus of elasticity. First, concrete is a brittle material and has a high stress tolerance, but it collapses quickly without a high capacity for deformation. In contrast, the jute-epoxy composite material has greater elasticity, which in turn allows it to absorb and dissipate greater energy through deformation before it breaks. Second, the modulus of elasticity of concrete is higher than that of the jute-epoxy composite material, which allows it to deform before failure (i.e., increased strain energy).
Eight Solid Works models were created using different materials, then the models were moved to the ANSYS programs, loads were applied, and the results were studied. Based on the research findings, the following conclusions can be drawn:
By comparing the results of the seven models with the first model, it can be inferred from the deformation resistance results in the various models that the deformation ratios decreased by high ratios in the fifth, seventh, and eighth models, and by ratios of 3.22, 77.95, and 31.80%, respectively. In contrast, the second, third, fourth, and sixth models all had higher deformation resistances by the following ratios: 30.17, 92.98, 38.39, and 122.52%, respectively.
The maximum normal stress ratios decreased significantly in the second, third, fourth, fifth, and sixth models (69.58, 59.28, 24.30, 55.68, and 71.82%), respectively, when comparing the outcomes of the seven models with the first model. On the other hand, the maximum normal stress increased by 52.38 and 14.28% in the seventh and eighth models respectively.
In contrast to the first model, the outcomes of the seven models, the Von Mises Stresses ratios decreased considerably in the third, fourth, fifth, sixth, and eighth models (19.32, 6.58, 17.74, 25.64, 2.82, and 11.2%, respectively). However, in the second models, increased by 19.01%.
Comparing the first model to the maximum shear stress ratios in the second, third, fourth, fifth, and sixth models all saw significant decreases (36.20, 22.62, 7.92, 20.84, and 29.57%, respectively), while in the seventh and eighth models increased (108.55, 148.82%, respectively).
The stress intensity ratios in the third to eighth models all significantly decreased (22.62, 7.92, 20.85, 29.57, 4.03, and 13.79%) respectively in comparison to the first model, whereas they increased (18.34%) in the second model.
While the strain energy ratios in Models 5, 7, and 8 increased (13.64, 78.32, and 43.06%), they all significantly decreased (40.23, 69.97, 33.58, and 85.00%) in comparison to Model 1. This is due to the elasticity and modulus of elasticity: First of all, concrete is brittle and has a high stress tolerance, but it deforms poorly and collapses easily. The jute-epoxy composite material, on the other hand, is more elastic, allowing it to absorb and release more energy through deformation before breaking. Second, concrete can deform before failing because its modulus of elasticity is larger than that of the jute-epoxy composite material (i.e., increased strain energy).
Future studies
The researchers advise carrying out the following additional study in light of the findings:
[1] Li, Y., Li, W., Lin, X., Yang, M., et al. (2019). Theoretical modeling of the temperature dependent tensile strength for particulate-polymer composites. Composites Science and Technology, 184: 107881. https://doi.org/10.1016/j.compscitech.2019.107881
[2] Bani, O., Humagai, B.K. (2024). Structural analysis and mass optimization of mobility walkers using lightweight polymer matrix composites. Precision Mechanics & Digital Fabrication, 1(3): 131-144. https://doi.org/10.56578/pmdf010302
[3] Muzel, S.D., Bonhin, E.P., Guimaraes, N.M., Guidi, E.S. (2020). Application of the finite element method in the analysis of composite materials: A review. Polymersm 12(4): 818. https://doi.org/10.3390/polym12040818
[4] Choi, C., Qaiser, N., Hwang, B. (2024). Mechanically pressed polymer-matrix composites with 3D structured filler networks for electromagnetic interference shielding application. Facta Universitatis, Series: Mechanical Engineering, 21(4): 601-614. https://doi.org/10.22190/FUME240601038C
[5] Ali, H.M., Najem, M.K., Karash, E.T., Sultan, J.N. (2023). Stress distribution in cantilever beams with different hole shapes: A numerical analysis. International Journal of Computational Methods and Experimental Measurements, 11(4): 205-219. https://doi.org/10.18280/ijcmem.110402
[6] Neto, F.L., Pardini, L.C. (2021). Compósitos Estruturais: Ciência e Tecnologia. Editora Blucher.
[7] Slamani, M., Chatelain, J.F. (2023). A review on the machining of polymer composites reinforced with carbon (CFRP), glass (GFRP), and natural fibres (NFRP). Discover Mechanical Engineering, 2(4). https://doi.org/10.1007/s44245-023-00011-w
[8] Katsoulis, C., Kandola, B.K., Myler, P., Kandare, E. (2012). Post-fire flexural performance of epoxy-nanocomposite matrix glass fibre composites containing conventional flame retardants. Composites Part A: Applied Science and Manufacturing, 43(8): 1389-1399. https://doi.org/10.1016/j.compositesa.2012.03.009
[9] Boumbimba, R.M., Froustey, C., Viot, P., Olive, J.M., Léonardi, F., Gerard, P., Inoubli, R. (2014). Preparation and mechanical characterisation of laminate composites made of glass fibre/epoxy resin filled with tri bloc copolymers. Composite Structures, 116: 414-422. https://doi.org/10.1016/j.compstruct.2014.05.028
[10] Martinelli, E., Napoli, A., Nunziata, B., Realfonzo, R. (2014). RC beams strengthened with mechanically fastened composites: Experimental results and numerical modeling. Polymers, 6(3): 613-633. https://doi.org/10.3390/polym6030613
[11] Devarajan, B., Lakshminarasimhan, R., Murugan, A., Rangappa, S.M., Siengchin, S., Marinkovic, D. (2024). Recent developments in natural fiber hybrid composites for ballistic applications: A comprehensive review of mechanisms and failure criteria. Facta Universitatis, Series: Mechanical Engineering, 13(4): 343-383. https://doi.org/10.22190/FUME240216037D
[12] Rimal, A., Natarajan, V.D. (2024). Comparative analysis of aerodynamic and structural performance of aircraft wings using boron aluminum metal matrix composites and aluminum alloys: A CFD and FSI approach. Precision Mechanics & Digital Fabrication, 1(2): 75-90. https://doi.org/10.56578/pmdf010203
[13] Fediuk, R., Mugahed Amran, Y.H., Mosaberpanah, M.A., Danish, A., El-Zeadani, M., Klyuev, S.V., Vatin, N. (2020). A critical review on the properties and applications of sulfur-based concrete. Materials, 13(21): 4712. https://doi.org/10.3390/ma13214712
[14] Klyuyev, S.V., Klyuyev, A.V., Lesovik, R.V., Netrebenko, A.V. (2013). High strength fiber concrete for industrial and civil engineering. World Applied Sciences Journal, 24(10): 1280-1285.
[15] Klyuyev, S.V., Klyuyev, A.V., Sopin, D.M., Netrebenko, A.V., Kazlitin, S.A. (2013). Heavy loaded floors based on fine-grained fiber concrete. Magazine of Civil Engineering, (3): 7-14. https://doi.org/10.5862/MCE.38.1
[16] Mayatskaya, I., Yazyev, B., Kuznetsov, V., Rusakova, E., Klyuev, S., Sabitov, L. (2022). Use of modern composite materials in construction and repair of structures. In International Scientific Conference Industrial and Civil Construction, Belgorod, Russia, pp. 346-355. https://doi.org/10.1007/978-3-031-44432-6_42
[17] Mayatskaya, I.A., Fedchenko, A.E. (2017). Strengthening the structures of architectural monuments using polymer composite materials. International Research Journal, 5(59): 346-355. https://doi.org/10.23670/IRJ.2017.59.124
[18] Phiri, R., Rangappa, S.M., Siengchin, S., Marinkovic, D. (2023). Agro-waste natural fiber sample preparation techniques for bio-composites development: Methodological insights. Facta Universitatis, Series: Mechanical Engineering, 21(4): 631-656. https://doi.org/10.22190/FUME230905046P
[19] Department of Energy. (2015). Chapter 5: Increasing efficiency of building systems and technologies. In Quadrennial Technology Review: An Assessment of Energy Technologies and Research Opportunities, pp. 143-181. https://www.energy.gov/sites/prod/files/2017/03/f34/qtr-2015-chapter5.pdf.
[20] Santoso, A.H., Ola, F.B., Sekarlangit, N. (2022). Comparison of conventional materials with advance materials to operational costs and energy efficiency based on Sefaira. In Proceedings of the International Webinar on Digital Architecture 2021 (IWEDA 2021), pp. 230-235. https://doi.org/10.2991/assehr.k.220703.042
[21] Monfared, V., Ramakrishna, S., Alizadeh, A.A., Hekmatifar, M. (2023). A systematic study on composite materials in civil engineering. Ain Shams Engineering Journal, 14(12): 102251. https://doi.org/10.1016/j.asej.2023.102251
[22] Kuzina, E., Cherkas, A., Rimshin, V. (2018). Technical aspects of using composite materials for strengthening constructions. IOP Conference Series: Materials Science and Engineering, 365(3): 032053. https://doi.org/10.1088/1757-899X/365/3/032053
[23] Ahammed, M.R., Mia, M.B., Raihan, M.A., Nayim, M., Hossain, M.H., Hasan, S.M. (2023). An overview of conventional construction materials and their characteristics. North American Academic Research, 7(1): 1-14. https://doi.org/10.5281/zenodo.10579091
[24] Adeola, O.O., Alfa, M.T. (2018). The role of advance composite material in contemporary buildings. Journal of Contemporary Urban Affairs, 2(3): 95-101. https://doi.org/10.25034/ijcua.2018.4723
[25] Karash, E.T., Sediqer, T.A.A., Kassim, M.T.E. (2021). A comparison between a solid block made of concrete and others made of different composite materials. Revue des Composites et des Matériaux Avancés-Journal of Composite and Advanced Materials, 31(6): 341-347. https://doi.org/10.18280/rcma.310605
[26] Deb, A., Das, S., Mache, A., Laishram, R. (2017). A study on the mechanical behaviors of jute-polyester composites. Procedia Engineering, 173: 631-638. https://doi.org/10.1016/j.proeng.2016.12.120
[27] Rangasamy, G., Mani, S., Kolandavelu, S.K.S., Alsoufi, M.S., et al. (2021). An extensive analysis of mechanical, thermal and physical properties of jute fiber composites with different fiber orientations. Case Studies in Thermal Engineering, 28: 101612. https://doi.org/10.1016/j.csite.2021.101612
[28] Karash, E.T., Ali, H.M. Kassim, M.T.E. (2024). Designing cantilever models from various materials and comparing them when they are under constant load and have holes. Revue des Composites et des Matériaux Avancés-Journal of Composite and Advanced Materials, 34(3): 363-377. https://doi.org/10.18280/rcma.340312
[29] Karash, E.T., Sultan, J.N., Najem, M.K. (2022). The difference in the wall thickness of the helicopter structure are made of composite materials with another made of steel. Mathematical Modelling of Engineering Problems, 9(2): 313-324. https://doi.org/10.18280/mmep.090204
[30] Yahya, I.Z.A., Kaedhi, H.M., Karash, E.T., Najm, W.M. (2024). Finite element analysis of the effect of carbon nanotube content on the compressive properties of zirconia nanocomposites. International Journal of Computational Methods and Experimental Measurements, 12(3): 227-235. https://doi.org/10.18280/ijcmem.120304
[31] Najem, M.K., Karash, E.T., Sultan, J.N. (2022). The amount of excess weight from the design of an armored vehicle body by using composite materials instead of steel. Revue des Composites et des Matériaux Avancés-Journal of Composite and Advanced Materials, 32(1): 1-10. https://doi.org/10.18280/rcma.320101
[32] Gattea, H.I. (2013). Evaluation of thermal and mechanical properties of the bricks. The Iraqi Journal for Mechanical and Material Engineering, 13(2): 340-349. https://iasj.rdd.edu.iq/journals/uploads/2024/12/23/392761c1cb372f345689ab4d0d6749da.pdf.
[33] Wu, Z., Chen, W. (2009). A higher-order displacement model for stress concentration problems in general lamination configurations. Materials & Design, 30(5): 1458-1467. https://doi.org/10.1016/j.matdes.2008.08.013