Zaid Lawi. Hadi*![]() | Aneed Maher Lafta
| Aneed Maher Lafta![]() | Bahaa Fakhry Shehab
| Bahaa Fakhry Shehab![]()
© 2025 The authors. This article is published by IIETA and is licensed under the CC BY 4.0 license (http://creativecommons.org/licenses/by/4.0/).
OPEN ACCESS
Spray pyrolysis synthesized Ag nanoparticles decorated with a thin ZnO Films on a glass substrate. The samples created were examined using several characterization methods to assess their phase formation, surface appearance, and elemental composition. According to X-ray diffraction studies, ZnO and Ag2O Crystallize hexagonally and cubically, respectively. Based on FE-SEM analyses, the average particle size was 68 nm, with coral-like formations occurring. In a 0.1 Ag/ZnO Ratio, the bandgap decreased by 4.6%. Based on FTIR analysis, ZnO and Ag2O Display distinctive spectral lines centered at 453 cm-1 and 510 cm-1, respectively. UV-vis spectroscopy revealed a red shift as Ag concentrations increased. Detection limits of 10 to 100 parts per million have been achieved using ZnO and Ag/ZnO in gas sensor experiments. Alternatives include NO2 Sensors, which respond much faster when heated to 573°K. Due to this, the NO2 sensor uses the available resources efficiently.
Zinc oxide, Ag/ZnO thin films, gas sensing, spray pyrolysis
Silver oxide, Ag2O is effective in gas sensing due to; High surface reactivity—Ag atoms catalyze gas adsorption/desorption reactions. Ag2O is p-type semiconductor behavior—enhances charge carrier modulation during gas exposure. In addition to good conductivity and redox properties, Ag2O can exchange electrons rapidly with target gases, improving sensitivity and response time [1]. Several factors affect the gas sensing process in conductometric semiconducting metal oxide sensors. Such as surface reactions, chemical components, surface modification, microstructures of sensing layers, temperature, and humidity, as these factors significantly affect the sensitivity of Ag/ZnO gas sensing devices [2]. Due to industrialization and rapid economic growth, toxic, explosive, flammable, and hazardous gases have significantly increased [3]. Zinc oxide (ZnO) is a wide-bandgap semiconductor with excellent electrical and optical properties. It has been extensively investigated for gas sensing applications due to its high sensitivity, low cost, and stability at elevated temperatures [4]. ZnO sensors can detect gases such as NO2, CO, NH3, and H2 [5]. Silver dioxide (Ag2O) is another material considered for gas-sensing applications. Like ZnO, it is a semiconductor, and its properties can be tailored to enhance its gas-sensing capabilities [6]. As a result of their gas-sensing properties, ZnO and Ag2O have been the subject of several investigations. In contrast, ZnO has a larger bandgap and is less vulnerable to environmental changes due to its high electrical conductivity [7]. When ZnO and Ag2O are mixed, the resulting nanocomposite can exhibit improved gas-sensing performance over either material alone. This is due to the formation of a heterojunction between the two materials, which creates a region of high electric field sensitive to molecules [8]. CdO to Ag2O can also improve the sensor selectivity, meaning it can be more specifically designed to detect a particular gas. For example, an Ag/ZnO sensor optimized for detecting O2 may respond lower to other gases such as H2S or NO2 [9]. It is an essential application where it is necessary to distinguish between different gases, such as in environmental monitoring or industrial safety [10]. Ag/ZnO nanocomposites offer a promising platform for developing next-generation gas sensors [11]. The combination of high sensitivity and selectivity ZnO improves the stability and tunability of Ag2O, making them well-suited for a wide range of applications [12]. The sensors can be worked at relatively low temperatures, saving energy, and extending the sensor's lifespan. The sensors are relatively inexpensive to fabricate and can be mass-produced [13]. Ag/ZnO gas sensors are still under development, but they have the potential to revolutionize the way that detect and monitor gases in our environment [14]. Ag/ZnO thin films were deposited via several techniques such as spray pyrolysis [15], Sputtering [16], electron-beam evaporation [17], PLD [18], ALD [19], Sol-Gel [20], spin coating [21], and others [22]. The synthesis method of Ag/ZnO nanocomposites using spray pyrolysis has gained much attention due to its simplicity, reproducibility, and scalability [23]. ZnO has a wide bandgap semiconductor and has been widely studied for gas sensing applications due to its high sensitivity, selectivity, and stability in detecting various gases [24]. However, to improve ZnO sensing properties, Ag doping has been proposed [25]. Thus, the Ag/ZnO nanocomposites synthesized using spray pyrolysis have immense potential in gas sensing applications due to their high sensitivity, selectivity, and stability [26]. Ag/ZnO nanocomposites have shown promising results in gas sensing applications due to their increased surface area, enhanced catalytic activity, and high electron mobility [27]. The present study aims to investigate the Ag/ZnO gas sensing for NO2 with Ag varying.
The Ag/ZnO films were deposited onto glass slides using a standard spray pyrolysis setup under ambient atmospheric conditions. High-purity substances from Sigma-Aldrich were used to prepare an aqueous stock solution of Zn-acetate and Ag-acetate, which were then combined in various ratios to fabricate thin films of ZnO and Ag/ZnO. The stock solutions used in the deposition process were prepared with double-distilled water to ensure high purity. These solutions were subsequently delivered onto preheated substrates via a custom-designed glass nozzle.
During the spraying process, the droplets rapidly evaporated, leading to solute condensation and subsequent thermal decomposition, thereby yielding a uniform thin film composed of ZnO and Ag/ZnO. Several preparative parameters were systematically optimized during synthesis to achieve uniform, adherent, and pinhole-free films. The key parameters controlled included solution volume (30 mL), spray rate, nozzle-to-substrate distance (30 cm), and carrier gas flow, which was kept at a pressure of 5 bar. The substrate temperature remained constant throughout all depositions.
The complete spraying process was conducted over approximately 20 minutes. To tailor the film properties, various atomic ratios were investigated, with particular emphasis in an Ag:Zn ratio of 2:1 for this study. Microstructural characterization was conducted via X-ray diffraction (XRD) using a Shimadzu XRD 6000 diffractometer, with diffraction patterns collected in the 2θ range of 30°–60°. Optical properties were assessed using a Shimadzu SP-8001 computerized spectrometer, covering wavelengths from 190 to 1050 nm (UV to NIR region). Surface morphology was examined through field emission scanning electron microscopy (FESEM, JEOL JSM-7600F), and stoichiometry was figured out by energy-dispersive X-ray spectroscopy (EDX). Fourier-transform infrared (FTIR) spectra were obtained using a Shimadzu IR Prestige-21 spectrophotometer.
Due to gas sensing studies, mesh-patterned aluminum electrodes were thermally evaporated onto the thin films using an Edwards Coating System. Gas detection experiments were carried out in a sealed, temperature-controlled chamber fitted with thermocouples. An oxidizer was introduced as the oxidizing agent within the gas-filled chamber. Sample resistance was continuously monitored by connecting a laptop to a multimeter, with resistance measurements recorded at specified intervals. The chamber atmosphere was precisely controlled to keep the desired gas concentration, thereby simulating specific experimental conditions.
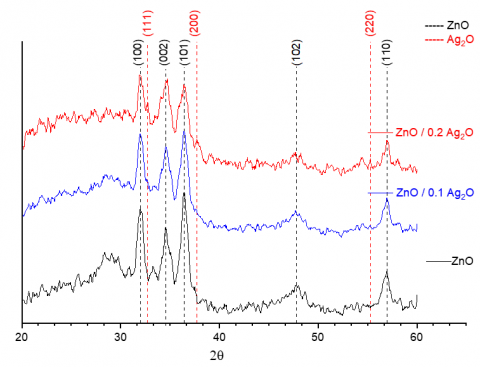
The crystallinity of thin films was characterized by X-ray diffraction. The XRD patterns of thin films were analyzed to determine the crystal structure, phase composition, and orientation of the crystallites. The results revealed a high degree of crystalline phases, as presented in Figure 1. A polycrystalline hexagonal phase was observed in the deposited samples for ZnO and a cubic phase for Ag2O. Figure 1 shows the data indicates that the reflection peaks of ZnO primarily occur along directions related to the crystallographic planes 100, 002, 101, 102, and 110. These planes correspond to reflection angles of 31.77°, 34.54°, 36.41°, 47.87°, and 56.96°, respectively. The XRD results agreed with Naqvi et al. [28] and Cai et al. [29]. XRD patterns were examined to match the crystallography card No. (96-210-7060) for ZnO [30]. Meanwhile, XRD analysis of the mixture 0.1 Ag showed 2$\theta$ = 36.41° and 55.30° at planes 200 and 220, respectively. While at mixture (0.2 Ag) showed 2$\theta$ = 32.67°, 37.76°, and 54.51°) at planes 111, 200, and 220, respectively. The CdO samples aligned with crystallographic diffraction data No. (96-101-0605) [31]. A decent similarity exists between the observed and reported values of d-spacing. The collected d-spacing values were observed with about 98% accuracy in calculations that agree with Ling et al. [7] and Yang et al. [9]. Crystallite size (D) was determined from the FWHM of the XRD spectrum using the Debye-Scherrer formula [32].
Figure 1. XRD patterns for ZnO and (0.1, 0.2) Ag2O deposited films
Regarding Figure 1, expression data is listed in Table 1. Data were recorded and plotted on the same intensity scale 20°-60° to highlight differences between planned patterns, along with full-width half maximum, d-spacing, crystallite size, and crystal planes (hkl).
$\mathrm{D}_{\mathrm{hkl}}=\frac{\mathrm{K} \lambda}{\beta \cos \left(\theta_{\mathrm{hkl}}\right)}$ (1)
Table 1. XRD parameters of deposited Zno at different Ag/Zno
|
|
2θ (Deg.) |
FWHM (Deg.) |
dhkl (Å) |
C.S (nm) |
hkl |
|
ZnO |
31.77 |
0.7326 |
2.8067 |
11.3 |
100 |
|
34.54 |
0.7692 |
2.5892 |
10.8 |
002 |
|
|
36.41 |
0.6960 |
2.4715 |
12.0 |
101 |
|
|
47.87 |
1.5751 |
1.9054 |
5.5 |
102 |
|
|
56.96 |
0.8791 |
1.6183 |
10.3 |
110 |
|
|
ZnO / (0.1) Ag |
31.97 |
0.6594 |
2.8067 |
12.5 |
100 |
|
32.71 |
0.4762 |
2.7355 |
17.4 |
002 |
|
|
34.65 |
0.8059 |
2.4715 |
10.3 |
101 |
|
|
36.37 |
0.9524 |
2.4680 |
8.8 |
101 |
|
|
47.58 |
1.1355 |
1.9095 |
7.6 |
102 |
|
|
36.41 |
0.6228 |
2.4656 |
13.4 |
200 |
|
|
55.30 |
0.8059 |
1.6811 |
11.1 |
220 |
|
|
ZnO / (0.2) Ag |
31.97 |
0.6594 |
2.7965 |
12.5 |
100 |
|
34.61 |
0.9890 |
2.5892 |
8.4 |
002 |
|
|
36.37 |
0.9524 |
2.4680 |
8.8 |
101 |
|
|
47.58 |
1.1355 |
1.9095 |
7.6 |
102 |
|
|
56.95 |
0.8059 |
1.6154 |
11.2 |
110 |
|
|
32.73 |
0.4029 |
2.7385 |
20.6 |
111 |
|
|
37.71 |
0.6594 |
2.3802 |
12.7 |
200 |
|
|
55.30 |
0.8425 |
1.6822 |
10.6 |
220 |
Assuming $\beta$ is the wavelength of the X-ray beam, Bragg's angle $\theta$, and $\beta$ is the FWHM of diffracted X-rays in radians.
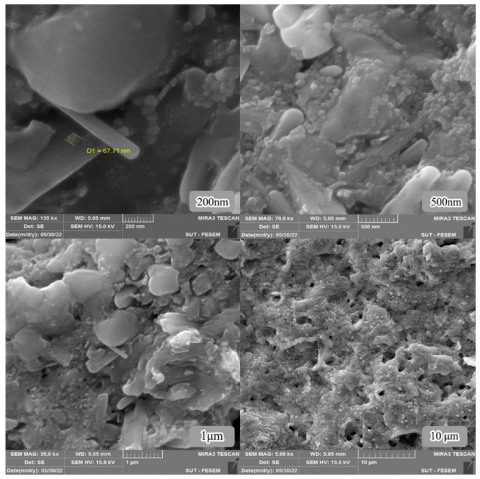
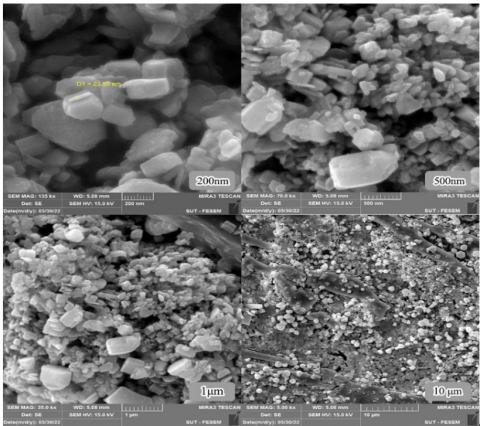
Figure 2 shows the morphology of a ZnO thin layer that was examined via FESEM. Meanwhile, the average particle size of ZnO is around 68 nm. Figure 3 displays the morphology of the ZnO and Ag/ZnO. It is worth noting that a distinct nanostructure was detected at Ag (0.1).
Figure 2. FESEM image of ZnO of the deposited thin films
Figure 3. FESEM image of ZnO 0.1 Ag2O and ZnO 0.2 Ag2O thin films
The particle size distribution reveals that the particles fall within a range of 67 nm, with an average diameter of 70 nm, determined using ImageJ software.
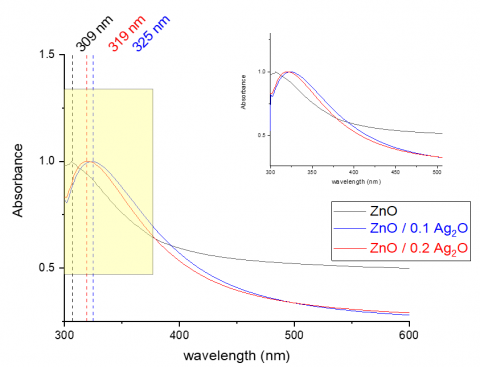
The deposited films exhibited thicknesses ranging from 195 to 200 nm, measured using the Fizeau method with a green laser operating at a wavelength of 532 nm [33]. Absorption measurements were conducted to gather information on Ag/ZnO. Meanwhile, Figure 4 shows the optical absorption of the prepared sample. It was apparent that redshift was taking place as the amount of Ag2O increased.
Figure 4. Absorption lines of ZnO and Ag/ZnO
Absorption Lines of ZnO and Ag/ZnO; the UV-Vis absorption spectra of the synthesized thin films reveal distinct optical transitions for ZnO and Ag-doped ZnO (Ag/ZnO) nanocomposites. The absorption edge of pure ZnO appears around 309 nm, consistent with its wide direct bandgap (~3.21eV), characteristic of wurtzite ZnO semiconductors. Upon doping with Ag (0.1 and 0.2 molar ratios), the absorption spectra exhibit a redshift, with absorption edges shifting to longer wavelengths 319nm and 325 nm, respectively.
The reason for the shift in Transmittance Intensity with Increasing Ag2O Content due to the concentration of Ag2O in the ZnO thin films increases, a decrease in transmittance intensity is observed, particularly in the UV-visible range. This behavior can be attributed to the following factors: Increased light absorption due to plasmonic effects, bandgap narrowing and redshift, increased defect states and scattering centers, optical density increase [25].
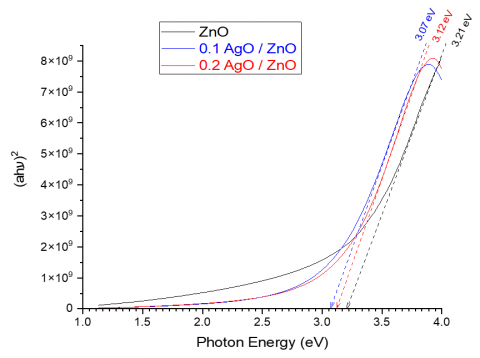
Tauc formula [34] was employed to plot (αhν)2 vs (hν) as bandgap calculations that presented in Figure 5. This shift indicates a narrowing of the optical bandgap, calculated via Tauc plots to be 3.12eV for 0.2 Ag/ZnO and 3.07eV for 0.1 Ag/ZnO, compared to 3.21eV for undoped ZnO. The redshift and bandgap reduction can be attributed to: Localized Surface Plasmon Resonance (LSPR) effects from Ag nanoparticles, Defect states and impurity levels introduced into the ZnO band structure, Enhanced charge carrier interactions at the Ag/ZnO heterointerface [35]. These modifications in the optical absorption behavior suggest improved light-matter interaction and potential enhancement in charge transfer processes favorable for gas sensing applications, especially in detecting oxidizing gases like NO2.
Figure 5. Energy bandgap of ZnO and Ag/ZnO
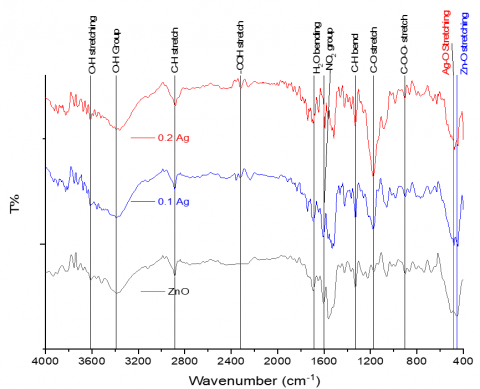
The FTIR spectrum is illustrated in Figure 6, showing that finding is consistent with the information provided by the study [36]. At 0.1 Ag, the bandgap decreased by 4.4%, which is promising for thin film sensing applications. The 3607,3391 cm-1 bands show stretching vibrations of the hydroxyl groups as O-H is present in all samples [37]. The C-H bond was reported to be in the stretching mode with a frequency of 2880 cm-1 [38]. A minor absorption peak at 2321 cm-1 Indicates the occurrence of -COH stretching bond [39]. The bending vibration modes of H2O observed at 1690 cm-1 as mentioned by Carpenter et al. [40]. An investigation -products resulting from the chemical reactions emitted in the form of NO2, which exhibited a vibrational frequency of 1602 cm-1 [41]. Other by-products showed a C-O stretching vibration at a wavenumber of 1176 cm-1, while C-O-O was seen at 903 cm-1 [42]. The targeted metal oxides have appeared in the FTIR fingerprint region. Zn-O bond materialized at 453 cm-1 as documented by Sowri Babu et al. [43]. The metal oxides of interest have been noticed within the fingerprint region of the FTIR. The formation of a Zn-O bond is seen at a wavenumber of 453 cm-1 As reported by Sowri Babu et al. [43]. In contrast, a discernible fingerprint corresponding to the Ag-O bond was detected at a wavelength of 519 cm-1 [44].
Figure 6. FTIR spectroscopy of ZnO and Ag/ZnO
As part of the sensing process, gas detection is influenced by surface regulation. At the same time, chemisorbed oxygen contributes to surface resistance. However, the reaction mechanism involved is quite complex, involving multiple intermediate steps. As displayed in Figure 7, ZnO and Ag/ZnO samples react with NO2. The measurements were carried out at three distinct operating temperatures 100, 200, and 300℃, in conjunction with their corresponding response and recovery durations. The gas sensing data were conducted with low detection limits ranging from 10 to 100 ppm. The results of the gas sensing examination are listed in Table 2, showing the response time and recovery time at the operating temperature. Furthermore, the sensitivity of the prepared samples was calculated using Eq. (2) [45].
$S \%=\frac{R_{{gas }}-R_{{air }}}{R_{ {air }}} \times 100 \%$ (2)
According to the equation above, Rair and Rgasrefer to the deposited sample's resistance in air and an examining gas, respectively.
Table 2. Gas sensing examination, sensitivity, response, and recovery time
|
Sample |
Temperature (℃) |
Sensitivity% |
Response Time (s) |
Recovery Time (s) |
|
ZnO |
100 |
16.7 |
20.0 |
60.0 |
|
200 |
31.0 |
25.0 |
40.0 |
|
|
300 |
24.9 |
20.0 |
30.0 |
|
|
ZnO / (0.1) Ag |
100 |
31.4 |
20.0 |
50.0 |
|
200 |
68.0 |
20.0 |
60.0 |
|
|
300 |
35.4 |
20.0 |
40.0 |
|
|
ZnO / (0.2) Ag |
100 |
13.3 |
15.0 |
60.0 |
|
200 |
25.8 |
22.0 |
80.0 |
|
|
300 |
28.2 |
30.0 |
70.0 |
Figure 7 illustrates the variation in resistance during the gas examination. Based on the results in Figure 7, the 0.1 Ag/ZnO sample possesses the highest sensitivity among all the specimens prepared.
Figure 7. Sensitivity of samples vs. temperature
The sensing explanation of limit of detection for NO₂ as the manuscript mentions that the gas sensors based on ZnO and Ag/ZnO thin films were tested with NO₂ concentrations ranging from 10 to 100 ppm, but it does not explicitly state the minimum concentration at which a reliable detection was achieved. Where The 0.1 Ag/ZnO composition showed the highest sensitivity (68% at 200℃), likely due to an optimal balance between catalytic activity and charge carrier mobility.
The present study successfully demonstrates the fabrication and characterization of Ag-decorated ZnO thin films using the spray pyrolysis technique, with a focus on their gas sensing capabilities. The incorporation of Ag2O into ZnO matrices leads to notable modifications in structural, optical, and morphological properties, as evidenced by XRD, UV-Vis, FTIR, and FESEM analyses. Specifically, Ag doping results in a measurable redshift in optical absorption and a reduction in bandgap energy—factors that are beneficial for enhancing charge carrier dynamics during gas interactions. From a physicist’s viewpoint, the formation of heterojunctions between Ag2O and ZnO induces localized electric fields and improves electron transfer at the interface, which explains the observed increase in sensor response, particularly at the optimized 0.1 Ag/ZnO ratio. The enhanced sensitivity and selectivity to NO₂ gas at 200℃ underscore the synergistic effects of Ag doping on ZnO’s semiconducting behavior. The study provides valuable insights into the interplay between material structure and electronic behavior in nanoscale gas sensors. It reinforces the importance of doping-induced band structure engineering as a tool to modulate sensing performance. The findings suggest that Ag/ZnO nanocomposites are viable candidates for the development of energy-efficient, selective, and scalable gas sensors suitable for environmental monitoring applications.
[1] Navale, S., Shahbaz, M., Mirzaei, A., Kim, S.S., Kim, H.W. (2021). Effect of Ag addition on the gas-sensing properties of nanostructured resistive-based gas sensors: An overview. Sensors, 21(19): 6454. https://doi.org/10.3390/s21196454
[2] Chen, H., Bo, R., Qi, L., Dodd, A., Saunders, M., White, T., Tsuzuki, T., Tricoli, A. (2019). Ultrasensitive room-temperature chemical sensors by Ag-decorated ultraporous ZnO nanoparticle networks. In 2019 IEEE SENSORS, Montreal, QC, Canada, pp. 1-4. https://doi.org/10.1109/SENSORS43011.2019.8956926
[3] Navaneethan, M., Patil, V.L., Ponnusamy, S., Muthamizhchelvan, C., Kawasaki, S., Patil, P.S., Hayakawa, Y. (2018). Sensitivity enhancement of ammonia gas sensor based on Ag/ZnO flower and nanoellipsoids at low temperature. Sensors and Actuators B: Chemical, 255(1): 672-683. https://doi.org/10.1016/j.snb.2017.08.015
[4] Lafta, A.M., Hadi, Z.L., Shehab, B.F. (2024). Gas sensing examination of CdO-% NiO thin films deposited via spraying process. Journal of Optics, pp. 1-8. https://doi.org/10.1007/s12596-024-02243-9
[5] Bhati, V.S., Hojamberdiev, M., Kumar, M. (2020). Enhanced sensing performance of ZnO nanostructures-based gas sensors: A review. Energy Reports, 6(4): 46-62. https://doi.org/10.1016/j.egyr.2019.08.070
[6] Jamal, R.K., Mutlak, F.A., Ibrahim, F.T., Nayef, U.M. (2020). Synthesis of Ag2O films by pulsed laser deposited on porous silicon as gas sensor application. Optik, 218: 164971. https://doi.org/10.1016/j.ijleo.2020.164971
[7] Ling, W., Lu, W., Wang, J., Niu, G., Zhu, D. (2021). Hydrothermal synthesis and characterization of Ag2O/CeO2 modified 3D flower-like ZnO as the N-butanol-sensing. Materials Science in Semiconductor Processing, 133: 105937. https://doi.org/10.1016/j.mssp.2021.105937
[8] Chen, Z.Y., Shao, W.Z., Li, W.J., Sun, X.Y., Zhen, L., Li, Y. (2023). Tuning the interface adhesion of Ag/ZnO composites by metallic dopants: A DFT study. Computational Materials Science, 224: 112151. https://doi.org/10.1016/j.commatsci.2023.112151
[9] Yang, T., Yang, Q., Xiao, Y., Sun, P., Wang, Z., Gao, Y., Ma, J., Sun, Y., Lu, G. (2016). A pulse-driven sensor based on ordered mesoporous Ag2O/SnO2 with improved H2S-sensing performance. Sensors and Actuators B: Chemical, 228: 529-538. https://doi.org/10.1016/j.snb.2016.01.065
[10] Phongpreecha, T., Nicholas, J.D., Bieler, T.R., Qi, Y. (2018). Computational design of metal oxides to enhance the wetting and adhesion of silver-based brazes on yttria-stabilized-zirconia. Acta Materialia, 152: 229-238. https://doi.org/10.1016/j.actamat.2018.04.024
[11] Liang, Y.C., Hsu, Y.W. (2022). Design of thin-film configuration of SnO2–Ag2O composites for NO2 gas-sensing applications. Nanotechnology Reviews, 11(1): 1842-1853. https://doi.org/10.1515/ntrev-2022-0111
[12] Cai, L.X., Miao, G.Y., Li, G., Chen, L., Meng, F.L., Guo, Z. (2021). A temperature-modulated gas sensor based on CdO-decorated porous ZnO nanobelts for the recognizable detection of ethanol, propanol, and isopropanol. IEEE Sensors Journal, 21(22): 25590-25596. https://doi.org/10.1109/JSEN.2021.3119951
[13] Umar, A., Ibrahim, A.A., Kumar, R., Algadi, H., Albargi, H., Alsairi, M.A., Alhmami, M.A.M., Zeng, W., Ahmed, F., Akbar, S. (2021). CdO–ZnO nanorices for enhanced and selective formaldehyde gas sensing applications. Environmental Research, 200: 111377. https://doi.org/10.1016/j.envres.2021.111377
[14] Agarwal, S., Kumar, S., Agrawal, H., Moinuddin, M.G., Kumar, M., Sharma, S.K., Awasthi, K. (2021). An efficient hydrogen gas sensor based on hierarchical Ag/ZnO hollow microstructures. Sensors and Actuators B: Chemical, 346: 130510. https://doi.org/10.1016/j.snb.2021.130510
[15] Lee, Y., Fujimoto, T., Yamanaka, S. (2022). Characterization of submicro-sized Ag/ZnO particles generated using the spray pyrolysis method. Advanced Powder Technology, 33(4): 103525. https://doi.org/10.1016/j.apt.2022.103525
[16] Chou, C.H., Nagarjuna, Y., Yang, Z.C., Hsiao, Y.J., Wang, S.C. (2022). Catalytic effect of Ag embedded with ZnO prepared by Co-sputtering on H2S gas sensing MEMS device. Vacuum, 202: 111210. https://doi.org/10.1016/j.vacuum.2022.111210
[17] Lungu, M.V., Sobetkii, A., Sobetkii, A.A., Pătroi, D., Prioteasa, P., Ion, I., Negrilă, C.C., Chifiriuc, M.C. (2018). Functional properties improvement of Ag-ZnO thin films using Inconel 600 interlayer produced by electron beam evaporation technique. Thin Solid Films, 667: 76-87. https://doi.org/10.1016/j.tsf.2018.09.055
[18] Yudasari, N., Dinata, I.K.H., Shearer, C.J., Blanco-Sanchez, P.H., Tresna, W.P., Suliyanti, M.M., Trilaksana, H. (2022). Laser-assisted deposition of Ag on self-sourced growth ZnO nanorods as reusable photocatalysts for water purification. Inorganic Chemistry Communications, 146: 110065. https://doi.org/10.1016/j.inoche.2022.110065
[19] Feng, S., Li, D., Low, Z.X., Liu, Z., Zhong, Z., Hu, Y., Wang, Y., Xing, W. (2017). ALD-seeded hydrothermally-grown Ag/ZnO nanorod PTFE membrane as efficient indoor air filter. Journal of Membrane Science, 531: 86-93. https://doi.org/10.1016/j.memsci.2017.02.042
[20] Mishra, S.K., Tripathi, U.K., Kumar, R., Shukla, R.K. (2022). Defects mediated optical emissions and efficient photodetection characteristics of sol–gel derived Ag-doped ZnO nanostructures for UV sensor. Materials Letters, 308(B): 131242. https://doi.org/10.1016/j.matlet.2021.131242
[21] Faisal, M., Bouzid, H., Harraz, F.A., Ismail, A.A., Al-Sayari, S.A., Al-Assiri, M.S. (2015). Mesoporous Ag/ZnO multilayer films prepared by repeated spin-coating for enhancing its photonic efficiencies. Surface and Coatings Technology, 263: 44-53. https://doi.org/10.1016/j.surfcoat.2014.12.063
[22] Özgür, Ü., Alivov, Y.I., Liu, C., Teke, A., Reshchikov, M.A., Doğan, S., Avrutin, V., Cho, S.J., Morkoç, A.H. (2005). A comprehensive review of ZnO materials and devices. Journal of Applied Physics, 98(4): 041301. https://doi.org/10.1063/1.1992666
[23] Tarwal, N.L., Patil, P.S. (2011). Enhanced photoelectrochemical performance of Ag–ZnO thin films synthesized by spray pyrolysis technique. Electrochimica Acta, 56(18): 6510-6516. https://doi.org/10.1016/j.electacta.2011.05.001
[24] Franco, M.A., Conti, P.P., Andre, R.S., Correa, D.S. (2022). A review on chemiresistive ZnO gas sensors. Sensors and Actuators Reports, 4: 100100. https://doi.org/10.1016/j.snr.2022.100100
[25] Dong, L.F., Cui, Z.L., Zhang, Z.K. (1997). Gas sensing properties of nano-ZnO prepared by arc plasma method. Nanostructured Materials, 8(7): 815-823. https://doi.org/10.1016/S0965-9773(98)00005-1
[26] Karyaoui, M., Jemia, D.B., Gannouni, M., Assaker, I.B., Bardaoui, A., Amlouk, M., Chtourou, R. (2020). Characterization of Ag-doped ZnO thin films by spray pyrolysis and its using in enhanced photoelectrochemical performances. Inorganic Chemistry Communications, 119: 108114. https://doi.org/10.1016/j.inoche.2020.108114
[27] Morales, C., Leinen, D., del Campo, A., Ares, J.R., Sánchez, C., et al. (2021). Growth and characterization of ZnO thin films at low temperatures: From room temperature to−120℃. Journal of Alloys and Compounds, 884: 161056. https://doi.org/10.1016/j.jallcom.2021.161056
[28] Naqvi, S.M.A., Soleimani, H., Yahya, N., Irshad, K. (2014). Structural and optical properties of chromium doped zinc oxide nanoparticles synthesized by sol-gel method. AIP Conference Proceedings, 1621(1): 530-537. https://doi.org/10.1063/1.4898517
[29] Cai, X., Hu, D., Deng, S., Han, B., Wang, Y., Wu, J., Wang, Y. (2014). Isopropanol sensing properties of coral-like ZnO–CdO composites by flash preparation via self-sustained decomposition of metal–organic complexes. Sensors and Actuators B: Chemical, 198: 402-410. https://doi.org/10.1016/j.snb.2014.03.093
[30] Albertsson, J., Abrahams, S.C., Kvick, Å. (1989). Atomic displacement, anharmonic thermal vibration, expansivity and pyroelectric coefficient thermal dependences in ZnO. Structural Science, 45(1): 34-40. https://doi.org/10.1107/S0108768188010109
[31] Wyckoff, R.W.G. (1922). The crystal structure of silver oxide (Ag2O). American Journal of Science, s5-3(15): 184-188. https://doi.org/10.2475/ajs.s5-3.15.184
[32] Debye, P., Scherrer, P. (1916). Interference of irregularly oriented particles in X-rays. Nachrichten von der Gesellschaft der Wissenschaften zu Göttingen, Mathematisch-Physikalische Klasse, 17: 277-283. https://eudml.org/doc/58947.
[33] Buckman, A.B., Kuo, C. (1978). Fizeau interferometry for measuring refractive index and thickness of nearly transparent films. Applied Optics, 17(22): 3636-3640. https://doi.org/10.1364/AO.17.003636
[34] Tauc, J., Grigorovici, R., Vancu, A. (1966). Optical properties and electronic structure of amorphous germanium. Physica Status Solidi (b), 15(2): 627-637. https://doi.org/10.1002/pssb.19660150224
[35] Mohammed, M.S., Kadhim, S.E. (2025). Gas sensor construction from Cu₃N thin films. Revue des Composites et des Matériaux Avancés-Journal of Composite and Advanced Materials, 35(3): 491-496. https://doi.org/10.18280/rcma.350310
[36] Mohammed, M.S., Kadhim, S.E. (2024). Study of the optical and structural properties of copper nanoparticles prepared via the electrochemical technique. Journal of Optics, pp. 1-6. https://doi.org/10.1007/s12596-024-02178-1
[37] Skheel, A.Z., Jaduaa, M.H., Abd, A.N. (2021). Biosynthesis and characterization of CdO nanostructure and its influence on cancer cells of (HT29). Journal of Physics: Conference Series, 1853(1): 012047. https://doi.org/10.1088/1742-6596/1853/1/012047
[38] Ghalmi, Y., Habelhames, F., Sayah, A., Bahloul, A., Nessark, B., Shalabi, M., Nunzi, J.M. (2019). Capacitance performance of NiO thin films synthesized by direct and pulse potentiostatic methods. Ionics, 25(12): 6025-6033. https://doi.org/10.1007/s11581-019-03159-2
[39] Bekiaris, G., Bruun, S., Peltre, C., Houot, S., Jensen, L.S. (2015). FTIR–PAS: A powerful tool for characterising the chemical composition and predicting the labile C fraction of various organic waste products. Waste Management, 39: 45-56. https://doi.org/10.1016/j.wasman.2015.02.029
[40] Carpenter, W.B., Fournier, J.A., Biswas, R., Voth, G.A., Tokmakoff, A. (2017). Delocalization and stretch-bend mixing of the HOH bend in liquid water. The Journal of Chemical Physics, 147(8): 084503. https://doi.org/10.1063/1.4987153
[41] da Silveira Petruci, J.F., Tütüncü, E., Cardoso, A.A., Mizaikoff, B. (2019). Real-time and simultaneous monitoring of NO, NO2, and N2O using substrate–integrated hollow waveguides coupled to a compact fourier transform infrared (FT-IR) Spectrometer. Applied Spectroscopy, 73(1): 98-103. https://journals.sagepub.com/doi/abs/10.1177/0003702818801371.
[42] Nandiyanto, A.B.D., Oktiani, R., Ragadhita, R. (2019). How to read and interpret FTIR spectroscope of organic material. Indonesian Journal of Science and Technology, 4(1): 97-118. https://ejournal.kjpupi.id/index.php/ijost/article/view/189.
[43] Sowri Babu, K., Ramachandra Reddy, A., Sujatha, C., Venugopal Reddy, K., Mallika, A.N. (2013). Synthesis and optical characterization of porous ZnO. Journal of Advanced Ceramics, 2(3): 260-265. https://doi.org/10.1007/s40145-013-0069-6
[44] Girsova, M.A., Golovina, G.F., Kurilenko, L.N., Anfimova, I.N. (2021). Infrared spectroscopy study of composite materials based on nanoporous high-silica glasses activated with silver and lanthanum ions. Glass Physics and Chemistry, 47(Suppl 1): S36-S40. https://doi.org/10.1134/S1087659621070051
[45] Tsai, Y.T., Chang, S.J., Ji, L.W., Hsiao, Y.J., Tang, I.T., Lu, H.Y., Chu, Y.L. (2018). High sensitivity of NO gas sensors based on novel Ag-doped ZnO nanoflowers enhanced with a UV light-emitting diode. ACS Omega, 3(10): 13798-13807. https://doi.org/10.1021/acsomega.8b01882