Israa S. Hussein*![]() | Naser A. Hassan
| Naser A. Hassan![]() | Mahmood Gazey Jassam
| Mahmood Gazey Jassam![]()
OPEN ACCESS
Water passing through gypseous soil mass dissolved and leached the gypsum slats, making the presence of these soils a problematic issue for important projects and buildings. By implementing the soil with three different stabilizer materials (cement = 8%, lime = 4%, and fly ash = 8%), this effort aims to improve gypseous soil's permeability and leaching properties. To study the influence of initial compacted moisture content on permeability and leaching, all the samples were compacted at their field unit weight with different initial compacted saturation levels (20%, 50%, and 70%). The constant head method used for the calculation of the permeability coefficient keeps the water flow through the soil sample in a glass cylinder constant for a long five days. The results show that compacting the treated soil up to a 50% saturation level leads to a clear decrease in permeability and leaching. The permeability coefficient decreased by about 17%, 27%, and 42% when compacted at initial saturation level of 20%, while decreased by about 76%, 84%, and 92% when compacted at an initial saturation level of 50% and compacting the treating soil at an initial saturation level of 70% decreases the permeability coefficient by about 88%, 95%, and 100% for soils combined with fly ash, lime, and cement, respectively. A statistical analysis was conducted on the experimental results. Non-linear regression analysis was used to derive the relationship between the input variables (degree of saturation, type of treated material, and time) and their effect on the permeability coefficient.
permeability, leaching, gypseous soils, initial saturation level, ANOVA analysis, non-linear regression
The region's most significant civil engineering issue is the enormous amount of gypsum in Iraqi soils. The primary issue is that gypseous soils are hollow structures. These yellow-colored soils can be found extensively in the region and include big gypsum crystals. Gypsum's enforcing action makes gypseous soils usually immune to dry conditions [1, 2]. However, soluble substances break down and considerably decrease the soil's resistance when moisture is incorporated because of partial or total soil saturation. This problem gets worse when the gypsum leaching from the water flow inside the soil causes a loss of soil bulk. Leaching is the process by which fluids permeate soil naturally or artificially, causing the soluble components to dissolve and be washed away, as in the study [3].
Changing the water content of soils that incorporate gypsum, a substance that binds soils, might expose them to specific issues. Building foundations on gypsum soils face significant challenges due to the flow of water through them.
Leaching is the process of extracting salts and other soluble minerals from soil by percolation and water table fluctuations. The removal of dissolved minerals and soluble salts changes the physicochemical and mechanical properties of the soil. The process is driven by either diffusion or a hydraulic gradient. Due to the continuous loss of mass and deterioration of the properties of the component parts during leaching and cementation removal between soil particles, gypseous soils undergo a variety of changes in their properties, as in the study [4].
The implications of additives on the permeability and leaching of gypseous soils have been the topic of multiple studies in previous decades. Improving the soil is very important to enhance its properties, decreasing permeability, increasing bearing capacity and decreasing settlement, as in these studies [5, 6].
Al-Abdullah and Al-Dulaimi [7] investigated the effects of diluting gypseous soil with a water solution of dihydrate calcium chloride (CaCl₂·2H₂O) on the soil's permeability, shear strength, leaching, compressibility, and compacting. The samples' engineering properties are significantly improved by immersing them in a calcium chloride solution at a 20% concentration. Major drops have been reported in compressibility, collapsibility, coefficient of permeability, percentage of dissolved gypsum, and leaching anxiety.
Moula and Farhan [8] demonstrated that adding a relatively modest amount of bentonite (3–20%) to granular gypseous soils can improve their ability to perform by increasing mechanical stability and permitting permeability. In a laboratory, the behavior of compacted soil-bentonite mixtures in leaching-collapse tests was examined. In comparison to untreated samples, the study showed that the permeability and solubility values of bentonite-treated gypseous soil improved by 9–30% for two different densities.
Asghari et al. [9] assessed the hydraulic and chemical properties of the soluble soils in the southern part of Mashhad Metropolitan, Iran, as well as how they change during the leaching process. Four basic groupings were formed by picking seven soil samples from the area with varying gypsum contents. To ascertain the extent of maximum gypsum and sulfuric ion concentration, the most common tests were chemical, physical, hydraulic (permeability and solubility), and statistical analysis. Permeability and leaching were investigated using a five-day leaching process. In the early stages of the trials, there was a great deal of variation in the permeability coefficient and the soil's mineral concentration. These fluctuations gradually decreased and tended to stabilize.
Aldaood et al. [10] investigated the effects of prolonged soaking and leaching on the mechanical properties of fine-grained soil with and without gypsum concentration. The soil samples were sealed for 28 days at 20℃ after being strengthened with 3% lime. The results show that leaching is a time-dependent process that negatively affects the integrity of soil samples that contain gypsum. Permeability increased noticeably during leaching. The increase was rapid, especially for unstabilized soil samples.
The impact of using the stabilizer additives (vehicle oil remnants and asphalt powder) to build a composite improvement material as a new technique was evaluated in this research [11] using constant head permeability tests. The effect of the composite material was investigated by combining a fixed amount of asphalt powder (10% of the sample weight) with three weights of burned oil (3%, 5%, and 7% by dry soil weight). The main findings indicate that the composite material may improve the gypseous soil and reduce the likelihood of collapse by forming an impermeable layer with a very fine texture that dramatically reduces the permeability coefficient.
Al-Gharbawi et al. [4] carried out some tests on two relative densities (35 and 75%) for pure gypseous soil and soil treated with magnesium oxide and carbonated magnesium oxide. The significance of soil behavior during leaching is examined using the oedometer permeability leaching test and the modified permeability leaching test. The findings show that, for samples with two relative densities and for both test types, applying 10% of three hours of carbonated magnesium oxide lowers the coefficient of permeability by more than 100% when compared to untreated soil.
Al Watar and Al-Kifae [12] looked at the use of inexpensive, locally available clayey soil to enhance the engineering qualities of gypseous soils and decrease the negative effects of soaking. To assess the impact of treating soil with varying clayey soil contents on permeability qualities, tests were conducted on both treated and untreated soil samples. For evaluation of any alterations in the parameters, the samples were put through the leaching procedure for five days. However, over time, these variations diminished, suggesting that gypseous soils' inherent permeability can be changed by applying clayey soil.
In the past, several studies were conducted to examine the effect of different additive materials on the leaching and permeability of gypseous soil. This study will explore the impact of the initial compacted saturation level on the permeability and leaching of natural and treated gypseous soil. The soil was treated with three additives: cement, lime, and fly ash compacted at its field unit weight, under three different initial water contents to achieve different starting saturation levels, 20, 50, and 70%. SPSS performed a one-way ANOVA to evaluate the effect of the initial saturation level on permeability and total soluble salts. In addition, Non-linear regression analysis was used to derive the relationship between the input variables and their effect on the permeability coefficient.
2.1 Gypseous soils
Samples of gypseous soil were imported from Tikrit City (Al-Qadisya discrete) for the purpose of this research. Figure 1 shows the spatial arrangement of sized particles in the soil. The specific characteristics of the soil samples undergoing study are outlined in Table 1.
Figure 1. The arrangement of gypsum's ground sample particle sizes
Table 1. Chemical and physical features obtained from samples of gypseous soil
|
Properties |
Values |
Detail Specifications |
|
Specific gravity Gs |
2.38 |
ASTM D-54 |
|
Natural water content (%) |
4.38 |
ASTM D-2216 |
|
Plastic limit |
N.P |
ASTM D-4318 |
|
Liquid limit |
N.L |
ASTM D-4318 |
|
Friction angle, φ (º) |
36.9 |
ASTM D-3080 |
|
Cohesion c (kPa) |
17.2 |
ASTM D-3080 |
|
D30 (mm) |
0.176 |
|
|
D10 (mm) |
0.073 |
|
|
D60 (mm) |
0.552 |
|
|
Unified classification system |
SP-SM |
ASTM D-2487 |
|
Coefficient of uniformity (Cu) |
7.42 |
ASTM D-4254 |
|
Coefficient of curvature (Cc) |
0.73 |
ASTM D-4254 |
|
Gypsum content (%) |
61.22 |
|
|
Ph-value |
7.64 |
|
|
Total sulphate content percent (SO3) |
65.6 |
|
|
Minimum dry unit weight (kN/m3) |
11.23 |
ASTM D-4254 |
|
Maximum dry unit weight (kN/m3) |
15.67 |
ASTM D-698 |
|
Permeability coefficient (cm/ sec) |
6*10-4 |
ASTM-2434 |
2.2 Hydrated lime
In this investigation, hydrated lime Ca(OH)2 from the Meshrag Sulphur Industry was utilized. The lime's chemical makeup is indicated in Table 2.
Table 2. The chemical makeup of lime
|
Content |
Percent (%) |
|
CaCO3 |
6.20 |
|
Al2O3 |
0.17 |
|
Ca (OH)2 |
71.30 |
|
Fe2O3 |
0.04 |
|
SiO2 |
11.10 |
|
CaO |
6.10 |
|
MgO |
4.19 |
|
H2O |
0.9 |
2.3 Cement
A typical type of hydraulic cement that is often employed in civil engineering and for construction is Portland cement. Clinker and additional essential components, such as clay and limestone, make up the vast majority of Portland cement. The primary component of Portland cement, a powder made by pulverizing a combination of coal, limestone, and clay at extremely high temperatures in a rotating kiln, is clinker. The particular physical properties of the cement utilized in the experiments and analyzed in Tikrit University's chemical engineering labs are shown in Table 3.
Table 3. The cement's physical characteristics
|
Components |
Rating Values |
|
Resist the pressure for three days |
21.1 |
|
Softness (m2/kg) |
254 |
|
Resist the pressure for seven days |
27.3 |
|
Final setting time (hr) |
7.3 |
|
Initial setting time (min) |
51.7 |
Table 4. The fly ash physical characteristics
|
Components |
Rating Values |
|
Optimum water content (%) |
20.5 |
|
Specific gravity |
2.13 |
|
Maximum dry unit weight (kN/m3) |
12.5 |
|
Sand (%) |
27 |
|
Silt (%) |
68 |
|
Clay (%) |
5 |
|
Liquid limit (%) |
32.5 |
2.4 Fly ash
After burning pulverized coal, fly ash—a finely split residue—is carried out of the combustion chamber by exhaust gases. Fly ash comes from steam and coal-fired power plants. Pulverized coal is often pushed into the boiler's combustion space alongside air. The coal instantly ignites, creating heat and a molten mineral residue. In order to cool the flue gas and solidify the molten mineral residue into ash, boiler tubes draw heat from the boiler. The coarser ash particles, sometimes referred to as bottom ash or slag, descend to the bottom of the combustion chamber, while the lighter microscopic ash particles, called fly ash, remain suspended in the flue gas. Nowadays, more than 20 million metric tons (22 million tons) of fly ash are utilized each year for a range of engineering purposes. Portland cement concrete (PCC), flowable fills, grouts, structural fill, asphalt filler, and soil and road base stabilization are examples of common highway engineering applications. Table 4 shows the chemical composition of fly ash.
3.1 Permeability and leaching test
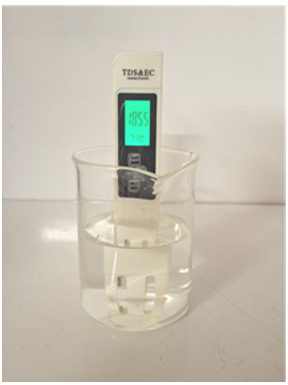
A soil permeability test program can be designed to find out how easily water flows through a soil sample. ASTM D2434 states that this program can incorporate the constant head method, which, as shown in Figure 2, keeps the water flow through the soil sample in a glass cylinder constant a long five days. When the water level (head) difference is constant, the test measures how long it takes to flow through the sample. The ASTM D 2434 method prefers this method for granular soil with a 10% or less fineness. This data, in conjunction with the sample size, enables the calculation of the permeability coefficient (PC). For each sample, 750 millilitres of the water leak were collected, and as seen in Figure 3, the computerized water assessment model E-1 portable was used to detect total soluble salts (TDS). Using Darcy's law, the permeability coefficient was determined, as in Eq. (1), under conditions of constant head as follows:
$\mathrm{PC}=\frac{v}{i}$ (1)
where, v is the velocity of water, and i is the hydraulic gradient.
Figure 2. Constant head permeability test
Figure 3. TDS measurement for natural and treated soil
3.2 Sample preparation
Before being connected to a water storage unit with a constant head (900 mm) for the leaching test, each sample was remolded into a perforated cell that measured 10.12 cm in diameter and 12.17 cm in length. A total of 12 samples of natural and treated soil were prepared for the permeability and leaching test during the present study. The preparation of treated gypseous soil involved combining it with various chemicals (fly ash = 8%, cement = 8%, and lime = 4% which represent the optimum ratio of additives). In order to reach varying initial saturation levels (20, 50, and 70%), the natural and treated soils were compacted at their field unit weight with varying initial compacted moisture contents. To make a consistent blend, the natural gypseous soil was combined with the necessary amount of water and stored in a nylon bag for one day. The treated gypseous soil was left for 1 hour to undergo a mellowing period, and then compaction was performed, as described in this study [13]. The samples were kept for curing for seven days and put at room temperature (25℃). The specimens were stored in sealed plastic bags to maintain relative humidity throughout the maturation period. They were then put in a closed box with wet fabric as a humidity source to keep the relative humidity near 95%, which promotes the effective functioning of chemical interactions like the pozzolanic reaction. To allow the samples to fully saturate, the drain was left blocked for a full day. The water was then allowed to pass through the sample by opening the drain faucet along five days.
4.1 Effect of initial saturation level on coefficient of permeability
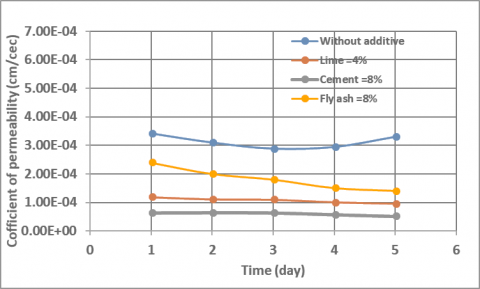
Figures 4-6 show the variation of the permeability coefficient with time (in days) for natural and three treated gypseous soils densified at different initial moisture content to achieve three different starting compacting saturation levels (S = 20, 50, and 70%).
The figures show that the permeability coefficient decreased with an increased initial saturation level for natural and the three treated soils.
Figure 4. Variation of permeability coefficient with time for soils compacted at S = 20%
When natural soil was compacted at a low initial saturation level (Figure 4), there isn't enough water to act as a lubricant between the particles, preventing them from compacting too tightly, leaving large voids that facilitate water passage. Therefore, not all gypsum connections between soil particles are broken by low initial moisture levels. As a result, a lot of water and time were required to weaken cementing ties and change the soil structure, as in the study [14]. When the initial saturation level is high (up to 50%), it acts as a lubricant that improves particle rearrangement during compaction, reducing pore spaces and thus decreasing permeability. In addition, the cohesive forces between particles increase due to surface tension, reducing the open pathways for water movement through the soil. However, if the water content exceeds a certain limit, permeability may begin to increase again due to the formation of free water paths between particles, re-opening some of the larger pores (Figure 6), as in this research [13]. This explains the nonlinear permeability curve with increasing moisture content.
Figure 5. Variation of permeability coefficient with time for soils compacted at S = 50%
Figure 6. Variation of permeability coefficient with time for soils compacted at S = 70%
It could be observed that the coefficient of permeability varies with time (during the 5-day leaching test). At a low initial saturation level (S = 20%), water will easily enter large voids, increasing initial permeability. The gypsum in the soil will begin to dissolve, potentially expanding the porous channels and leading to a further increase in permeability. At a medium saturation level (50%), there is a greater likelihood of re-compacting over time, resulting in reduced permeability after a period of immersion. If the voids created by compaction at 70% are large enough, they can lead to localized collapses in the soil structure, causing particle rearrangement and blockage of some pores, thereby reducing permeability. Dissolved particles may collect in the voids, partially blocking some channels and thus reducing permeability over time. However, if the voids are large and insufficient rearrangement occurs, permeability will remain high or increase over time. If the voids collapse or fill with dissolved particles, permeability may gradually decrease.
When treating gypsum soil with cement, lime, or fly ash, the effect of increasing the initial saturation level on permeability will vary due to the chemical reactions that occur between these materials, the water, and the soil. Increasing the initial saturation level increases the combination of the added material with water, producing more filling and cemented material and closing more voids in the soil structure. When the initial saturation level is low (S = 20%), there is insufficient water to generate a reaction with the additive material, as in these studies [13-15]. Therefore, additive material works as a filler material with little connection to soil particles, and there was no adequate cemented material generated during soil structure, leading to an unclear effect of additive material on the coefficient of permeability at low initial moisture content (S = 20%), as shown in Figure 4. In addition, unlike natural soil, treated soil shows decreases in the coefficient of permeability with time at low initial moisture content (S = 20%). This behaviour may be due to the formation of some cemented material during continuous seepage of the water through the treated soil sample.
Compacted treated soil at 50% and 70% saturation levels leads to a clear decrease in permeability due to the increasing formation of cemented material with increasing initial water content, causing a closure of more voids during soil structure.
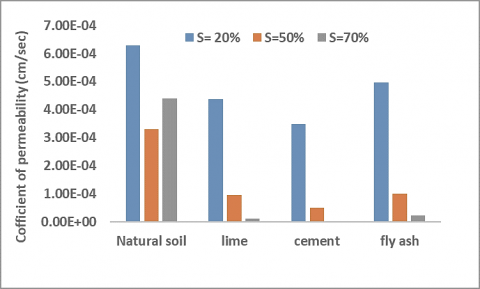
Figure 7 shows the variation of the coefficient of permeability with the initial saturation level for natural and treated soil after 5 days of starting leaching.
Figure 7. Variation of the coefficient of permeability with the initial saturation level for natural and treated soil after 5 days of starting leaching
The decreasing permeability coefficient factor (PCF) was determined as in Eq. (2) and presented in Table 5. This factor was determined for treated soil compacted with three different initial saturation levels (20, 50, and 70%) after 5 days of starting leaching.
$\operatorname{PCF}(\%)=\left(\frac{P C(Treated soil)}{P C(Natural soil)}-1\right) * 100$ (2)
Cement additives demonstrated a greatly better capacity to lower the soil's permeability coefficient, particularly at high starting moisture content (S = 70%), when a total of 100% reduction in permeability was attained. This remarkable outcome attests to cement's ability to greatly decrease treated soils' permeability at high saturation levels. Cement contains components such as calcium oxide (CaO), which reacts with water to form calcium silicate hydrate (C-S-H), the substance that gives cement its strength and cohesion. When cement is added to soil, the chemical reaction with water begins immediately and rapidly, resulting in the formation of a cohesive network of rapidly hardening materials. This network fills the spaces between particles, reducing pores and increasing density, thus rapidly reducing permeability, as in this research [16]. A slower reaction occurs when lime combines with water and fine soil particles to generate calcium silicate compounds (C-S-H), which are similar to those found in cement. It takes longer to create enough hardened compounds to fill voids and lower permeability because of the delayed reaction between lime and soil. Therefore, cement is more effective than lime, even if lime works well, as in this study [17].
Table 5. Permeability coefficient factor (PCF) for treated soil compacted with different initial saturation levels
|
Initial Saturation Level (%) |
Permeability Coefficient Factor (PCF) (%) |
||
|
Lime |
Cement |
Fly Ash |
|
|
20 |
27 |
42 |
17 |
|
50 |
84 |
92 |
76 |
|
70 |
95 |
100 |
88 |
Pozzolanic materials that can react with lime in the presence of water are present in fly ash, but the reactions are slower. Compared to cement and lime, fly ash has a lower concentration of compounds that react quickly. It takes an extended period for fly ash and water to undergo a chemical reaction that reduces permeability to its greatest extent. As a result, fly ash can eventually reduce permeability, but it takes longer than cement and lime, as in this study [18].
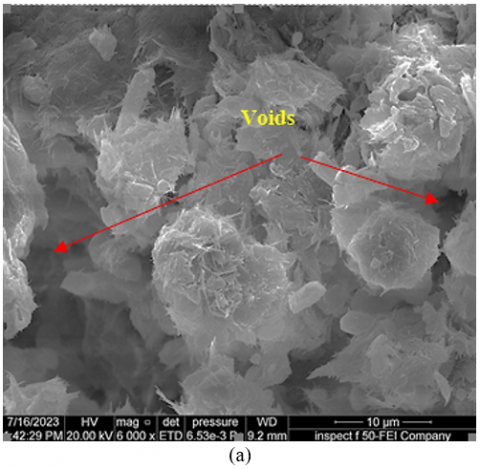
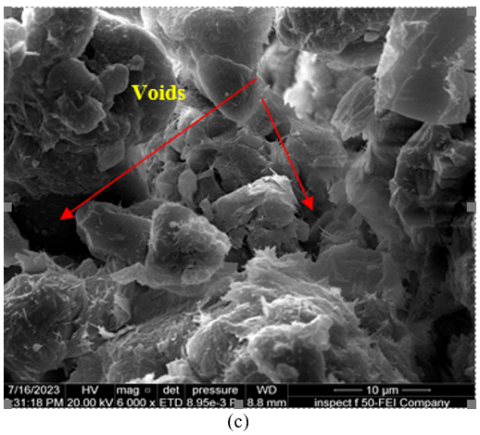
Figure 8 shows the SEM image for untreated soil and the two most effective materials in decreasing permeability (cement and lime) compacted at an initial saturation level of 20%. It can be observed that there is no clear difference in the soil texture of both natural and treated material when the initial saturation content is low, due to what was mentioned above.
Figure 8. SEM image for natural and treated soil compacted at an initial saturation level of 20%, (a) natural soil, (b) lime-treated soil, (c) cement-treated soil
Figure 9. SEM image for natural and treated soil compacted at an initial saturation level of 70%, (a) natural soil, (b) lime-treated soil, (c) cement-treated soil
Figure 9 shows the SEM image for untreated soil and the two most effective materials in decreasing permeability (cement and lime) compacted at an initial saturation level of 70%. A notable change in soil texture for soil treated with lime and cement (Figure 9(b) and Figure 9(c)) due to the formation of cemented material that fills voids. For untreated soil, the formation of the void is clear due to an increasing initial compacted saturation level to 70% as in Figure 9(a).
4.2 Effect of initial saturation level on leaching and total soluble salts of soil
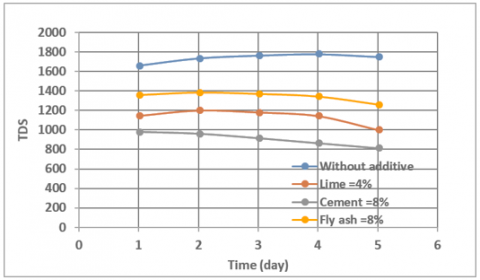
The total soluble salts TDS were tested during the soaking period in conjunction with the permeability test. The results of the TDS are shown in Figures 10-12 for natural and treated soils compacted at various initial saturation levels (20, 50, and 70%), respectively.
For natural soil, the concentration of dissolved salts (TDS) was affected by the initial saturation level used in compaction. The results showed that soil compacted at a low initial saturation level of 20% had the highest permeability, resulting in a faster leaching rate of dissolved salts during the first days of leaching. In contrast, at medium and high initial saturation levels (50 and 70%), permeability was lower, resulting in a slower rate of leaching compared to the low initial saturation level condition. However, in soils with an initial saturation level of 70%, there may be greater gypsum dissolution initially due to increased internal voids, but the accumulation of dissolved material may subsequently lead to partial pore blockage, reducing the dissolution rate after the first days. Accordingly, the concentration of dissolved salts in the first days is in the following order: 20% > 70% > 50%, but the rate of decline in solubility is faster at 70% due to the rapid loss of soluble gypsum, while leaching continues for a longer period at 20% due to the continued high flow of water through the pores, as in these studies [19, 20].
A comparison with alternative stabilization approaches reported in the literature further supports the effectiveness of the current treatments. For example, Al-Gharbawi et al. [4] investigated the use of MgO to stabilize gypsum soils and reported a permeability reduction of more than 100%. In contrast, the current study achieved a comparable reduction using cement, lime, and fly ash, particularly under up to 50% initial saturation level. While MgO offers benefits such as rapid early strength, the use of industrial by-products like fly ash presents a more sustainable and cost-effective alternative for large-scale applications in gypsum-rich areas.
Figure 10. TDS results for natural and treated soil (S = 20%)
Figure 11. TDS results for natural and treated soil (S = 50%)
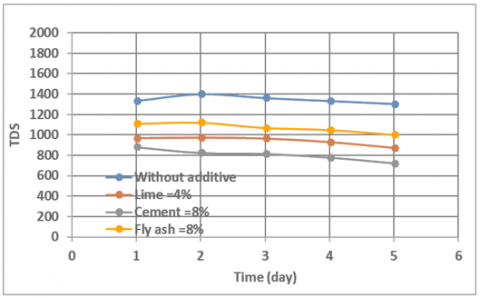
For treated soil, the results showed that soil treated with lime, cement, and fly ash at 20% saturation, despite its high permeability, gradually decreased the concentration of dissolved salts during the first days of leaching. This is because treatment with these additives reduced porosity and stabilized gypsum within the soil, reducing the soil's ability to discharge dissolved ions rapidly. Although permeability was initially high, the chemical interaction between the additives and the soil led to salt stabilization and reduced the discharge rate compared to untreated soil. At a 50% initial saturation level, the dissolution rate was more stable due to the balanced pore distribution, resulting in moderate and steady salt release. The compacted soil at 70% saturation initially showed relatively higher dissolution due to the presence of free water in the pores. However, chemical stabilization of the additives quickly led to a decrease in the dissolution rate, contributing to salt retention and reduced loss over time. Overall, the additive treatment demonstrated a clear effect in reducing salt dissolution compared to the untreated soil, with the improvement being more pronounced at higher saturation levels due to increased interaction between the additives and the soil, as in these studies [21, 22].
Figure 12. TDS results for natural and treated soil (S = 70%)
The findings obtained from the experimental work were statistically analyzed using the statistical package IBM SPSS Statistics 22. The SPSS package contains a lot of potential mathematical models into which data input is made. A one-way ANOVA was performed to evaluate the effect of initial saturation (20, 50, and 70%) on permeability and leaching. The results showed a significant difference between groups at the significance level (p < 0.05), indicating that the initial saturation level has a significant effect on permeability.
To determine which groups differed from each other, a Tukey's B test for multiple comparisons was used. There was no significant difference between permeability at 50% and 70% saturation, indicating that increasing saturation beyond 50% does not significantly affect permeability.
In contrast, permeability at 20% saturation was significantly higher than at 50% and 70%, indicating that decreasing saturation significantly increases permeability.
These results indicate that increasing the initial saturation level reduces permeability, but the most pronounced effect occurs from 20% to 50%, while the effect between 50% and 70% is less pronounced. This can be explained by the saturation of pore spaces with water, which reduces the open paths for fluid movement within the soil.
Table 6 presents an AVOVA analysis of the effect of initial saturation on coefficient permeability variance. The results showed a significant difference between groups, with F = 11.7 at a significance level (Sig.) of 0.000, indicating a clear saturation level effect on permeability coefficients. The mean squared variance between groups (MS = 2576712) was also significantly higher than the mean squared variance within groups (MS = 122205), supporting the hypothesis that differences in saturation lead to significant changes in permeability coefficient.
Table 6. One-way analysis of variance (ANOVA) of the effect of initial saturation level on the permeability coefficient
|
|
Sum of Squares |
df |
Mean Square |
F |
Sig. |
|
Between Groups |
2654468.3 |
2 |
2576712 |
11.7 |
0.00 |
|
Within Groups |
8766321.3 |
57 |
122205 |
|
|
|
Total |
21324075 |
59 |
|
|
|
To study the effect of initial saturation level on TDS, the results of the ANOVA analysis showed a significant effect of the degree of saturation on the concentration of dissolved salts (p < 0.05). Tukey's B tests revealed that the salt concentration at 70% saturation was significantly lower than at 50% and 20% saturation, while there was no significant difference between 50% and 70% saturation. This indicates that increasing the initial saturation level had a great effect on TDS.
Table 7 presents the ANOVA analysis of the effect of initial saturation on total dissolved salts (TDS) concentration. The results show a significant difference between groups, with F = 9.974 at a significance level (Sig.) of 0.000, indicating a clear saturation level effect on TDS concentration. The mean squared variance between groups (MS = 1,397,799) was also significantly higher than the mean squared variance within groups (MS = 140,149), supporting the hypothesis that differences in saturation level led to significant changes in TDS concentration.
Table 7. One-way analysis of variance (ANOVA) of the effect of initial saturation level on the TDS
|
|
Sum of Squares |
df |
Mean Square |
F |
Sig. |
|
Between Groups |
2795598.2 |
2 |
1397799 |
9.97 |
0.00 |
|
Within Groups |
7988497.4 |
57 |
140149 |
|
|
|
Total |
10784095 |
59 |
|
|
|
Table 8. Correlation results between permeability and TDS
|
|
|
Initial Saturation |
TDS |
|
Initial saturation |
Person correlation |
1 |
-0.502 |
|
|
Sig. (2-tailed) |
|
0.000 |
|
|
N |
60 |
60 |
|
TDS |
Person correlation |
-0.502 |
1 |
|
|
Sig. (2-tailed) |
0.000 |
|
|
|
N |
60 |
60 |
Correlation analysis results showed a moderate negative correlation between saturation and the concentration of soluble salts in the soil (Pearson Correlation = -0.502, p < 0.01), as shown in Table 8. These results indicate that increasing the initial soil saturation level leads to a decrease in the concentration of soluble salts and permeability coefficients. Since this correlation is statistically significant, it can be concluded that changes in soil initial water content play an important role in the distribution and dilution of salts in gypsum soils.
Non-linear regression analysis was used in SPSS to derive the relationship between the input variables (degree of saturation, type of treated material, and time) and their effect on the permeability coefficient. A mathematical model, as in Eq. (3), was developed as follows with R2 of 0.691:
$P C=a_1 E X P\left(a_2 T+a_3 S+a_4 M\right)$ (3)
The coefficients that appear in Table 9 (a1, a2, a3, a4) are from the SPSS program. The final non-linear correlation, as in Eq. (4):
$P C=0.001 * \operatorname{EXP}(-0.028 T+-0.027 S+-0.155 \mathrm{M})$ (4)
Table 9. Non-linear regression parameters from SPSS
|
Coefficient |
Value |
Std. Error |
95% Confidence Interval |
|
|
Lower Bound |
Upper Bound |
|||
|
a1 |
0.001 |
0.000 |
0.001 |
0.002 |
|
a2 |
- 0.028 |
0.038 |
- 0.104 |
0.048 |
|
a3 |
- 0.027 |
0.004 |
- 0.035 |
- 0.020 |
|
a4 |
- 0.155 |
0.050 |
- 0.255 |
- 0.055 |
Figure 13. Tayler diagram for the theoretical and experimental results
The regression output showed that coefficients a3 and a4 were 95% statistically significant, as their confidence interval did not include zero, that is, their obvious negative contribution to the permeability coefficient. Coefficient a2, however, was not statistically significant, as its confidence interval included zero, that is, its lack of obvious contribution. Coefficient a1 had a negligible impact, but it can be significant with its small standard error. The findings reveal the significance of a3 and a4 in explaining the conduct of the dependent variable, while the impact of a2 may be statistically indistinct.
Figure 13 shows a Taylor Diagram that emphasizes laboratory permeability result comparisons with the numerical model output using three leading statistical metrics: standard deviation, correlation coefficient (R), and root mean square error (RMSE). The plot shows that most of the model test data points are along the arc for R ≥ 0.95, implying that the values generated by the model closely resemble the laboratory data. However, there are some points with lower values of correlation, which might be because there is some variation between numerical and laboratory results. The graph also shows that the standard deviation of the numerical output is almost identical to that of the laboratory data, which shows the ability of the model to represent natural variability in the data. But the presence of some points with a lower or higher standard deviation may indicate a failure of absolute accuracy in representing all the cases studied.
The study's conclusions are highly applicable to geotechnical engineering in gypsum-rich areas, where building is complicated by high solubility and erosion concerns. The longevity of subgrades, embankments, and foundation systems can be improved by using lime, cement, and fly ash under ideal moisture conditions, which showed a noticeable decrease in permeability and salt leaching. These findings give engineers workable treatment plans to stabilize troublesome soils in dry and semi-arid conditions, which are typical in sections of Iraq and other comparable areas. The following conclusion can be pointed out from this study:
(1) The initial compacted saturation level greatly affected the permeability and leaching properties of natural and treated gypseous soil.
(2) Increasing the initial compacted saturation level decreases the permeability and leaching of natural and treated gypseous soil.
(3) The permeability coefficient decreased by 17%, 27%, and 42% for soils combined with fly ash, lime, and cement after 5 days of leaching, respectively.
(4) Compacting the treating soil at an initial saturation level of 50% decreases the permeability coefficient by about 76%, 84%, and 92% for soils combined with fly ash, lime, and cement after 5 days of starting the permeability test.
(5) Compacting the treating soil at an initial saturation level of 70% decreases the permeability coefficient by about 88%, 95%, and 100% for soils combined with fly ash, lime, and cement after 5 days of starting the permeability test.
(6) The TDS increases with soaking time for natural soil, while decreasing with soaking time and increasing the initial moisture content for treated soil.
(7) Cement additives are more effective than lime and fly ash in decreasing the soil's permeability coefficient and leaching when densified at a starting moisture content (S = 70%).
(8) Although the results provide insightful information about the short-term behavior of treated gypsum soil, there are certain restrictions on how broadly the findings may be applied. Experimental limitations limited the number of replicates per group, which could have an impact on the results' statistical robustness. Furthermore, the leaching experiments were only run for five days, which means they might not have captured long-term patterns of salt movement. It is advised that future research take these constraints into account and use larger sample sizes and longer leaching times.
Although the current study looked at the short-term performance, it is thought that the improvements in salt leaching resistance and permeability reduction that were seen may develop further over time. The continuous gypsum particle and additional pozzolanic and chemical interactions, particularly in increased moisture conditions, point to possible long-term alterations. Initial curing-phase patterns provide credence to this theory.
|
ANOVA |
Analysis of Variance |
|
a1, a2, a3, a4 |
Coefficient from SPSS |
|
i |
Hydraulic gradient |
|
M |
Type of additive (represented by numbers, 0 for natural soil, 1 for lime, 2 for cement, 3 for fly ash) |
|
PC |
Permeability coefficient |
|
PCF |
Permeability coefficient factor |
|
S |
Initial saturation level (%) |
|
SPSS |
Statistical Package for the Social Sciences |
|
T |
Time in days |
|
TDS |
Total soluble salts |
|
v |
Discharge velocity |
[1] Hussein, I.S., Jassam, M.G. (2023). Suction variation of natural and treated unsaturated gypseous soils during wetting. Civil and Environmental Engineering, 19(2): 575-586. https://doi.org/10.2478/cee-2023-0052
[2] Hussein, I.S., Snodi, L.N. (2020). Effect of cavities from gypsum dissolution on bearing capacity of soil under square footing. Key Engineering Materials, 857: 221-227. https://doi.org/10.4028/www.scientific.net/KEM.857.221
[3] Al-Zory, E.A. (1993). The effect of leaching on lime stabilized gypseous soil. Master's thesis. University of Mousl, Iraq.
[4] Al-Gharbawi, A.S.A., Fattah, Y.M., Mahmood, M.R. (2021). Evaluation of leaching behavior of treated and untreated gypseous soil. IOP Conference Series: Earth and Environmental Science, 856(1): 012050. https://doi.org/10.1088/1755-1315/856/1/012050
[5] Hasen, N.A., Abbas, J.K. (2024). Experimental study of shallow foundation settlement under dynamic load in reinforced sandy soil. Proceedings on Engineering, 6(1): 171-178.
[6] Ahmed, H.A., Hassan, N.A., Abed, M.J. (2024). Practical investigation of geogrid-reinforced granular soil at cyclic load. Proceedings on Engineering, 6(4): 1703-1710. https://doi.org/10.24874/PES06.04.029
[7] Al-Abdullah, S.F., Al-Dulaimi, N.S.M. (2006). Characteristics of gypseous soils treated with calcium chloride solution. Journal of Engineering, 12(3): 681-692.
[8] Moula, B.H., Farhan, M. (2010). Decreasing permeability of gypseous soils by bentonite. Al-Taqani, 23(1): 179-183. https://iasj.rdd.edu.iq/journals/uploads/2024/12/11/7300be2d1466ee2aa9bcc92e166b865d.pdf.
[9] Asghari, S., Ghafoori, M., Tabatabai, S. (2014). The evaluation of changes in permeability and chemical composition of gypseous soils through leaching in southern Mashhad, Iran. Malaysian Journal of Civil Engineering, 26(3): 337-348. https://doi.org/10.11113/mjce.v26.15895
[10] Aldaood, A., Bouasker, M., Al-Mukhtar, M. (2015). Effect of long-term soaking and leaching on the behaviour of lime-stabilised gypseous soil. International Journal of Pavement Engineering, 16(1): 11-26. https://doi.org/10.1080/10298436.2014.893329
[11] Aziz, H.Y., Maula, B.H., Abbas, B.J. (2020). Evaluation of stabiliser material using a waste additive mixture. Open Engineering, 10(1): 311-317. https://doi.org/10.1515/eng-2020-0034
[12] Al Watar, Z.H., Al-Kifae, A.A. (2024). Optimizing gypseous soils permeability utilizing clayey soils, both treated and untreated. IOP Conference Series: Earth and Environmental Science, 1374: 012011. https://doi.org/10.1088/1755-1315/1374/1/012011
[13] Jassam, M.G., Hussein, I.S. (2024). Variation of collapse potential with initial suction pressure for natural and treated unsaturated gypseous soil. Mathematical Modelling of Engineering Problems, 11(6): 1417-1427. https://doi.org/10.18280/mmep.110603
[14] Al-Ani, M.M., Seleam, S.N. (1993). Effect of initial water content and soaking pressure on the geotechnical properties of gypseous soil. Journal of Al-Muhandis, 116(2): 3-12.
[15] Ahmed, M.K., Hussein, I.S., Alshandah, M.N. (2024). Influence of initial saturation level on collapsibility of polymer-treated gypsum soils. Revue des Composites et des Materiaux Avances, 34(5): 645-652. https://doi.org/10.18280/rcma.340512
[16] Hasan, N.A., Ahmed, H.A., Hussein, I.S. (2024). Enhancing the characteristics of gypsum soil by adding hydrated lime and cement. Journal of Composite & Advanced Materials/Revue des Composites et des Matériaux Avancés, 34(2): 207-214. https://doi.org/10.18280/rcma.340210
[17] Afolayan, O.D. (2017). Evaluation of the effect of lime and cement on the engineering properties of selected soil in a university in Southwestern Nigeria. Journal of Advancement in Engineering and Technology, 5(4): 1-6. https://core.ac.uk/download/pdf/144875452.pdf.
[18] Magara, D., She, H. (2024). A systematic review of the effects of soil stabilization on soil mechanical properties: A comparative study of fly ash, cement and lime. OALib, 11(3): 1-19. http://doi.org/10.4236/oalib.1111319
[19] Razouki, S.S., Kuttah, D.K. (2020). Effect of relative compaction on water absorption and gypsum dissolution in gypsum-rich clayey CBR samples. Transportation Infrastructure Geotechnology, 7(4): 590-604. https://doi.org/10.1007/s40515-020-00107-w
[20] Fattah, M.Y., Obead, I.H., Omran, H.A. (2022). A study on leaching of collapsible gypseous soils. International Journal of Geotechnical Engineering, 16(1): 44-54. https://doi.org/10.1080/19386362.2019.1647664
[21] Sulaiman, H.S., Al Sharrad, M.A., Abed, I.A. (2024). Biocalcification of sandy gypseous soil by Bacillus Pasteurii. Salud, Ciencia y Tecnología-Serie de Conferencias, 3: 818.
[22] Al-Riahi, S.M.H., Pauzi, N.I.M., Fattah, M.Y., Abbas, H.A. (2024). Leaching-induced alterations in the geotechnical and microstructural attributes of clayey gypseous soils. Ain Shams Engineering Journal, 15(7): 102865. https://doi.org/10.1016/j.asej.2024.102865