Emad Toma Karash*![]() | Hussein Mohammed Ali
| Hussein Mohammed Ali![]() | Mohammad Takey Elias Kassim
| Mohammad Takey Elias Kassim![]()
© 2024 The authors. This article is published by IIETA and is licensed under the CC BY 4.0 license (http://creativecommons.org/licenses/by/4.0/).
OPEN ACCESS
The current research dealt with the system of cantilever beam, which has holes of various shapes on its surface, under the influence of direct external load. The design of the system control of four three-dimensional models consisting of steel and various composite materials was modeled and simulating by the use of ANSYS program, using finite element technology. The results of modeling in the ANSYS program using the finite element technique show that the values of the deflection in the models consisting of different composite materials increased by various percentages when compared to the model consisting of steel, with the model consisting of fiber class having the highest value. The displacements in these models also increase at rates almost similar to the percentage of deflections. According to the results, the various stresses that resulted from the steel model in the composite models were reduced by around a third, except for shear stress values, they increased in the composite material models, by more than a third compared to the shear stress in the steel model. The results of strains indicate an increase in the models composed of composite materials in different proportions, with the highest values (92.18%) in the model consisting of fiberglass. The results of the strains and stresses obtained at the seven points and distributed in order at the holes on the surface of the four models located in the path (A - A) most of the increments were at the third point, While the highest value of displacements was at the fifth and eighth points.
stress, finite element method, carbon fiber, cantilever beam, bending force, strain
Subsequently the turn of the 20th century, composite materials have gained popularity. This new class of material has subsequently surpassed metals in a number of application areas [1, 2]. The advantage of these materials is the ability to customize the resin formulation or the reinforcements based on the environment the component will be used in [3].
The creation of high-performance fibers like Kevlar, glass, and carbon fibers has made a substantial contribution to the advancement of composite materials. Space, aviation, sports, and the military are just a few industries that use Kevlar/Epoxy composite materials [4-6].
Lateral-torsional buckling (LTB), a frequent global instability event for thin structures, occurs when the external load reaches the critical value and materials bent in the plane of highest flexural stiffness bow laterally and torsionally. Since a beam's flexural stiffness in the plane of bending is larger than its lateral rigidity, LTB must be taken into account while constructing the beam. As a result, in addition to deformation and stress calculations, the limiting load of LTB must be considered during the engineering design process [7, 8].
Buckling deformation is more complicated for steel cantilever beams because of the properties of the boundary condition. In contrast to merely supported beams, cantilevers have maximum displacement and rather than close to the mid-span, the torsion angle is at the free end [9]. In addition to researching cantilever beams and standard simply supported beams, many researchers also took into account additional elements like pre-stressed beams, material properties, early defects, and flange-web interaction [10, 11].
In engineering applications, thin-walled box-beam constructions composed of composite materials are frequently employed, for example as the arms of robots, antenna supports, helicopter blades, or airplane wings. They can have their characteristics altered throughout the fabrication process and are lightweight materials. Particularly for applications like as active vibration control and health monitoring, it is crucial to accurately characterize their dynamical features [12-14].
In the industrial domains, composite materials have grown significantly in importance. One of the most popular composite kinds is the sandwich construction. They typically consist of two robust, thin face sheets (skins), which are sandwiched together by a light core. When joined to form a sandwich panel, the core and skins which are typically flexible and weak create a robust and light-weight structure [15-17]. Composite structures are put under a variety of loading situations, including tensile, flexural, torsion, and fatigue, among others. Construction and transportation sectors frequently use cantilever beam structures with end loads or distributed loads. The cross section of the composite cantilever constructions is typically produced with a constant value along the axis of the beam. Structure shape optimization aids in identifying the shape that is ideal in that it reduces a particular cost function while meeting predetermined limits [18, 19].
In order to find engineering materials that are lightweight and environmentally friendly, a lot of research has compared the use of traditional and modern composite materials in a variety of engineering applications and in a wide range of fields, including aviation, ships, buildings, construction, and the manufacture of various mechanical parts used in laboratories, factories, car companies, trains, etc. It is less expensive to produce than conventional materials, and these research [20-27] are the most significant.
The analysis of arbitrary geometries and loading conditions can be done generally using numerical methods. Finite Element Analysis (FEA), one of the numerical techniques, has been successfully used in a wide range of applications; however, this type of analysis necessitates the generation of a sizable dataset in order to obtain results that are reasonably accurate, and it requires a significant investment of engineering time and computer resources [28].
FEA is reliant on engineering analysis in mechanical engineering applications and uses it to provide accurate solutions through mathematical equations and operating procedures that connect it directly to computers [29].
In this paper, On the surfaces of various holes, four cantilever models will be created, and the finite element technique will be used through the use of ANSYS software to recognize the behavior and resistance of each model under the influence of an external curvature load, projected at the end of each model. Each model will be made of different materials, and these materials will be made of steel and different composite materials. The steel model will be compared with the other three models made of different composite materials, in terms of stresses, strains, displacements and deformations that appear on the four models after loading. Additionally, a nine-point path will be chosen starting from the beginning of the models, passing through the holes at the bottom of the models' surfaces, and ending at the end of the models, comparison of the behavior and resistance of the four models at these holes when they are subjected to an external bending load.
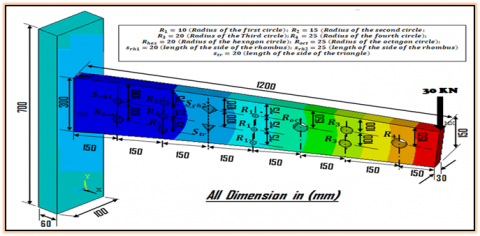
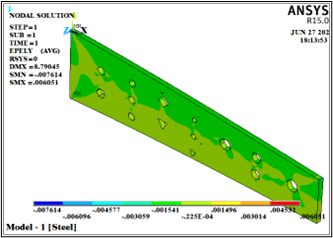
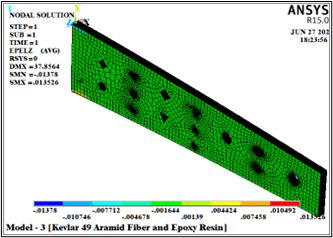
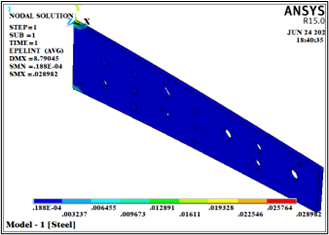
By selecting the finite elements and using the ANSYS program, four three-dimensional models of Cantilever were created on the surface of different holes, under the influence of an external curvature load of (30 KN) and projected at the end of the models, and dimensions and measurements as shown as shown in the Figure 1. The first model is constructed of steel, and the second model is constructed of carbon fiber resin volumetric ratio of (55%) with an epoxy, the third model consists of Kevlar 49 Aramid fiber a ratio (55%) with the epoxy resin, while the fourth model consists of glass fiber and a ratio (55%) with the epoxy resin.
Figure 1. Show the models form, cross-sectional area, and dimensions used in the tests
The testing involved using four distinct kinds of materials. The following materials are employed, listed in order of importance: Steel, aramid fiber reinforced composites with epoxy matrix, glass fiber reinforced composites with epoxy resin matrix, and carbon fiber reinforced composites with epoxy matrix. Both PAN-based carbon fiber from Zoltek Corporation in the USA and e-glass fiber from PPG Ind., Inc. in the USA are used. Table 1 presents the mechanical characteristics of the fibers. In this investigation, the matrix was made of epoxy resin and two different hardener types.
The mechanical properties of the steel, epoxy resin, and carbon fiber composition in Table 1 should be described. Table 2 shows the findings of the mechanical characteristics of the composite materials as determined by the Mathcad-15 program. Table 3 lists the models, codes, particular disciplines, element kinds, and load types applied by the ANSYS 15.0 program.
Table 1. It displays the mechanical characteristics of the different composite fibers, as well as the bonding material consisting of the epoxy resin [30-33]
|
Model |
Materials |
Density, $\begin{gathered}\rho,\end{gathered}$ (Kg/m3) |
Modulus of Elasticity, E, (GPa) |
Passion’s Ratio |
Modulus of Rigidity, G, (GPa) |
|
|
M - 1 |
Steel |
7870 |
207 |
0.3 |
80 |
|
|
M - 2 |
Carbon Fiber and Epoxy Resin |
Carbon fiber; (55%) |
1810 |
228 |
0.31 |
41.16 |
|
Epoxy Resin; (45%) |
1100 |
3.2 |
0.28 |
1.25 |
||
|
M - 3 |
Aramid Fibre and Epoxy Resin |
Kevlar® 49 Aramid Fibre; (55%) |
1440 |
112 |
0.36 |
41.18 |
|
Epoxy Resin; (45%) |
1100 |
3.2 |
0.28 |
1.25 |
||
|
M - 4 |
Glass Fiber and Epoxy Resin |
Glass Fibre; (55%) |
2000 |
72.52 |
0.33 |
29.721 |
|
Epoxy Resin; (45%) |
1100 |
3.2 |
0.28 |
1.25 |
||
Table 2. The mechanical characteristics of composite materials produced by the software Mathcad 15
|
Model |
Materials |
E ii, GPa |
G ij, GPa |
$\boldsymbol{\mu}_{\mathbf{i j}}$ |
|
Model - 1 |
Steel |
207 |
80 |
0.3 |
|
Model - 2 |
Carbon Fiber and Epoxy Resin |
E11 = 53.213 E22 = 53.213 E33 = 14.454 |
G12 = 20.56 G13 = 3.581 G23 = 3.581 |
$\mu$12 =0.288 $\mu$13 =0.203 $\mu$23 =0.203 |
|
Model - 3 |
Kevlar 49 Aramid Fiber and Epoxy Resin |
E11 = 31.973 E22 = 31.975 E33 = 13.997 |
G12 = 12.598 G13 = 3.581 G23 = 3.581 |
$\mu$12 =0.269 $\mu$13 =0.214 $\mu$23 =0.214 |
|
Model - 4 |
Glass Fiber and Epoxy Resin |
E11 = 24.582 E22 = 24.582 E33 = 13.307 |
G12 = 9.773 G13 = 3.581 G23 = 3.581 |
$\mu$12 =0.258 $\mu$13 =0.222 $\mu$23 =0.222 |
Table 3. The ANSYS 15.0 program uses models, codes, individual disciplines, element types, and load types
|
No. |
Model |
Number of Layers |
Thickness (mm) |
Code |
Individual Disciplines |
Type of Element |
Loads (KN) |
|
1 |
Model - 1 |
1 |
30 |
[0] |
Structural |
Beam 188 |
30 |
|
2 |
Model - 2 |
32 |
0.9375 |
[0°/45°/-45°/90°]8 |
Structural |
Beam 188 |
30 |
|
3 |
Model - 3 |
32 |
0.9375 |
[0°/45°/-45°/90°]8 |
Structural |
Beam 188 |
30 |
|
4 |
Model - 4 |
32 |
0.9375 |
[0°/45°/-45°/90°]8 |
Structural |
Beam 188 |
30 |
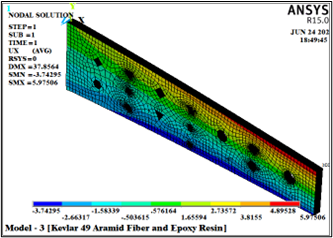
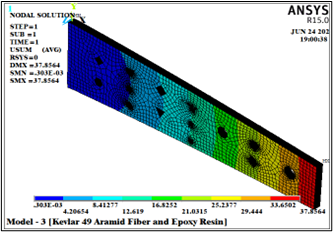
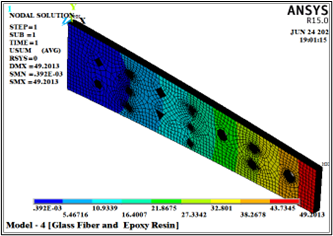
The abutment has four identically sized mathematical models made for it in various holes. Steel makes up the first model, carbon fiber and epoxy resin make up the second, Kevlar 49 aramid fiber and epoxy resin make up the third, and glass fiber and epoxy resin make up the fourth. A vertical load of 30 KN was applied to the four models using the ANSYS 15.0 program, as shown in Figure 1. Figures 2-14 display the stresses, displacements, deformations, and strains that were recorded during the four standard tests that were performed on the models using the ANSYS 15.0 program.
Table 4 summarizes the results of deformations, displacements, stresses and strains obtained using the ANSYS program and by applying a load of (30 kN) on each one of the four models.
Table 4. A summary of the findings from stress, strain, and deformations on the four models is displayed
|
NO. |
Model |
$\boldsymbol{\delta}$ (mm) |
$U_x$ (mm) |
$U_y$ (mm) |
$\boldsymbol{U}_{\text {sum }}$ (mm) |
$\sigma_x$ (MPa) |
$\sigma_y$ (MPa) |
$\tau_{x y}$ (MPa) |
$\sigma_{i n t}$ (MPa) |
$\boldsymbol{\varepsilon}_{\boldsymbol{x}}$ |
$\varepsilon_y$ |
$\varepsilon_z$ |
$\varepsilon_{x y}$ |
$\varepsilon_{int.}$ |
|
1. |
M1 |
8.791 |
1.387 |
0.284 |
8.791 |
3303.29 |
1097.42 |
501.708 |
4614.87 |
0.0168 |
0.006 |
0.0044 |
0.0063 |
0.0289 |
|
2. |
M2 |
22.775 |
3.594 |
0.734 |
22.775 |
2206.69 |
1013.51 |
788.148 |
3076.14 |
0.0436 |
0.0246 |
0.0077 |
0.0381 |
0.0745 |
|
3. |
M3 |
37.8564 |
5.975 |
1.213 |
37.8564 |
2203.88 |
1013.48 |
788.865 |
3073.19 |
0.0722 |
0.0318 |
0.0135 |
0.0626 |
0.1219 |
|
4. |
M4 |
49.201 |
7.766 |
1.572 |
49.201 |
2202.51 |
1012.86 |
787.969 |
3071.65 |
0.0937 |
0.0318 |
0.0182 |
0.0806 |
0.1572 |
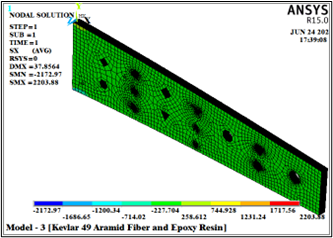
Figure 2. Results of the deflection ($\delta$), for the four models
Figure 3. Results of the displacement ($U_x$), for the four models
Figure 4. Results of the displacement ($U_y$), for the four models
Figure 5. Results of the displacement ($U_{\text {sum}}$), for the four models
Figure 6. Results for the four models for the normal stress ($\sigma_x$)
Figure 7. Results for the four models for the normal stress ($\sigma_y$)
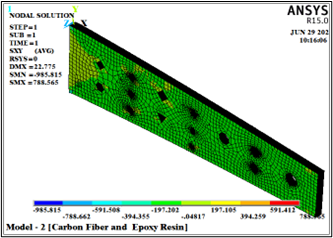
Figure 8. Results for the four models for the shear stress ($\tau_{x y}$)
Figure 9. Results for the four models for the intensity stress ($\sigma_{\text {int.}}$)
Figure 10. Results for the four models for the normal strain ($\varepsilon_x$)
Figure 11. Results for the four models for the normal strain ($\varepsilon_y$)
Figure 12. Results for the four models for the normal strain ($\varepsilon_z$)
Figure 13. Results for the four models for the shear strain ($\varepsilon_{x y}$)
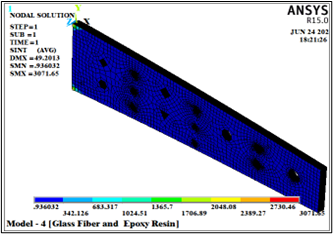
Figure 14. Results for the four models for the intensity strain ($\varepsilon_{\text {int. }}$)
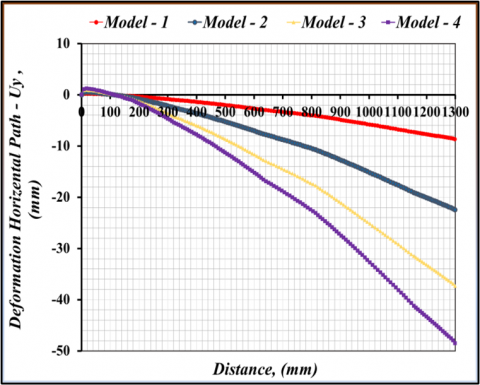
Figure 15. A horizontal path (A - A) appears, which passes through nine points from the beginning of the model to its end
Figure 15 shows the horizontal path (A - A) that was selected to determine and compare the values of deformations, displacements, stresses, and strains that the models are subjected bending force. At the bottom of the picture, close to where the bottom holes are present, this path travels through nine places.
The deformations, displacements, stresses, and strains caused by applying a load of 30 KN to each of the four models along the path (A - A) and at the points (1, 2, 3, 4, 5, 6, 7, 8, 9) are shown in Figures 16-27 and Table 5.
The results for the four models can be summarized as shown in Table 4 using the Figures 16-27 and the nine spots situated along the path (A - A). These results show the deformation, displacements, stresses, strains, and distortions that take place at these locations. Following that, it is established what the maximum critical values are in those regions.
Figure 16. Deformation results ($U_x$) comparison for the four models
Figure 17. Deformation results ($U_y$) comparison for the four models
Figure 18. Deformation results ($U_{\text {sum}}$) comparison for the four models
Figure 19. Normal stress results ($\sigma_x$) comparison for the four models
Figure 20. Normal stress results ($\sigma_y$) comparison for the four models
Figure 21. Normal stress results ($\tau_{x y}$) comparison for the four models
Figure 22. Normal stress results ($\sigma_{i n t.}$) comparison for the four models
Figure 23. Normal stress results ($\varepsilon_x$) comparison for the four models
Figure 24. Normal strain results ($\varepsilon_y$) comparison for the four models
Figure 25. Normal strain results ($\varepsilon_z$) comparison for the four models
Figure 26. Normal strain results ($\varepsilon_{x y}$) comparison for the four models
Figure 27. Normal strain results ($\varepsilon_{\text {int.}}$) comparison for the four models
Table 5. Shows the values of deformations, displacements, strains and stresses produced on the path (A - A) at the nine points after loading
|
Points |
1 (0 mm) |
2 (176.92 mm) |
3 (321.97 mm) |
4 (475.54 mm) |
5 (632.75 mm) |
6 (814.46 mm) |
7 (976.05 mm) |
8 (1155.8 mm) |
9 (1300 mm) |
|
|
Elastic Properties |
Models |
|||||||||
|
$U_x$, mm |
M1 |
-3.45*10-15 |
-0.337 |
-0.545 |
-0.386 |
-0.776 |
0.072 |
-0.336 |
0.042 |
-0.715 |
|
M2 |
-9.01*10-15 |
-0.758 |
-1.328 |
-1.001 |
-1.983 |
0.187 |
-0.981 |
0.165 |
-1.853 |
|
|
M3 |
-1.49*10-14 |
-1.259 |
-2.346 |
-1.664 |
-3.251 |
0.311 |
-1.444 |
0.182 |
-3.081 |
|
|
M4 |
-1.93*10-14 |
-1.635 |
-2.884 |
-2.162 |
-4.226 |
0.404 |
-1.941 |
0.356 |
-4.005 |
|
|
$U_y$, mm |
M1 |
3.77E-15 |
-0.292 |
-0.997 |
-1.873 |
-2.977 |
-4.137 |
-5.581 |
-7.328 |
-8.676 |
|
M2 |
9.7259E-15 |
-0.533 |
-2.533 |
-4.851 |
-7.686 |
-10.716 |
-14.538 |
-19.092 |
-22.478 |
|
|
M3 |
1.6108E-14 |
-0.890 |
-4.293 |
-8.063 |
-12.812 |
-17.812 |
-24.189 |
-31.556 |
-37.362 |
|
|
M4 |
2.0888E-14 |
-1.160 |
-5.515 |
-10.479 |
-16.649 |
-23.149 |
-31.360 |
-41.244 |
-48.559 |
|
|
$U_{\text {sum}}$, mm |
M1 |
5.2*10-15 |
0.446 |
1.136 |
1.912 |
3.077 |
4.137 |
5.591 |
7.328 |
8.705 |
|
M2 |
1.35*10-14 |
0.927 |
2.860 |
4.953 |
7.938 |
10.718 |
14.572 |
19.093 |
22.554 |
|
|
M3 |
2.23*10-14 |
1.542 |
4.892 |
8.233 |
13.218 |
17.814 |
24.232 |
31.557 |
37.489 |
|
|
M4 |
2.98*10-14 |
2.005 |
6.223 |
10.700 |
17.177 |
23.152 |
31.420 |
41.246 |
48.724 |
|
|
$\sigma_x$, $M P a$ |
M1 |
-3260.200 |
-210.700 |
-274.050 |
-239.100 |
-235.320 |
27.521 |
-134.300 |
-9.790 |
-107.550 |
|
M2 |
-2175.900 |
-66.164 |
-307.610 |
-159.460 |
-175.140 |
16.661 |
-69.505 |
-13.353 |
-71.930 |
|
|
M3 |
-2173.000 |
-66.116 |
-306.900 |
-159.410 |
-226.640 |
16.635 |
-96.467 |
-6.181 |
-71.657 |
|
|
M4 |
-2171.200 |
-66.108 |
-305.650 |
-159.380 |
-226.500 |
16.614 |
-83.760 |
-13.405 |
-71.493 |
|
|
$\sigma_y$, $M P a$ |
M1 |
274.440 |
-41.260 |
-62.968 |
-60.873 |
-57.704 |
13.271 |
-6.970 |
-0.646 |
403.360 |
|
M2 |
185.920 |
0.730 |
-12.575 |
-40.267 |
-34.609 |
10.437 |
-7.130 |
-5.422 |
269.060 |
|
|
M3 |
183.920 |
0.534 |
-14.187 |
-40.047 |
-30.225 |
10.404 |
-8.104 |
-5.832 |
268.650 |
|
|
M4 |
182.760 |
0.428 |
-16.482 |
-39.900 |
-30.049 |
10.379 |
-10.356 |
-5.370 |
268.410 |
|
|
$\tau_{x y}$, $M P a$ |
M1 |
-1483.500 |
-55.808 |
-24.972 |
-37.807 |
-23.233 |
-19.427 |
-8.920 |
-20.777 |
-147.990 |
|
M2 |
-985.470 |
20.357 |
-10.126 |
-27.473 |
-15.462 |
-16.061 |
-12.745 |
-12.674 |
-98.915 |
|
|
M3 |
-986.100 |
20.488 |
-19.014 |
-27.473 |
-31.111 |
-16.059 |
-18.695 |
-14.841 |
-99.002 |
|
|
M4 |
-986.530 |
20.566 |
-34.700 |
-27.468 |
-31.116 |
-16.061 |
-14.363 |
-12.704 |
-99.058 |
|
|
$\sigma_{\text {int.}}$, $M P a$ |
M1 |
4614.9 |
227.43 |
276.96 |
246.79 |
238.31 |
41.38 |
134.92 |
42.55 |
590.45 |
|
M2 |
3076.1 |
78.31 |
307.96 |
165.49 |
176.82 |
32.719 |
72.253 |
26.56 |
394.22 |
|
|
M3 |
3073.2 |
78.238 |
187.35 |
165.43 |
231.45 |
32.717 |
100.26 |
30.16 |
393.72 |
|
|
M4 |
3071.5 |
78.223 |
309.75 |
165.39 |
231.31 |
32.722 |
86.471 |
26.648 |
393.42 |
|
|
$\varepsilon_x$, |
M1 |
-0.0161 |
-0.0010 |
-0.0012 |
-0.0011 |
-0.0011 |
0.0001 |
-0.0006 |
-0.00005 |
-0.0011 |
|
M2 |
-0.0419 |
-0.0012 |
-0.0057 |
-0.0028 |
-0.0031 |
0.0003 |
-0.0012 |
-0.00022 |
-0.0028 |
|
|
M3 |
-0.0695 |
-0.0021 |
-0.0055 |
-0.0046 |
-0.0068 |
0.0004 |
-0.0029 |
-0.00019 |
-0.0045 |
|
|
M4 |
-0.0902 |
-0.0027 |
-0.0123 |
-0.0061 |
-0.0089 |
0.0006 |
-0.0033 |
-0.00049 |
-0.0057 |
|
|
$\varepsilon_y$, |
M1 |
0.00605 |
0.00011 |
0.00009 |
0.00005 |
0.00006 |
0.00002 |
0.00016 |
0.00001 |
0.00210 |
|
M2 |
0.01527 |
0.00037 |
0.00143 |
0.00011 |
0.00030 |
0.00011 |
0.00013 |
-0.00003 |
0.00545 |
|
|
M3 |
0.02403 |
0.00057 |
0.00033 |
0.00009 |
0.00096 |
0.00019 |
0.00056 |
0.00003 |
0.00900 |
|
|
M4 |
0.03022 |
0.00071 |
0.00254 |
0.00005 |
0.00115 |
0.00025 |
0.00046 |
-0.00008 |
0.01167 |
|
|
$\varepsilon_z$, |
M1 |
0.00433 |
0.00037 |
0.00049 |
0.00043 |
0.00042 |
-0.00006 |
0.00020 |
0.00002 |
-0.00043 |
|
M2 |
0.00759 |
0.00025 |
0.00122 |
0.00076 |
0.00080 |
-0.00010 |
0.00032 |
0.00007 |
-0.00075 |
|
|
M3 |
0.01331 |
0.00044 |
0.00150 |
0.00133 |
0.00172 |
-0.00018 |
0.00070 |
0.00005 |
-0.00132 |
|
|
M4 |
0.01796 |
0.00059 |
0.00291 |
0.00180 |
0.00232 |
-0.00024 |
0.00085 |
0.00017 |
-0.00178 |
|
|
$\varepsilon_{x y}$, |
M1 |
-0.01863 |
-0.00070 |
-0.00031 |
-0.00047 |
-0.00029 |
-0.00024 |
-0.00011 |
-0.00026 |
-0.00186 |
|
M2 |
-0.04772 |
0.00099 |
-0.00049 |
-0.00133 |
-0.00075 |
-0.00078 |
-0.00062 |
-0.00061 |
-0.00479 |
|
|
M3 |
-0.07828 |
0.00163 |
-0.00151 |
-0.00218 |
-0.00247 |
-0.00127 |
-0.00148 |
-0.00118 |
-0.00786 |
|
|
M4 |
-0.10094 |
0.00210 |
-0.00355 |
-0.00281 |
-0.00318 |
-0.00164 |
-0.00147 |
-0.00130 |
-0.01014 |
|
|
$\varepsilon_{\text {int.}}$ |
M1 |
0.028982 |
0.001428 |
0.001739 |
0.001550 |
0.001497 |
0.000260 |
0.000847 |
0.000257 |
0.003708 |
|
M2 |
0.074468 |
0.001896 |
0.007158 |
0.003687 |
0.003945 |
0.000792 |
0.001617 |
0.000661 |
0.009543 |
|
|
M3 |
0.121970 |
0.003105 |
0.007050 |
0.006222 |
0.008744 |
0.001299 |
0.003808 |
0.001071 |
0.015626 |
|
|
M4 |
0.157170 |
0.004002 |
0.015380 |
0.008171 |
0.011462 |
0.001674 |
0.004287 |
0.001371 |
0.020132 |
|
Micromechanical models were used to predict the elastic properties of three thermoplastic materials: carbon fiber, aramid fiber Kevlar-49, and glass fiber with a fiber content of up to 55%. These materials were then tested using the finite element method in the ANSYS program. Following conclusions were drawn from the study results:
$\left(\varepsilon_{x 2}=61.47 \% ;\ \varepsilon_{x 3}=76.73 \% ;\ \varepsilon_{x 4}=82.07 \%;\right.$
$\varepsilon_{y 2}=75.61 \%;\ \varepsilon_{y 3}=81.13 \%;\ \varepsilon_{y 4}=81.13 \%;$
$\varepsilon_{z 2}=42.86 \%;\ \varepsilon_{z 3}=67.41 \%;\ \varepsilon_{z 4}=75.82 \%;$
$\varepsilon_{x y 2}=83.46 \%;\ \varepsilon_{x y 3}=89.94 \%;\ \varepsilon_{x y 4}=92.18 \% ;$
$\left.\varepsilon_{\text {int. } 2}=61.21 \%;\ \varepsilon_{\text {int. } 3}=76.29 \%;\ \varepsilon_{\text {int. } 4}=81.62 \%\right).$
|
$\delta $ |
$Deformed~and~unreformed$ |
|
${{U}_{x}}$ |
$Component~of~the~displacement~\left( x-direction \right)$ |
|
${{U}_{y}}$ |
$Component~of~the~displacement~\left( y-direction \right)$ |
|
${{U}_{z}}$ |
$Component~of~the~displacement~\left( z-direction \right)$ |
|
${{\sigma }_{x}}$ |
$Normal~stress$ |
|
${{\tau }_{xy}}$ |
$shear~~stress$ |
|
${{\tau }_{xz}}$ |
$shear~~stress$ |
|
${{\sigma }_{int.}}$ |
$Stress~intensity$ |
|
${{\sigma }_{von}}$ |
$Von~mises~stress$ |
|
${{\varepsilon }_{x}}$ |
$Normal~strain~\left( x-direction \right)$ |
|
${{\varepsilon }_{xy}}$ |
$Shear~strain~\left( xy-direction \right)$ |
|
${{\varepsilon }_{xz}}$ |
$Shear~strain~\left( xz-direction \right)$ |
|
${{\varepsilon }_{first}}$ |
$First~principal~elastic~strain$ |
|
${{\varepsilon }_{third}}$ |
$Third~principal~elastic~strain$ |
|
${{\varepsilon }_{intensity}}$ |
$Elatic~strain~intensty$ |
|
${{\varepsilon }_{von}}$ |
$Von~mises~elatic~strain$ |
[1] Zhu, S.Q., Chai, G.B. (2013). Damage and failure mode maps of composite sandwich panel subjected to quasi-static indentation and low velocity impact. Composite Structures, 101: 204-214. http://dx.doi.org/10.1016/j.compstruct.2013.02.010
[2] Djemai, H., Hecini, M., Djoudi, T., Djebloun, Y. (2018). Mechanical characteristic of two different sandwiches made from bio-source materials: International Symposium on Mechatronics and Renewable Energies ISMRE, El-Oued. Algeria. http://dspace.univ eloued.dz/handle/123456789/1623.
[3] Djemai, H., Djoudi, T., Labed, A. (2022). Experimental investigation of mechanical behaviour and damage of bio-sourced sandwich structures based on date palm tree waste and cork materials. Revue des Composites et des Matériaux Avancés-Journal of Composite and Advanced Materials, 32(5): 215-222. https://doi.org/10.18280/rcma.320501
[4] Ibrahim, M.B., Habib, H.Y., Jabrah, R.M. (2020). Preparation of kevlar-49 fabric/e-glass fabric/epoxy composite materials and characterization of their mechanical properties. Revue des Composites et des Matériaux Avancés-Journal of Composite and Advanced Materials, 30(3-4): 133-141. https://doi.org/10.18280/rcma.303-403
[5] Wu, S.R., Sheu, G.S., Shyu, S.S. (1996). Kevlar fiber– epoxy adhesion and its effect on composite mechanical and fracture properties by plasma and chemical treatment. Journal of Applied Polymer Science, 62(9): 1347-1360. https://doi.org/10.1002/(SICI)1097-4628(19961128)62:9<1347::AID-APP5>3.0.CO;2-H
[6] Li, G., Zhang, C., Wang, Y., Li, P., Yu, Y.H., Jia, X.L, Liu, H.Y., Yang, X.P., Xue, Z.M., Ryu, S. (2008). Interface correlation and toughness matching of phosphoric acid functionalized Kevlar fiber and epoxy matrix for filament winding composites. Composites Science and Technology, 68(15-16): 3208-3214. https://doi.org/10.1016/j.compscitech.2008.08.006
[7] Ali, H.M., Najem, M.K., Karash, E.T., Sultan, J.N. (2023). Stress distribution in cantilever beams with different hole shapes: A numerical analysis. International Journal of Computational Methods and Experimental Measurements, 11(4): 205-219. https://doi.org/10.18280/ijcmem.110402
[8] Cai, Y., Ling, A., Lv, X.Y. (2023). Lateral–torsional buckling of cantilever steel beams under 2 types of complex loads. Applied Sciences, 13(10): 5830. https://doi.org/10.3390/app13105830
[9] Timoshenko, S.P., Gere, J.M. (1961). Theory of Elastic Stability. 2nd edition, McGraw-Hill: New York, NY, USA, pp. 251-278.
[10] Liu, Y.Y., Fan, Y.F. (2020). Experimental study on flexural behavior of CFRP reinforced pre-stressed concrete beams with initial cracks. Materials Science Forum, 984: 230-238. https://doi.org/10.4028/www.scientific.net/MSF.984.230
[11] Lorkowski, P., Gosowski, B. (2021). Experimental and numerical research of the lateral buckling problem for steel two-chord columns with a single lacing plane. Thin-Walled Structures, 165(2): 107897. https://doi.org/10.1016/j.tws.2021.107897
[12] Lorkowski, P., Gosowskim, B. (2018). Experimental and numerical research of the torsion problem of built-up steel columns laced in a single plane. Engineering Structures, 160(1): 566-580. https://doi.org/10.1016/j.engstruct.2018.01.049
[13] Rahnavard, R., Razavi, M., Fanaie, N., Craveiro, N.D. (2023). Evaluation of the composite action of cold-formed steel built-up battened columns composed of two sigma-shaped sections. Thin-Walled Structures, 183: 110390. https://doi.org/10.1016/j.tws.2022.110390
[14] Manoach, E., Warmiński, J., Kłoda, Ł., Teter, A. (2017). Numerical and experimental studies on vibration based methods for detection of damage in composite beams. Composite Structures, 170: 26-39. https://doi.org/10.1016/j.compstruct.2017.03.005
[15] Bocheński, M., Gawryluk, J., Kłoda, Ł. (2020). Experimental modal analysis of an active thin-walled composite structure. Modelling, Measurement and Control B, 88(2-4): 154-159. https://doi.org/10.18280/mmc_b.882-415
[16] Gupta, K., Chakraborti, P., Bhowmik, C. (2019). Study of modal behavior of sandwich structure with various core materials an analytical approach. Revue des Composites et des Matériaux Avancés-Journal of Composite and Advanced Materials, 30(1): 15-21. https://doi.org/10.18280/rcma.300103
[17] Djemai, H., Labed, A., Hecini, M., Djoudi, T. (2021). Delamination analysis of composite sandwich plate of cork agglomerate/glass fiber-polyester: An experimental investigation. Revue des Composites et des Matériaux Avancés-Journal of Composite and Advanced Materials, 31(4): 193-197. https://doi.org/10.18280/rcma.310402
[18] Giordano, J., Burtschell, Y. (2012). Confrontation of genetic algorithm optimization process with a new reference case: Analytical study with experimental validation of the deflection of a cantilever beam. International Journal of Advanced Science and Technology, 49: 105-118.
[19] Jin, Y., Su, H.J. (2022). Machine learning models for predicting deflection and shape of 2D cantilever beams. In ASME 2022 International Design Engineering Technical Conferences and Computers and Information in Engineering Conference, St. Louis, Missouri, USA, https://doi.org/10.1115/DETC2022-89694
[20] Vu, M.H., Huynh, N.T., Nguyen, K.N., Tran, A.S., Nguyen, Q.M. (2022). Optimal stress and strain of helical gear and rack in the steering system. Mathematical Modelling of Engineering Problems, 9(3): 697-706. https://doi.org/10.18280/mmep.090316
[21] Khalid, F., Rabah, M., Salah, S., Hacene, A. (2021). A study of the thermo-mechanical behavior of a gas turbine blade in composite materials reinforced with mast. Revue des Composites et des Matériaux Avancés-Journal of Composite and Advanced Materials, 31(2): 101-108. https://doi.org/10.18280/rcma.310205
[22] Gharaibeh, M.A. (2022). Numerical solution for the mechanical bending of two elastically coupled plates problem. Mathematical Modelling of Engineering Problems, 9(5): 1432-1439. https://doi.org/10.18280/mmep.090535
[23] Attari, S., Rebhi, R., El-Hadj, A.A., Ikumapayi, O.M., Al-Dujaili, A.Q., Abdulkareem, A.I., Humaidi, A.J., Lorenzini, G., Menni, Y. (2023). Thermo-mechanical modeling and simulation of impact and solidification of an aluminum particle. Mathematical Modelling of Engineering Problems, 10(2): 389-397. https://doi.org/10.18280/mmep.100201
[24] Karash, E.T., Sultan, J.N., Najem, M.K. (2021). The difference in the wall thickness of the helicopter structure are made of composite materials with another made of steel. Mathematical Modelling of Engineering Problems, 9(2): 313-324. https://doi.org/10.18280/mmep.090204
[25] Najem, M.K., Karash, E.T., Sultan, J.N. (2021). The amount of excess weight from the design of an armored vehicle body by using composite materials instead of steel. Revue des Composites et des Matériaux Avancés-Journal of Composite and Advanced Materials, 32(1): 1-10. https://doi.org/10.18280/rcma.320101
[26] Karash, E.T. (2011). Modelling of unilateral contact of metal and fiberglass shells. Applied Mechanics and Materials Journal, 87: 206-208. https://doi.org/10.4028/www.scientific.net/AMM.87.206
[27] Karash, E.T., Alsttar Sediqer, T.A., Elias Kassim, M.T. (2021). A comparison between a solid block made of concrete and others made of different composite materials. Revue des Composites et des Matériaux Avancés, 31(6): 341-347. https://doi.org/10.18280/RCMA.310605
[28] Kassim, M.T.E., Karash, E.T., Sultan, J.N. (2023). A Mathematical model for non-linear structural analysis reinforced beams of composite materials. Mathematical Modelling of Engineering Problems, 10(1): 311-333. https://doi.org/10.18280/mmep.100137
[29] S. Sulaiman, S. Borazjani, and S. Tang, (2013), Finite element analysis of filament-wound composite pressure vessel under internal pressure. In IOP Conference Series: Materials Science and Engineering, p. 012061. https://doi.org/10.1088/1757-899X/50/1/012061
[30] Abdelghany, A.W., Taha, I., Ebeid, S. (2016). Failure prediction of fiber reinforced polymer pipes using FEA. International Journal of Engineering and Technical Research (IJETR), 4(2): 115-120.
[31] Ibrahim, M.B., Habib, H.Y., Jabrah, R.M. (2020). Preparation of kevlar-49 fabric/e-glass fabric/epoxy composite materials and characterization of their mechanical properties. Revue des Composites et des Matériaux Avancés-Journal of Composite and Advanced Materials, 30(3-4): 133-141. https://doi.org/10.18280/rcma.303-403
[32] Rahmani, H., Najafi, S.H.M., Ashori, A. (2014). Mechanical performance of epoxy/carbon fiber laminated composites. Journal of Reinforced Plastics and Composites, 33(8): 733-740. https://doi.org/10.1177/0731684413518255
[33] Kevlar® Aramid Fiber Technical Guide. https://www.dupont.com/content/dam/dupont/amer/us/en/safety/public/documents/en/Kevlar_Technical_Guide_0319.pdf, accessed on Aug. 18, 2021.