Belaid Salim*![]() | Babaghayou Meriam Imane
| Babaghayou Meriam Imane![]() | Maati Ahmed
| Maati Ahmed![]()
© 2023 IIETA. This article is published by IIETA and is licensed under the CC BY 4.0 license (http://creativecommons.org/licenses/by/4.0/).
OPEN ACCESS
Repairing structures damaged by fatigue through the use of composite patch bonding is an efficient and economical process to preserve structures and increase their lifespan. Much work is currently being carried out to improve this technique. In this work, a 3D nonlinear numerical simulation by finite element analysis was carried out to study the behavior of the crack front and determine the evolution of the stress intensity factor and the change of stress with respect to distance from the crack point. for an aluminum alloy plate containing a central crack, repaired asymmetrically with a composite patch. The repair of these plates must be more precise and reinforced around the crack point, therefore the stress are high and the stress integrity factor SIF is more important according to the results of this study.
structural repair, composite patch, stress intensity factor SIF, crack front, fem analysis, aluminum alloy 2024-T3, fatigue analysis, fracture mechanics
Mechanical components are subjected to cyclical stress during their operation. Failure occurs after a certain number of cycles. When a mechanical structure develops a fatigue crack, continuous monitoring of its propagation is often necessary to intervene before it reaches a critical size. Replacing the cracked structure can be expensive or even impossible within a reasonable time frame. Consequently, manufacturers seek reliable and cost-effective repair methods to keep the structure in service safely for a limited lifespan [1]. Various repair techniques have been developed, involving the bonding of composite patches to reinforce the cracked structure by modifying its behavior at the crack tip and thus extending its overall lifespan [2, 3]. This technique is widely applicable in the aeronautical industry with the aim of maximizing operational lifespan. To extend the lifespan of structures repaired with composites, several parameters can influence crack behavior, including the type of composite patch and its thickness [4]. Numerous experimental studies, modeling efforts, and numerical simulations have been undertaken to better understand the assessment of the remaining life of mechanical components [5, 6]. In general, predicting this remaining life is based on predicting the change in the stress intensity factor (SIF).
Our work is part of the study of the mechanical behavior of plates repaired by composite patches, it focuses on a numerical analysis using FEM with Abaqus simulation software on the variation of the SIF and the integral J screw about the tensile force applied to the plate and the type of composite used for the repair, especially in the vicinity of the crack point. This study is based on the laws of linear fracture mechanics [7] and digital analysis by FE, in order to see the most critical areas of a repaired assembly by composite patch, where the SIF is raised by ravage with the forces applied to the study model.
The collage method has been studied by many authors [6, 7]. The pioneering work assumed that the thickness of the cracked sheets were small, so that the dimensionality of the problem did not extend beyond the plane. These problems related to the stress intensity factor SIF were solved using two-dimensional elastostatic theory, Wang and Kuang [8]. This article presents the effect of the shear modulus of the adhesive, the thickness of the adhesive, the type of patch, the forces applied to the model on the evolution of the stress intensity factor of the crack emanating with a rectangular notch.
2.1 Structural repair methods, composite patch bonding
The design of a repair must check its static resistance, its durability and its function so that the whole (structure-patch-glue) responds to proper functioning according to the existing substructures. The initial design of the patch should conform to the geometry of the structure to be repaired, and should not cover existing fasteners that will require removal in the future.
A good design of a repair operation must satisfy the following points:
-The geometry of the patch (size and shape).
-The choice of patch material.
-The choice of the type of repair.
-Pre-installation.
Primary considerations must be taken when installing a repair operation which are: Surface preparation, heating, pressurization methods, the inspection process. This last technique has remarkable advantages compared to others, including:
-Homogeneous distribution of stress compared to bolting or riveting techniques which concentrate stress locally. this bonding thus offers a homogeneous distribution of stress and makes it possible to limit peaks.
-No change in the surface and texture of the assembled materials: Solder temperatures can modify the materials and therefore the mechanical properties of the substrates. Additionally, welding, riveting and bolting all affect the visual appearance of the parts, Figure 1.
Figure 1. Typical repair on a metallic surface using composite patching [4]
2.2 Parameter of the break
Three parameters were used to study the characteristics of the singular zone:
-Stress intensity factor K.
-Energy restitution rate G.
-The integral J.
K is the parameter of the direct local approach. G and J are the parameters of the global energy approach.
Stress intensity factor (SIF)
In the context of brittle fracture mechanics, the stress intensity factor K (SIF) is the significant parameter allowing to know the state of stress and strain at any crack tip. This parameter makes it possible to quantify the harmfulness of a crack in a structure under a given loading. Krueger [9] initially proposed the virtual closure technique (VCCT) in 1977 for two-dimensional cases. VCCT is a very attractive SIF extraction technique due to its good accuracy and a relatively simple algorithm to calculate the SIF for all three fracture modes. Paolino et al. [10] has extended the proposed technique. Currently, the three-dimensional virtual crack closure technique (3D VCCT) is often chosen as a tool for SIF calculations and which is used by the finite element simulation the explicit version of the software ABAQUS. In a material whose behavior is elastic and linear, the general appearance of the stress field near the tip of the crack is as follows:
$\sigma_{i j}=\frac{K_m}{\sqrt{2 \pi r}} f_{i j}(\theta)$ (1)
where,
$\sigma_{i j}$: Tensor of opposites.
$K_m$: Stress intensity factor.
$\theta$: Polar angle with respect to the end of the crack.
$r$: Polar coordinates of the considered point.
Mode I crack propagation
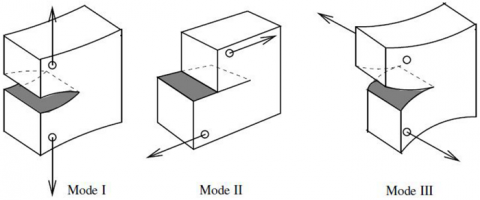
-Toughness of the material, the crack propagation criterion proposed by Irwin [11] concerns the stress intensity factors, and more precisely on mode I, which is the opening mode, characterized by the intensity factor KI. This mode is intuitively the most dangerous. The stress intensity factor K is generally noted with a different index corresponding to the loading mode in particular KI, Figure 2.
Figure 2. Modes of stress on a crack [4]
Irwin [11] postulates that there exists a critical value of K, called toughness (and denoted KIc) it is a characteristic of the material, independent of the geometry or loading of the specimen below which the crack does not evolve. Once this critical value is reached, the crack progresses.
Generally speaking, the FIC depends on the applied stress, crack size and geometry. Irwin postulates that the condition is $K_I \leq K_{I C}$ represented a breakup criterion; K and KIC are given by the following relations:
$\begin{aligned} K_I & =Y \sigma \sqrt{\pi a} \\ K_{I C} & =Y \sigma \sqrt{\pi a_C}\end{aligned}$ (2)
where,
Y: Geometric factor (correction coefficient).
a: The initial length of the crack.
σ: The applied uniform stress.
KIc: The tenacity of the material (determined experimentally).
ac: The critical crack length.
Integral of RICE (j)
The contour integral J is used as a characteristic parameter of the stress state near the tip of a crack in materials whose behavior is nonlinear [11]. It simplifies the mathematical description of the behavior:
$J=\int_{\Gamma} W d y-T_i \frac{\partial u_i}{\partial x} d s$ (3)
where,
Γ: Any closed contour surrounding the crack tip.
Ti: Constrained vectors, ($T i=\sigma i j . n i$).
ui: Displacement vector.
S: Curvilinear abscissa.
W: Strain energy density.
$W=\int_{\Gamma} \sigma_{i j} d \in_{i j}$ (4)
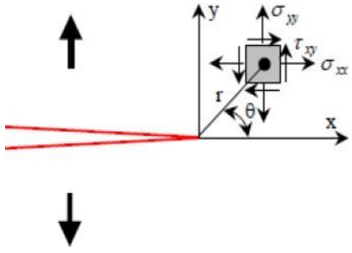
Generally, the stress field takes the following form (presence of the three modes):
$\sigma_{i j}=(2 \pi r)^{\frac{-1}{2}}\left[k_1 f_{i j}^1(\theta)+k_2 f_{i j}^2(\theta)+k_3 f_{i j}^3(\theta)\right]$ (5)
fij are functions depending only on the polar angle as shown in Figure 3.
Figure 3. Stress near the end of a crack mode I [11]
3.1 Software and simulation steps
Our study was carried out with the professional finite element calculation software Abaqus. The steps of this simulation are summarized in Figure 4.
Figure 4. Steps to follow for the simulation
3.2 Presentation of geometric models
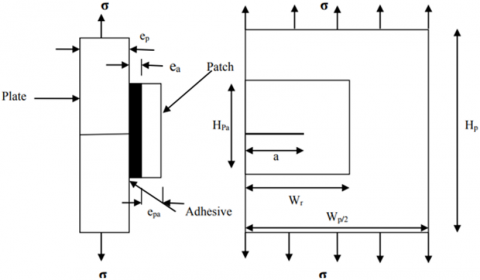
The geometry studied is that of a standardized CT specimen. This structure has a defect in the form of an axisymmetric notch emerging from the specimen. A model used when simulating the mechanical behavior of plates repaired by composite patch such as Rachid et al. [12, 13]. The geometry of the model studied is given by the Figure 5.
Figure 5. Geometry of the studied model
We considered a square plate with a length HP=254 mm, and a width WP=254 mm, with a thickness eP=4.46mm. The plate is made of 2024-T3 aluminum whose elastic properties are as follows: Young's modulus EP=72 GPa and the Poisson's ratio vp=0.33. This plate is stressed in uniaxial tension along the direction of its height (the Y axis) with a stress σ =250 MPa. We assume the existence of a central crack of length (2a) repaired by:
A Boron/Epoxy patch with a length: Hpa =150 mm, width Wpa =100 mm and thickness epa=2 mm. The patch is considered an orthotropic material with the following elastic properties: Longitudinal Young's Modulus EL=208 GPa Transverse Young's Modulus ET=19.60 GPa Longitudinal Shear Modulus GL=7.20 GPa Transverse shear modulus GT=5.50 GPa Longitudinal Poisson's ratio υL=0.30 Transversal Poisson's ratio vT=0.28, same thing for the Epoxy Graphite test tube.
The adhesive used in our study is ADEKIT A-140, it is a high strength two-component Epoxy adhesive often applicable in aeronautics sector. This crack is perpendicular to the forces applied to the model (plate and patch).
The analysis involved a three-dimensional finite element meth-od by using a commercially available finite element code ABAQUS [14], any finite element calculation requires the definition of boundary conditions. For reason of symmetry only the 1/4 of the structure was modeled, because it is symmetrical with respect to the median plane Figure 6. In the x-z plane of the specimen, symmetrical boundary conditions are applied (displacement in the y direction is thus blocked).
Figure 6. Application of boundary conditions and loading
The repair patch is chosen with a thickness of 2 mm, and four plies of 0.5 mm per ply and fiber directions of 0° and 90°. Figure 7 presents the parameters of the patch after analysis [15] on the Abaqus simulation software, in the properties section.
Figure 7. Orientation of the folds in the model used
The dimensions and material properties of the repaired model are given in Table 1.
3.3 The mesh module
A regular mesh is carried out for all the structure. This mesh remains the same throughout the calculation in order to avoid any influence of the mesh on the results [16]. The central crack in the middle of the plate results in a geometric singularity causing stress concentration. Therefore, a refined mesh made around the crack The mesh was refined near the crack tip area with an element dimension of 0.063 mm using at least fif-teen such fine elements in the front and back of the crack tip. The number of elements used in this analysis is 48,634 and number of degrees of freedom DOF is: 345,023.
Table 1. Dimensions and material properties of the repaired model
|
Properties and Dimensions |
Materials |
|||
|
Aluminium 2024-T3 |
Adhesive (L’ADEKIT A-140) |
Bore/Epoxy |
Graphite/Epoxy |
|
|
E1 (MPa) |
72 |
0.97 |
208 |
172 |
|
E2, E3 (MPa) |
- |
- |
19.65 |
10.34 |
|
ν12 , ν13 |
0.33 |
0.32 |
0.17 |
0.3 |
|
ν23 |
- |
- |
0.04 |
0.18 |
|
G12 (MPa) |
- |
- |
7.20 |
4.82 |
|
G13 , G23(MPa) |
- |
- |
5.50 |
3.1 |
|
W (mm) |
254 |
150 |
150 |
150 |
|
H (mm) |
254 |
100 |
100 |
100 |
|
E (mm) |
4.46 |
0.2 |
2 |
2 |
The mesh module allows us to generate a finite element mesh of the assembly model. The mesh is obtained using C3D20RH element type (A 20-node quadratic brick, hybrid, linear pressure, reduced integration) with hexahedral finite element meshes by the sweeping process as shown in Figure 8.
Figure 8. Typical model mesh type
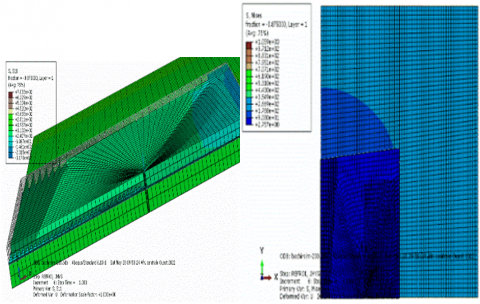
The plate, adhesive film and patch were discretized into four, two and two layers of 20-node ISO-parametric brick elements respectively. Following the direction of the thickness ''ZZ axis'' Singular quarter point elements at crack tip region were considered. Typical mesh of a quarter of the repaired plate is shown in the Figure 9.
Figure 9. Model and typical mesh of ¼ of the repaired plate
Quadratic cells make it possible to more faithfully describe the limit of the object (we approximate a curve with a parabola instead of a chord), but increasing the number of points is necessary to describe a cell. This item works great and is a great general purpose item. It works well for isochoric material behavior as well as for bending and rarely exhibits an hourglass despite the reduced integration.
The objective of this section is to study the mechanical behavior of a plate with a central crack perpendicular to the loading direction and to assess how this direction has an impact on the distribution of constraints and the propagation of cracks.
4.1 Crack behavior analysis
Initially, and to position the problem, it is first advised to check the case of a crack with a front perpendicular to the loading face, initial state (no inclination) [16]. As shown in Figure 10. This first configuration represents the initial state before the growth of the crack.
Figure 10. FE model of the studied plates (crack front is parallel to the thickness direction)
In the numerical analysis of cracked structures repaired by patch, the stress intensity factor in mode I(KI) as a function of the force applied to the plate by patched specimens. We have defined an average value of the FIC to present the effective stress intensity factor for a given applied force. In this last reference. Among these authors who used the square root of the calculated value and the average value of the FIC [17]. Note that, for the repaired specimens, the stress intensity factor KI was taken from the unpatched side across the crack front, where the maximum value was obtained. On the other hand, the average of all the values of the stress intensity factor along the crack front was calculated and reported on graphs. To observe the change of different parameters such as Kic and J-integral with respect to the mechanical properties of the repair patch, some patchs were changed for different composites.
4.2 Effect of the mechanical properties of the adhesive
The adhesive plays an important role in the repair by bonded composite patches because, on the one hand, it ensures the transfer of the loads between the composite patch and the cracked plate, and on the other hand, it holds the two structures together. It is for this reason that several works have been carried out to study the effect of the mechanical properties of the adhesive on the repaired structure [16, 17]. The best quality of adhesives is characterized by a low shear modulus, which helps to alleviate the stress transmitted by the adhesion. In the case of repaired structures, the objective is to transmit the maximum stress to the adhesive and consequently to the patch in order to reduce them at the crack tip. Theoretically, therefore, it is better to use adhesives with a high shear modulus (bad quality adhesive) to repair cracks or defects. Figure 11 gives a better explanation of the effect of the behavior law of the adhesive on the stress intensity factor value. This latter shows that increasing the shear modulus of the adhesive reduces the bond strength, which can generate bond failure. Therefore, the choice of the adhesive (characterized by its shear modulus) to repair the cracks must be optimized in order to allow the transmission of the stress to the patch and to avoid the failure of the adhesive [18].
Figure 11. Evolution of relative stress intensity factor versus shear modulus of the adhesive
4.3 Boron/Epoxy patch simulation
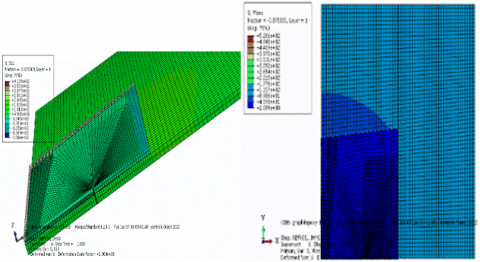
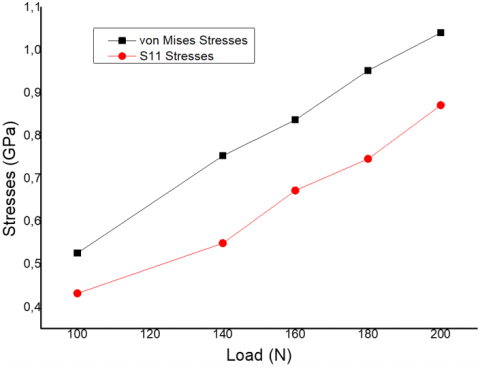
Figure 12. S11 and von Mises stress for applied load F=100 N with Boron/Epoxy patch
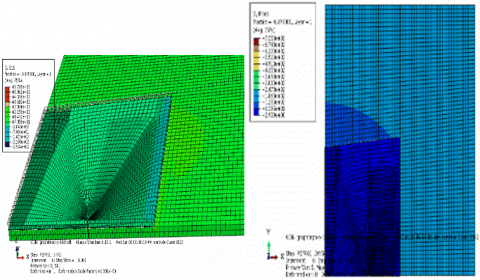
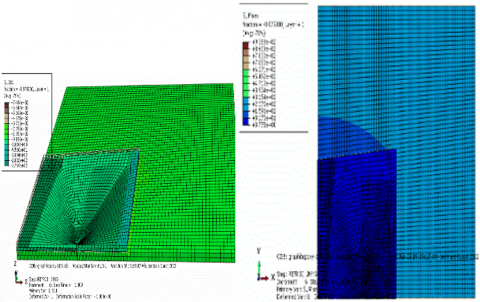
Some results can be visualized using the graphical interface of the calculation software. For example, Figures 12-15 show the von Mises ad longitudinal stress (S11) for four tensile loads (100 N, 140 N, 180 N and 200 N) respectively.
Figure 13. S11 and von Mises stress for applied load F=140 N with Boron/Epoxy patch
Figure 14. S11 and von Mises stress for applied load F=180 N with Boron/Epoxy patch
Figure 15. S11 and von Mises stress for applied load F=200 N with Boron/Epoxy patch
We notice a stable increase in the Van Mises and S11 stress compared to the tensile forces applied to the model, except at the force 200 N where the increase in the Van Mises stress becomes more significant at 1.5 GPa (it does not mean that we are going to reach this value during our simulation), so after 180 N, we must modify the crack repair parameters with the Boron/Epoxy composite patch, such as the thickness or the shape of the patch (see Figure 16).
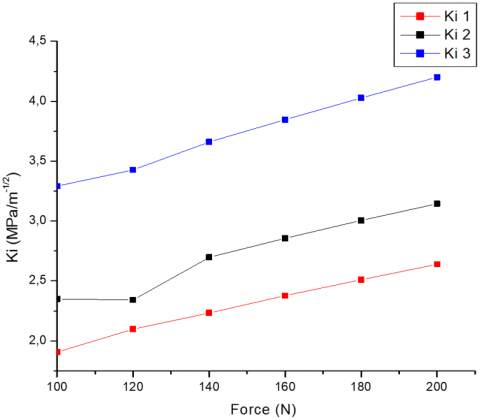
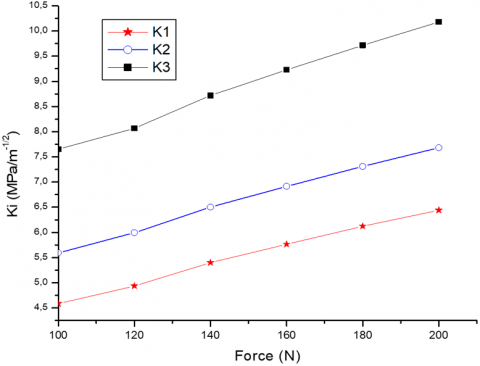
The stress intensity factor also varies as a function of the tensile force applied to the model. Figure 17, for example, shows different curves describing this variation around a crack tip for the three different fracture modes in the case of a Boron/Epoxy patch. Similarly, Figure 18 represents the change in J-integral as a function of the applied load.
Figure 16. S11 and von Mises stress for all loads applied with the Boron/Epoxy patch, at the danger point on the simulation model
-Curve Force/Ki, for Boron/Epoxy
Figure 17. Variation of KIi versus tensile load with Boron/Epoxy patch
-Curve Force/Integral J, for Boron/Epoxy
Figure 18. Variation of J-integral versus tensile load with Boron/Epoxy patch
We observed an increase in the Ki and the J Integral for the three values obtained through simulation at a critical point of the crack, in relation to the increasing forces applied to the model. This is logical and confirms that the speed of propagation of the repairing crack will be greater if the tensile force is higher, for a force apply 200 N we observed a ki value of 4.2 MPa.m ½. The bonded composite patch analysed is the Boron/Epoxy, which has been used successfully by Rachid et al. [12].
4.4 Simulations Graphite/Epoxy Patch results
Figures 19-22 show the von Mises and longitudinal stress (S11) for four tensile loads (100 N, 140 N, 180 N and 200 N) respectively.
Figure 19. S11 and von Mises stress for applied load F=100 N in the case of a Graphite/Epoxy patch
Figure 20. S11 and von Mises stress for applied load F=140 N load in the case of a Graphite/Epoxy patch
Figure 21. S11 and von Mises stress for applied load F=180 N with Graphite/Epoxy patch
Figure 22. S11 and von Mises stress for applied load F=200 N in the case of a Graphite/Epoxy patch
Figure 23. S11 and von Mises stress for all loads applied with the Graphite/Epoxy patch, at the danger point on the simulation model
For this type of composite, there is a consistent increase in both the von Mises and S11 stress in response to the tensile forces applied to the model. Even at a force of 200 N, the increase in von Mises stress remains linear and stable, indicating the stability of the mechanical properties of the Graphite/Epoxy patch such as resistance to tensile forces (see Figure 23).
-Curve Force/Ki, for Graphite/Epoxy
The results are consistent with those reported in the literatures [19, 20]. The following graphs (Figures 24 and 25) present the variation of Ki and J-integral around a crack tip for the three different fracture modes depending on the tensile load in the case of a Graphite/Epoxy patch.
Figure 24. Variation of Ki versus tensile load in the case of a Graphite/Epoxy patch
For the Graphite/Epoxy patch the Kic can reach 10 MPa.m ½ for a linear increase of the three FIC, so these results show a significant difference in FIC when simulating the two models repairing two different patches, and that the Kic of the Graphite/Epoxy patch is larger than the Kic of the Boron/Epoxy composite.
-Curve Force/Integral J, for Boron/Epoxy
Figure 25. Variation of J-integral versus tensile load in the case of a Graphite/Epoxy patch
4.5 Stress variation during crack propagation
In order to observe the change in the state of stress in the plate, especially around the crack tip, a path of 5 points starting from the center of the crack was chosen as shown in Figure 26.
Figure 26. Loading path marked towards the center of the crack
The numerical simulation of the state of stress along the considered path depends on the nature of the patch:
-Boron/Epoxy patch
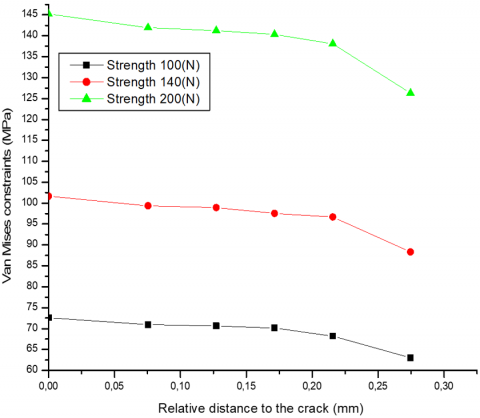
The von Mises and longitudinal stress (S11) as a function of distance from the center of the crack and the tensile load are presented in Table 2.
The results found are presented in Figures 27 and 28, in order to see the variation of the stress according to the distance from the crack point.
Note that the S11 and von Mises stress increase as the applied tensile force on the model increases, indicating a higher risk of rupture when the tensile force is high, which is expected. Additionally, stress decrease as the points move away from the crack locations.
-Graphite/Epoxy patch
The results found are presented in Table 3, Figures 29 and 30, in order to see the variation of the stress according to the distance from the crack point.
Table 2. S11 and S-Mises stress along the path in the case of Boron/Epoxy patch
|
F Dist (mm) |
100 N |
140 N |
200 N |
|||
|
S11 (MPa) |
S-Mises (MPa) |
S11 (MPa) |
S-Mises (Mpa) |
S11 (MPa) |
S-Mises (MPa) |
|
|
0 |
72.59 |
71.87 |
101.55 |
100.507 |
144.9 |
143.32 |
|
0.07547 |
64.72 |
62.66 |
90.57 |
87.71 |
129.30 |
125.26 |
|
0.12710 |
63.38 |
61.85 |
88.71 |
86.5744 |
126.666 |
123.64 |
|
0.17137 |
62.74 |
61.52 |
87.82 |
86.1187 |
125.406 |
122.99 |
|
0.21560 |
62.27 |
61.26 |
87.16 |
85.7603 |
124.482 |
122.478 |
|
0.27459 |
61.51 |
59.95 |
86.10 |
83.9249 |
122.966 |
119.87 |
Figure 27. Variation of S11 stress, with respect to the distance to the crack point at different forces
Figure 28. Variation of Van Mises stress, with respect to the distance to the crack point at different forces
Table 3. S11 and S-Mises along the path in the case of Graphite/Epoxy
|
F Dist (mm) |
100 N |
140 N |
200 N |
|||
|
S11 (MPa) |
S-Mises (MPa) |
S11 (MPa) |
S-Mises (MPa) |
S11 (MPa) |
S-Mises (MPa) |
|
|
0 |
66,68 |
72,61 |
93,35 |
101,66 |
133,36 |
145,23 |
|
0.07547 |
65,71 |
70,95 |
92 |
99,34 |
131,4 |
141,94 |
|
0.127106 |
64,65 |
70,65 |
90,56 |
98,91 |
129,28 |
141,23 |
|
0.171371 |
63,07 |
70,12 |
88,29 |
97,56 |
126,13 |
140,32 |
|
0.215607 |
59,55 |
68,21 |
83,37 |
96,67 |
119,11 |
138,11 |
|
0.274597 |
37,93 |
63,02 |
64,25 |
88,3 |
76,56 |
126,31 |
Figure 29. Variation of S11 stress, with respect to the distance to the crack point at different forces
Figure 30. Variation of Van Mises stress, with respect to the distance to the crack point at different forces
We observe a decrease in S11 stress to 280 MPa at a point 0.28 mm from the crack, compared to the 68 MPa stress at the crack point. This illustrates that stress are at their maximum in the vicinity of the crack, which is expected. This behavior indicates a decrease in stress further from the crack point.
For the 2 composites the following Figures 31 and 32.
Figure 31. Variation of Van Mises stress, with respect to the distance to the crack point according to the two models Bore/Epoxy and Graphite/Epoxy
Figure 32. Variation of S11 stress, with respect to the distance to the crack point according to the two models
-Bore/Epoxy and Graphite/Epoxy
Note that for this patch the increase in S11 and Van Mises stress, each time the tensile force applied to the model increases from 60 MPa to 127 MPa, which means that the risk of rupture increases when the tensile force is high, which is expected. Same thing for the Boron/Epoxy composite, the reduction in stress each time the tips move away from the crack points, therefore high stress at the crack point, and a significant risk of rupture at point 0. The risk of rupture is greatest at the fissure point, and this risk deprives a liver far from the fissure point. The reduction of S11 stress at the point 0.27 mm from the crack for the model repaired by the Graphite/Epoxy composite confirms the results found in Figure 18, where this material is stronger than Boron/Epoxy.
This work deals with the problem of the failure to fail a structure with a central crack. In order to increase the remaining lifespan, cracked structures can be repaired by different methods. Among other things, the Patch link remains the most used technique in the aeronautical and naval fields. In particular, composite patches are the most used. With these, the structure is repaired symmetrically (corrected double side) or asymmetrically (unilateral patty). Experimental observations confirm the fact that crack during its spread adopts curved configurations. In addition, the theories of fracture mechanics are based on the energy balance during the propagation of cracks [21]. This balance with precision requires that the critical energy of the creation of a new surface must be reached so that the crack advances.
A numerical simulation of a cracking plate and repairing by finished elements to the aid of the Abaqus software, in 3 dimensions, was carried out to study the effect of the change of composites, and loads apply to the perpendicular plate to the plane of its propagation of crack. The results find treats the problem of configuring the crack and the most dangerous areas when repairing the plates by patch. Thus, the constraints to raise during the Essay at 200 N for Boron/Epoxy proves that Graphite/Epoxy is a little better in resistance than boron, but with that subject to reservation see the fic of the model analyzed with the Graphite/Epoxy patch. This work has contributed positively to the mechanical behavior of the cracks and to the repair, in particular the SIF which shows the problem of crack propagation on the repaired plates, and the most dangerous stress on the model near the crack point [22, 23]. Where it is necessary reinforce the repair, and finally choose the most suitable material and its parameters, and which increases the lifespan of this plate crack and repair by patch.
Furthermore, the integral J which behaves linearly with the increase in charging loads, and which is more important for the Graphite/Epoxy model. The two composites behave differently during the simulation, which is found by Sorocinschi et al. [24, 25] and which is found during this study. This work has contributed positively on the mechanical behavior of cracks and repairing, especially the critical SIF which shows the problem of the propagation of cracks on the Retaire plates in order to choose the most adapted material, and which increases the hard life of this plate or piece.
In this context, researchers should prioritize the study of effective adhesives and materials for these types of repairs, while adhering to fracture mechanics principles.
|
ep |
Thickness, mm |
|
Y |
Geometric factor (correction coefficient) |
|
KIc |
Tenacity , Pa m½ |
|
J |
The contour integral |
|
Ga |
Shear modulus of the adhesive, Mpa |
|
EL |
Longitudinal Young's Modulus, GPa |
|
ET |
Transversa Young’s Modulus, GPa |
|
Greek symbols |
|
|
σ |
Stress, MPa |
|
$\theta$ |
The polar Angel with respect to the end of the crack, rad |
|
Γ |
Any closed contour surrounding the crack tip, mm |
|
vT |
Transversal Poisson's ratio |
|
vL |
Longitudinal Poisson's ratio |
|
Ɵ |
Dimensionless temperature, ℃ |
|
Subscripts |
|
|
r |
Polar coordinates of the considered point |
|
SIF |
Stress intensity factor |
[1] Mao, H., Mahadevan, S. (2002). Fatigue damage modelling of composite materials. Composite Structures, 58(4): 405-410. https://doi.org/10.1016/S0263-8223(02)00126-5
[2] Natech, T. (2015). Réhabilitation et Renforcement des Canalisations sous pression en présence des défauts de surfaces. Doctoral thesis, Mohamed Boudiaf Oran University.
[3] Van Hung, N., Hung, V.V., Viet, T.B. (2018). The effect of crack width on the service life of reinforced concrete structures. I IOP Conference Series: Earth and Environmental Science, 143(1): 012044. https://doi.org/10.1088/1755-1315/143/1/012044
[4] ASTM E 1820. (2005). Standard Test Method for Measurement of Fracture Toughness. ASTM International, West Conshohocken, USA.
[5] Cerniglia, D., Nigrelli, V., Pasta, A. (1999). Experimental and numerical determination of stress intensity factor in composite materials. In Conference Proceedings ICCM-12, Paper 932, Europe.
[6] Nastri, E., Todisco, P. (2022). Macromechanical failure criteria: Elasticity, plasticity and numerical applications for the non-linear masonry modelling. Buildings, 12(8): 1245. https://doi.org/10.3390/buildings12081245
[7] Sims, J.R. (2012). Standards and codes to control hydrogen-induced cracking in pressure vessels and pipes for hydrogen gas storage and transport. In Gaseous Hydrogen Embrittlement of Materials in Energy Technologies, pp. 177-192. https://doi.org/10.1533/9780857093899.1.177
[8] Wang, T.J., Kuang, Z.B. (1996). Stress, deformation and damage fields near the tip of a crack in a damaged nonlinear material. International Journal of Fracture, 79: 1-26. https://doi.org/10.1007/BF00017710.
[9] Krueger, R. (2004). Virtual crack closure technique: History, approach, and applications. Applied Mechanics Reviews, 57(2): 109-143. https://doi.org/10.1115/1.1595677
[10] Paolino, D.S., Geng, H., Scattina, A., Tridello, A., Cavatorta, M.P., Belingardi, G. (2017). Damaged composite laminates: Assessment of residual Young's modulus through the Impulse Excitation Technique. Composites Part B: Engineering, 128: 76-82. https://doi.org/10.1016/j.compositesb.2017.07.008
[11] Irwin, G.R. (1957). Analysis of stresses and strains near the end of a crack traversing a plate. Journal of Applied Mechanics, 24(3): 361-364. https://doi.org/10.1115/1.4011547
[12] Rachid, M., Serier, B., Bouiadjra, B.B., Belhouari, M. (2012). Numerical analysis of the patch shape effects on the performances of bonded composite repair in aircraft structures. Composites Part B: Engineering, 43(2): 391-397. https://doi.org/10.1016/j.compositesb.2011.08.047
[13] Khalili, A., Kromp, K. (1991). Statistical properties of Weibull estimators. Journal of Materials Science, 26: 6741-6752. https://doi.org/10.1007/BF02402669
[14] Hibbitt, I. (2000). Karlsson & Sorensen, ABAQUS/CAE User’s Manual, Hibbitt, Karlsson Sorensen.
[15] Salim, B., Chabira, S. F., Balland, P., Maati, A., Sebaa, M. (2022). Thermal aging and catalyst concentration effects on thermo-dynamical and mechanical properties of a polyester fiberglass composite. Metallurgical and Materials Engineering, 28(1): 125-139. https://doi.org/10.30544/630
[16] Le Cromb, B. (2010). Evaluation ultrasonore des réparations de structures métalliques par collage de patchs composite. Doctoral thesis, University of Bordeaux 1, France.
[17] Garnier, C., Pastor, M.L., Eyma, F., Lorrain, B. (2011). The detection of aeronautical defects in situ on composite structures using Non Destructive Testing. Composite structures, 93(5): 1328-1336. https://doi.org/10.1016/j.compstruct.2010.10.017
[18] Hautier, M. (2010). Analyse des réparations des matériaux composites: mise en œuvre d'un procédé par infiltration et étude du comportement mécanique. Doctoral thesis, Paul Sabatier-Toulouse III University, France.
[19] Luo, G.M., Lee, Y.J. (2009). Simulation of constrained layered damped laminated plates subjected to low-velocity impact using a quasi-static method. Composite Structures, 88(2): 290-295. https://doi.org/10.1016/j.compstruct.2008.04.009
[20] Sun, C.T., Potti, S.V. (1996). A simple model to predict residual velocities of thick composite laminates subjected to high velocity impact. International Journal of Impact Engineering, 18(3): 339-353. https://doi.org/10.1016/0734-743X(96)89053-1
[21] Cheng, P. (2010). Etude et optimisation de la réparation des composites stratifiés par collage des patchs externes. Doctoral dissertation, Dijon.
[22] Leski, A. (2007). Implementation of the virtual crack closure technique in engineering FE calculations. Finite Elements in Analysis and Design, 43(3): 261-268. https://doi.org/10.1016/j.finel.2006.10.004
[23] Rybicki, E.F., Kanninen, M.F. (1977). A finite element calculation of stress intensity factors by a modified crack closure integral. Engineering fracture mechanics, 9(4) : 931-938. https://doi.org/10.1016/0013-7944(77)90013-3
[24] Sorocinschi, E., Rodríguez, E.S., Álvarez, V.A., Vázquez, A. (2007). Reparation of composites used in naval industry. Journal of reinforced plastics and composites, 26(17): 1821-1829. https://doi.org/10.1177/0731684407081384
[25] Kaddouri, K., Ouinas, D., Bouiadjra, B.B. (2008). FE analysis of the behaviour of octagonal bonded composite repair in aircraft structures. Computational materials science, 43(4): 1109-1111. https://doi.org/10.1016/j.commatsci.2008.03.003