Gunja Santhosha Rathnam*![]() | Chanamala Ratnam
| Chanamala Ratnam![]() | Govada Rambabu
| Govada Rambabu![]()
© 2023 IIETA. This article is published by IIETA and is licensed under the CC BY 4.0 license (http://creativecommons.org/licenses/by/4.0/).
OPEN ACCESS
Among the materials used most often in engineering are titanium alloys, especially Ti6Al4V. This is because Ti6Al4V has more advantageous characteristics. Due of diminished wear properties, Ti6Al4V's applications have been severely constrained. More focus is being paid to strategies including the creation of novel coatings, the advancement of wear resistance materials and the utilization of nanomaterials to enhance wear resistance. In this study, we aim to simulate the phenomenon of contact that occurs between the tool and workpiece during machining process. The main focus of attention of this simulation is to evaluate the COF (coefficient of friction), wear rate for 5 speed and loading conditions. The experiments were conductedon a PVD coated titanium alloy as TiN, TiAlN, TiN+TiAlN for duration of 5 minutes with loads varying form of 15 to 25 kg in 1 step increment with disk speeds from 400-900 rpm as Taguchi analysis. After the Ti6Al4V substrate had its surface treated, an X-ray fluorescence test technique was used to integrate a thin layer of nickel coating measured between 40 and 42 micrometres. The coating was applied using thin film PVD magnetron sputtering nitride coatings, and the process was carried out in accordance with ASTM standards.
PVD duplex thin film coating, Material science, COF, process parameters, Taguchi-DOE
Advanced materials that are used in engineering, including metallic alloys, ceramics, and composites, are commonly used in demanding operating conditions, leading to issues such as wear, corrosion, and fatigue. The current scarcity of raw materials and energy resources necessitates proactive measures to mitigate material failures. Titanium (Ti) and its alloys are highly sought-after engineering materials because of their remarkable properties, including a strength-to-weight high ratio, elastic modulus low, anti-magnetic characteristics, excellent compatibility with living organisms, and acceptable resistance to corrosion. Among alloys of titanium, Ti6Al4V has emerged as the most advantageous option since its deut in the early 1950s. Presently, Ti6Al4V alloy finds extensive utilization in industries such as automotive, aerospace, chemical, marine, and biomedical, contributing to nearly 50% of global titanium production.
Despite its favorable qualities, Ti6Al4V (Grade 5) titanium alloy exhibits suboptimal tribological properties characterized by inadequate resistance to wear, reduced hardness and an elevated coefficient of friction. Hence, there is a pressing need to enhance these properties in order to boost the performance of engineering parts and components toporolong their operational lifespan, thereby reducing unexpected failures. In this section provides a thorough comprehensive literature review of titanium alloy and its potential applications in engineering components. Additionally, we delve into Surface Modification Techniques, encompassing coatings like Titanium Aluminum Nitride (TiAlN) coating, Aluminum Chromium Nitride (AlCrN) coating, the use of a Chromium interlayertoenhance bonding strength and the application of Molybdenum disulphide (MoS2) coating. This segment also examines various tribological testing methodologies, including the scratch test, pin-on-disc test, and reciprocating tribometer test.
The Titanium Grade 5 alloy known as Ti6Al4V is mostly used because of its excellent mechanical properties used in joint replacement [1] including those conferred by the surface such as resistance to corrosion and bioactivity it is utilized in dental implants and orthopaedics [2] due to its resistance to corrosion used in marine applications [3] light weight/low density and high strength used for air craft, missile, artillery and dental implants [4] used in medical domain due to its biocompatibility [5]. Titanium alloys which falls into the category of a two phase (α-β) group contributes 45% to 60% of total titanium products are used in aerospace industry [6]. due to its poor formability and unalienable quality of this titanium alloy forming and machining of these alloys are most important problems in industries today [7]. As Vanadium is an isomorphic and β stabilizer because of this presence in Ti6Al4V it is high thermal stability [8]. As titanium grade 5 alloy is also know that it possesses poor tribological properties [9] which cause in elavated wear rates, a high coefficient of friction and diminished shear resistance.
Ti6Al4V earned its reputation as a premier titanium alloy due to its exceptional properties, distinguishing it from most other existing titanium alloys for various applications have indeed been developed through optimization and enhancements based on Ti6Al4V. As of now, Ti6Al4V cotinues to be the most widely and successfully utilized titanium alloy, representing roughly 50% of the global population wide manufacturing titanium alloys [10]. However, it has certain drawbacks, comprising reduced surface hardness, a pronounced coefficient of friction, and limited resistance to abrasive wear. These limitations make it unsuitable for certain engineering conditions, particularly those related to tribology. Consequently, these shortcomings have significantly restricted or even excluded the borader applications of Ti6Al4V in various industries [11]. To date, various surface treatment techniques methods have been employed to enhance the resistance wear of titanium alloys, including ion implantation [12]. thermal spraying [13], physical vapor deposition (PVD) [14], and chemical vapor deposition (CVD) [15].
In many researches a variety types of PVD (Physical Vapour Deposition) coatings are employed to curtail wear of titanium grade 5 alloy [16] along with nitride coatings [17] etc. Physical Vapour deposition method is coating vapourisation technique that transforms coating material to the gaseous state by heating electron beam to deposit on the substrate’s surface [18]. Physical Vapour Deposition coatings are categorised into two important families traditional resistant to wear coatings the carbides and nitrides include TiN, TiCN, TiAlN, CrN among others which are worthy to increase resistance to coefficient of friction and wear [19]. Because of high hardness nitride and carbide coatings are hard which they play an important role in surface engineering parts for two decades [20]. Wear resistant coatings are Titanium Nitride [21]. Developed in early 1970 [22]. Coating which has high hardness are mostly used for anti-wear applications [23]. Excellent wear resistance and hardness the TIN film coating has also been used for orthopedic prosthesis and cardiac valves [24]. Yoneyama et al [25] demonstrated that an improved corrosion resistance and a consistent corrosion potential could be achieved by TiN and DLC coatings Wang et al. [26] showed a relationship exists between hardness and wear rate. When hardness increases wear decreases. Navinšek et al. [27] showed comparison of PVD process and galvanic that can produce ceramic coatings and metallic. To decrease wear two showed positive results to decrease wear. Fernández-Abia et al. [28] evaluated the effectiveness of the Physical Vapour Deposition (PVD) coated advanced tools for operating turning of difficulty to machine machines.
Endrino et al. [29] discussed the impact of AlCrNbN, AlCrN, AlTiN, TiAlN coating on wear characteristics and lifespan of finishing carbide tools. Ensinger et al. [30] observed the wear and corrosion behavior of PVD coated on Al and stainless steel by sputtering coating with ion beam. Hoche et al. [31] conducted a study into the chemical, structural, and electrochemical properties of TiMgAlN based PVD coating materials were investigated. These coatings were examined for their ability to provide corrosion protection and wear resistance to magnesium alloys. The study revealed that as the magnesium (Mg) content in the coatings was increased there was an enhancement in both mechanical and electrochemical properties. This improvement in properties indicates that TiMgAlN based coatings could be beneficial for applications requiring corrosion protection and wear. Bayón et al. [32] analysed the corrosion and wear behaviour of PVD process of Cr/CrN coatings with various thickness of individual layer deposited on substrates namely steel F1272 and silicon. The deposition was accomplished using the cathode arc methods part of the of PVD (Physical Vapour Deposition) process. It was summarized from the results that the coating of longer bilayer period became the most safety surface under wear- corrosion conditions. Oskouei and Ibrahim [33] considered the fatigue properties of TiN coated on aluminum alloy 7075-T6 by using Physical Vapour deposition (PVD). From the fatigue test and tensile test, it was found that the coated Al alloy substrate exhibit more reductions in the yield and tensile strength. Gali et al [34] observed several types of Physical Vapour Deposition coatings (TiN, TiCN, TiAlN, CrN, Cr and DLC) were applied to M2 steel rolls and their performances compared with an uncoated roll. Conclusion of results were that, during hot rolling TiAlN coating had lowest Coefficient of Friction, the DLC coating had most minimal COF during cold rolling and highest during hot rolling. Costa et al. [35] observed that Titanium Nitride coating reduced the axial fatigue strength of Ti6Al4V alloy. The effect of Titanium nitride deposited by PVD on the fatigue strength of Ti6Al4V alloy are found.
To improve TiN coatings properties Al is added to give better performance in corrosion and wear [36]. For high-speed machining TiAlN coatings have more resistance to oxidation when compared to TiN [35]. Many studies reported that the best wear resistance is due to the formation of film which is stable Al2O3 on TiAlN coatings [36]. Li et al. [37] suggested that the wear resistance of TiAlN coatings is four times more than that of TiN coatings. During high temperature film of Al2O3 is formed by Al diffusing atoms at the surface preventing further oxidation [38]. Recently many multi layered coatings have been describe to be a promising method for optimizing and enhance performance as well as coating properties [39]. By multilayer coating Tribological properties can be improved [40]. Jensen et al. [41] had shown an example of deposition of multilayered coating of TiN/AlN which in fact improved properties of single layered TiAlN. TiN monolayer deposition by Physical Vapour Deposition has lesser wear properties and mechanical compared to TiN/Ti or TiN/TiCN multilayer [42]. Monolayers exhibit greater brittleness compared to multilayer coatings [43].
According to the literature review, it is found that titanium alloys have great potential for use in engineering mechanisms, techniques for surface modification, and in addition, they demonstrate exceptional corrosion resistance despite their low density. However, the tribological characteristics of titanium alloys made from Ti grade 5 are poor due to their poor resistance to wear, diminished hardness, and elevated coefficient of friction. In order to raise the ensure the longevity of the engineering elements and provide extended service life without any unexpected failures, these attributes must be improved. In order to calculate the COF (coefficient of friction) and wear rate, it was chosen to mimic the contact phenomena between the workpiece and the tool during milling using TiN, TiAlN, and TiN+TiAlN thin film coatings.
2.1 Test method
Pin-on-disk was used with standard test procedure to measure wear and CoF. The system's wear rate will depend on factors including the load applied, opertaing speed, environment circumstances, sliding distance, and material properties need to be considered both with and without coating.
However, it’s important to note that the pin-on-disk test method is unable to reproduce all the conditions encountered during actual service. This includes factors such as lubrication, contact pressure, the geometry of contact surfaces, removal of wear debris, and existence of corrosive environments.
2.2 Coating deposition and characterization
The cylindrical pin substrates were cleaned in ultrasonic bath using acetone prior to the TiN, TiAlN, TiN+TiAlN deposition. Before PVD nitride coatings were applied to Ti6Al4V alloy rods, they were chopped into 10-millimeter diameter and 30-millimeter length sections. Before coating, surface treatments should be made in order to sustain coating. While wear test is being conducted i.e., surface roughness should be Ra should be less than 0.08 microns in coatings company (Orelikon blazers ltd). When using blasting alone, surface roughness was not up to the mark when we tested for wear with 20N load. Hence, the coatings did not sustain. In this work, the substrate undergone process such as grinding, polishing with diamond paste, and polishing with papers to attain surface roughness 0.08 microns. Hence, the coating will be sustained more effectively.
2.3 Experimental setup
Figure 1. Experimental setup
The revolving disk and pin are the two essential components of the pin on disk machine (Figure 1). To measure the wear and frictional force, a load cell and LVDT are attached pin-on-disk. In order to prevent shaking from affecting the test, a motor was utilized to rotate the disc at various speeds. The holder for the specimen is linked to a lever arm that features a pivot point. In the testing process cylindrical pin samples were utilized. In this setup, the disk material is EN-31, and the pin undergoes wear as it is pressed against the rotating disk through the application of a dead-weight load. The system is equipped with a controller, data acquisition system, and WINDUCOM 2010 software. Tribological characteristics are assessed using pin on disk apparatus to assess different gear materials while subjecting to varying loading conditions. The force of friction generated between the pin and disk is measured using a load cell.
The pin under examination is securely positioned within a pin holder and bought into contact with disc, as illustrated in Figure 2. A fixed wear track of 50 mm is established simulate the application. The rotational speed of the disk is adjusted within the range of 500 to 700 rpm, with each trail lasting 5 minutes. The load applied to the pin is varied at 15 N, 20 N and 25 N, respectively. All the specimens, each having a diameter of 10 mm and length 30 mm, undergo testing on the pin on disk machine. The results are directly displayed on a digital readout.
Figure 2. Diagram illustrating the pin-on-disk apparatus
3.1 Taguchi method
Design of experiments (DOE) is a systematic structured approach for studying conditions responsible variable changes based on one or more independent parameters. This method involves considering multiple factors in the experimentation process, and it includes the following key aspects:
DOE and the statistical analysis aspects of any experimental problem are required to consider. In this study, it’s crucial to identify the key factors that require special attention for the purpose of either controlling or optimizing the system’s performance. The Taguchi’s L9 orthogonal array is employed, futuring 3 parameters each with 3 levels. For each experiment, three quality characteristics are measured. The analysis for the experimental results to achieve the following objectives:
These objectives are crucial for understanding and enhancing the performance of the system under investigation.
As per the orthogonal array the experiment is performed, and the outcomes for some combinations were obtained. The commercial software MINITAB 17, which is primarily used in DOE applications, was used to analyse the measured results. To gauge the qualities, the experimental numbers are converted into a S/N (Signal-to-Noise) ratio. S/N ratio responses has been used to analyse the impact of control factors such as load, sliding speed, and distance on wear rate. The response tables provide the ranking of process parameters using S/R ratios obtained from wear rate. Experimental observations were further transformed into S/N ratios, which were calculated as a logarithmic transformation of loss function.
For higher desirability:
S/N(ɳ)=-10log1/n[Σ1/y2] (1)
For lower desirability:
S/N(ɳ)=-10log1/n[Σy2] (2)
where ‘n’ is the number of observations and ‘y’ is the observed data.
3.2 Process parameters levels
Table 1. Factors and their levels wear test
|
S. No. |
Input Parameters |
Levels |
||
|
1 |
Load (N) |
15 |
20 |
25 |
|
2 |
Speed(rpm) |
500 |
600 |
700 |
|
3 |
Time |
5 |
5 |
5 |
Table 2. Taguchi’s L9 orthogonal array design
|
Experiment No. |
Parameters and Their Levels |
||
|
Load |
Speed |
Time |
|
|
1 |
15 |
500 |
5 |
|
2 |
15 |
600 |
5 |
|
3 |
15 |
700 |
5 |
|
4 |
20 |
500 |
5 |
|
5 |
20 |
600 |
5 |
|
6 |
20 |
700 |
5 |
|
7 |
25 |
500 |
5 |
|
8 |
25 |
600 |
5 |
|
9 |
25 |
700 |
5 |
DOE is performed using Taguchi analysis. Table 1 shows the considered parameters and their levels. Table 2 presents Taguchi orthogonal L9 (32) arrays for experimental designs with 9 experiments.
The L9 (32) orthogonal array for wear rate, which is provided in Tables 1-2 was used as the basis for the analysis. Here, various load, sliding speed, and time characteristics are taken into account. The weight loss resulting due to pin wear is noted by estimating the difference between the weight before and after test. To obtain the lowest wear rate, the experimental design aims to identify the dominating parameters and their interactions. The tests were created using an orthogonal array with the goal of establishing a relationship between the impacts of sliding speed (rpm) and load (N) for the wear test.
4.1 Influence on wear, speed and weight
The load is a major influencing parameter on the wear rate, tailed by sliding speed and load, and it has been observed that the control parameters are statistically significant in the S/N ratio. The graphical representation of how process parameters affect wear rate and coefficient of friction is shown in Figures 3 and 4. The optimal circumstances resulting in the minimalrate of wear and friction coefficient are determined by the analysis of these testing findings using S/N ratio.
4.2 Signal–to-Noise ratio analysis
The quadratic (quality) loss function is used to express the S/N ratios in a decibel scale. The Signal-to-Noise ratios are obtained for each experiment. Table 3 shows measured values of Signal-to-Noise ratios. The term “signal‟ represents the mean value, while “noise‟ represents the undesirable variance in the output response of the process. This technique aims to identify the factors that can be controllable to minimize the impact of uncontrollable (noise) factors on the response. The factors selected based on the highest Signal-to-Noise ratio are expected to deliver optimal quality with minimal variance. Tables 4-6 provide the S/N response table for Signal-to-Noise ratios, and the response table for means. Experiments were conducted following the specified orthogonal array (OA) in Table 2, and resulting output response values and Signal- to-Noise ratios are summarised in Table 3.
Table 3. Output response and S/N ratios
|
S.No. |
TIN |
TIAIN |
TIN+ TIAIN |
||||||
|
|
S/N RATIO |
Predicted Value |
Fitted Value |
S/N RATIO |
Predicted Value |
Fitted Value |
S/N RATIO |
Predicted Value |
Fitted Value |
|
1 |
-17.26 |
24.19 |
21.5 |
-20.38 |
24.6229 |
15.5 |
-20.39 |
27.59 |
26.39 |
|
2 |
-17.21 |
27.3 |
24.66667 |
-20.47 |
26.0876 |
20.33333 |
-20.2 |
30.505 |
28.22 |
|
3 |
-17.44 |
28.68 |
27.83333 |
-20.46 |
31.5817 |
25.16667 |
-19.81 |
32.561 |
30.06 |
|
4 |
-17.54 |
29.44 |
28.5 |
-20.62 |
28.6233 |
28.5 |
-20.3 |
30.416 |
38.06 |
|
5 |
-17.57 |
32.56 |
31.66667 |
-20.43 |
30.0879 |
33.33333 |
-20.15 |
33.330 |
39.89 |
|
6 |
-17.31 |
33.94 |
34.83333 |
-20.22 |
35.5821 |
38.16667 |
-20.37 |
35.386 |
41.72 |
|
7 |
-17.2 |
26.14 |
35.5 |
-20.21 |
26.5071 |
41.5 |
-20.66 |
27.724 |
49.72 |
|
8 |
-17.4 |
29.25 |
38.66667 |
-20.21 |
27.9718 |
46.33333 |
-20.3 |
30.638 |
51.56 |
|
9 |
-17.61 |
30.63 |
41.83333 |
33.466 |
51.16667 |
-20.31 |
32.694 |
53.39 |
|
Table 4. Response to S/N ratios (difference in weight)
|
Level |
Load |
Speed |
Wear |
Friction Factor |
Difference in Weight |
|
1 |
-17.29 |
-17.41 |
-17.26 |
-17.20 |
-17.31 |
|
2 |
-17.57 |
-17.37 |
-17.21 |
-17.21 |
-17.26 |
|
3 |
-17.32 |
-17.40 |
-17.44 |
-17.26 |
-17.57 |
|
4 |
|
|
-17.54 |
-17.31 |
-17.44 |
|
5 |
|
|
-17.57 |
-17.40 |
-17.54 |
|
6 |
|
|
-17.31 |
-17.44 |
-17.31 |
|
7 |
|
|
-17.20 |
-17.54 |
-17.61 |
|
8 |
|
|
-17.40 |
-17.57 |
-17.20 |
|
9 |
|
|
-17.61 |
-17.61 |
|
|
Delta |
0.28 |
0.04 |
0.41 |
0.41 |
0.41 |
|
Rank |
4 |
5 |
2 |
2 |
2 |
Table 5. Responses for means
|
Level |
Load |
Speed |
Wear |
Friction Factor |
Difference in Weight |
|
1 |
5.181 |
5.253 |
5.163 |
5.154 |
5.190 |
|
2 |
5.362 |
5.238 |
5.132 |
5.132 |
5.163 |
|
3 |
5.212 |
5.264 |
5.274 |
5.163 |
5.352 |
|
4 |
|
|
5.344 |
5.207 |
5.274 |
|
5 |
|
|
5.352 |
5.248 |
5.344 |
|
6 |
|
|
5.207 |
5.274 |
5.207 |
|
7 |
|
|
5.154 |
5.344 |
5.391 |
|
8 |
|
|
5.248 |
5.352 |
5.154 |
|
9 |
|
|
5.391 |
5.391 |
|
|
Delta |
0.181 |
0.026 |
0.259 |
0.259 |
0.237 |
|
Rank |
4 |
5 |
1.5 |
1.5 |
3 |
Table 6. Responses for fitted value and residual value
|
S.No. |
Load |
Speed |
Time |
Wear |
Friction Factor |
Weight Before Wear |
Weight After Wear |
Difference in Weight |
SNRA1 |
MEAN1 |
FITS |
RESI |
|
1 |
15 |
500 |
5 |
29 |
0.5 |
10.262 |
10.258 |
0.004 |
21.58362 |
29 |
21.5 |
7.5 |
|
2 |
20 |
500 |
5 |
34 |
1.8 |
10.065 |
10.06 |
0.005 |
28.94316 |
34 |
24.66667 |
9.333333 |
|
3 |
25 |
500 |
5 |
56 |
5.6 |
10.264 |
10.258 |
0.006 |
29.24796 |
56 |
27.83333 |
28.16666 |
|
4 |
15 |
600 |
5 |
40 |
7.6 |
10.704 |
10.694 |
0.01 |
30.62958 |
40 |
28.5 |
11.5 |
|
5 |
20 |
600 |
5 |
46 |
6.5 |
10.549 |
10.535 |
0.014 |
34.96376 |
46 |
31.66667 |
14.33333 |
|
6 |
25 |
600 |
5 |
62 |
0.7 |
10.456 |
10.532 |
-0.076 |
23.52183 |
62 |
34.83333 |
-27.16667 |
|
7 |
15 |
700 |
5 |
49 |
2.1 |
10.257 |
10.253 |
0.004 |
27.9588 |
49 |
35.5 |
13.5 |
|
8 |
20 |
700 |
5 |
74 |
3.7 |
10.326 |
10.319 |
0.007 |
32.0412 |
74 |
38.66667 |
35.33333 |
|
9 |
25 |
700 |
5 |
88 |
7.5 |
10.688 |
10.652 |
0.036 |
33.25516 |
88 |
41.83333 |
46.16666 |
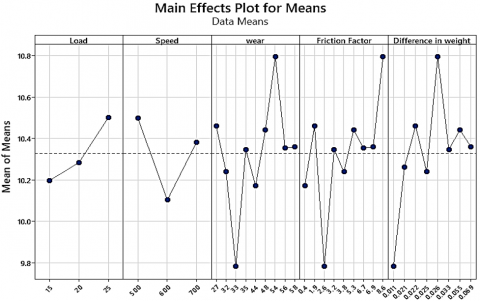
Figure 3. Main effects for means
Table 3 presents the S/N ratio, predicted value and fitted value of TIN, TIAIN and TIN+TIAIN. From Table 3, it is observed that the predicted and fitted value of TIN+TIAIN shows a closed match and fitted value of TIN+TIAIN is optimized. Figure 3 displays the S/N ratios and reaction for each factor against each of its levels under the smaller-is-better condition for wear.
The results of the analysis led to the conclusion that when the levels of the parameters grow, the mean amount of material lost to abrasion and wear increases. When the load, speed, and time increased (A, B, and C), the wear loss rises practically linearly. Factors A, B, and C have a substantial impact on wear minimization; their combination, A1, B1, and C1, results in the least amount of wear.
4.3 TIN Coating
4.3.1 Optimal combination of wear, speed and weight difference
For improving the tribological behaviour of grade5 titanium alloy coated with TiN coating the response is based on smaller is better. The optimization parameters criterion is based on the smaller is better S/N ratios from Figure 3 Optimal combinations for load 25N and speed 500rpm level 7. The ratio of frictional force to the normal load was improved based on smaller is better response. The optimization parameters criterion is based on better is small for S/N ratios from Figure 3 Optimal combinations at Load 15N and 500 rpm. Weight before wear and weight after wear was based on the smaller is better. The optimization parameters are based on smaller is better for S/N ratios from Figure 3 Optimal combinations are 20N and 700rpm.
Figure 4. Main effects plot for S/N ratios
4.3.2 Multiple linear regression models
Using the statistics programmer MINITAB 17, numerous linear regression models have been developed for two important: the rate of wear and the frictional coefficient. These modelsutilise linear equations to assest the relationship between and independent or predictor variable. By applying the model to the collected data, it becomes possible to determine the relationship among the significant factors pinpointed in the ANOVA analysis, specifically the applied load and sliding speed. This equation aids in understanding how these factors influence the wear rate and coefficient of friction.
wear=-7.84+0.194 Load+0.01981 Speed
Friction Factor=10.449+0.0043 Load-0.000073 Speed
Weight after wear=-27.80+0.007 Load+0.0524 Speed
The relationship between the rate of wear and the coefficient of friction concerning the load (L) is observed to be positive based on the regression equations. This suggest that as there is increase in load and speed, wear rate of the composite also increase. Additionally, sliding speed is negatively correlated with the equation, indicating that as speed increases, both rate of wear and friction decreases. Coefficient of friction related with speed have been found to be negatively correlated with the equation, indicating that friction is increasing with decreasing speed. Wear rate and friction are directly inversely correlated with applied load, meaning that as the load increases, so do wear rate and coefficient of friction. The wear rate and the coefficient of friction decrease with increasing sliding speed.
Table 7. Model summary (wear)
|
S |
R-sq |
R-sq (adj) |
R-sq (pred) |
|
1.71321 |
62.36% |
49.81% |
18.69% |
Table 8. Model summary (coefficient of friction)
|
S |
R-sq |
R-sq (adj) |
R-sq (pred) |
|
0.220360 |
1.04% |
0.00% |
0.00% |
Table 9. Model summary (weight after wear)
|
S |
R-sq |
R-sq (adj) |
R-sq (pred) |
|
13.01822 |
75.09% |
66.79% |
49.01% |
Tables 7-9 indicate that weight after wear is depend on load and speed. In analysis that wear is 75.09% depend on speed and load. We analyse that weight after wear is largest effect on load and speed in compression to wear, and coefficient of friction. Tables 7-9 indicate that wear and the coefficient of friction is depend on load and speed. In analysis that wear is 62.36% depend on speed and load although coefficient of friction is only 1.04% depend on load and speed.
4.3.3 Analysis of variance (ANOVA)
The load applied, speed of sliding, and wear, weight after wear parameters—which exert a notable influence on the performance measures—were examined using ANOVA to analyse the experimental data. ANOVA allows for the identification of the independent variable that predominates over the others as well as the percentage contribution of that particular independent variable. The ANOVA outcomes for wear rate and coefficient of friction involve assessing three components altered at three levels, as well as interactions of those factors, are displayed in Tables 10-11. The analysis is carried out with a 95% confidence level and a significance level of = 0.05. Sources were considered to have a significant impact on the performance metrics when their P-value was below 0.05.
Table 10. Analysis of variance (wear)
|
Source |
DF |
Adj SS |
Adj MS |
F-Value |
P-Value |
|
Regression |
2 |
29.174 |
14.587 |
4.97 |
0.053 |
|
Load |
1 |
5.632 |
5.632 |
1.92 |
0.015 |
|
Speed |
1 |
23.542 |
23.542 |
8.02 |
0.030 |
|
Error |
6 |
17.611 |
2.935 |
|
|
|
Total |
8 |
46.785 |
|
|
|
The results of the analysis of variance (ANOVA) results indicate that load and speed the most significant influence on both coefficient of friction and wear rate. Therefore, throughout the wear process, load is a crucial control component to be taken into account, followed by sliding speed. However, the impact of relationships between load and sliding speed is quite limited. For wear rate and coefficient of friction, the pooled errors included in the ANOVA table were less than 5%. So there is a significant relationship between load and speed because it’s value (P value) is less than 0.05.
Table 11. Analysis of variance (Weight after wear)
|
Source |
DF |
Adj SS |
Adj MS |
F-Value |
P-Value |
|
Regression |
2 |
164.784 |
82.392 |
9.04 |
0.015 |
|
Load |
1 |
0.007 |
0.007 |
0.00 |
0.049 |
|
Speed |
1 |
164.777 |
164.777 |
18.09 |
0.005 |
|
Error |
6 |
54.658 |
9.110 |
|
|
|
Total |
8 |
219.442 |
|
|
|
4.4 TiAlN coating
For DOE the parameters and levels are listed in Table 12.
4.4.1 Optimal combination of wear, speed and weight difference
To improve the tribological behaviour of grade 5 titanium alloy coated with TiNAlN coating the response are based on smaller is better. The optimization parameters criterion is based on the smaller is better S/N ratios in Tables 13-14. From Figures 5 and 6 optimal combinations for load 25N and speed 500rpm level 7 and also 25N 600rpm level 8. The ratio of frictional force to the normal load was improved based on smaller is better response. The optimization parameters criterion is based on better is small for S/N ratios from Figures 5 and 6 optimal combinations at load 25N ,500 rpm level 7 and 25N 700rpm level 9. Weight before wear and weight after wear was based on the smaller is better. The optimization parameters are based on smaller is better for S/N ratios from Figures 5 and 6 optimal combinations are 25N load, speed 500rpm level 7 and 25N load, speed 700rpm level 9.
The load has substantial impact on the wear rate, while sliding speed also holds a significant role. It’s worth mentioning that the control parameters demonstrated statistical significance in the Signal-to-Noise ratio analysis. The graphic representation of how process parameters affect the coefficient of friction and wear rate is shown in Figures 5 and 6. The analysis of these results using the S/N ratio enables the identification of the optimal conditions where both minimal wear rate and coefficient of friction are achieved.
Table 12. Design of experiment
|
S. No. |
Load |
Speed |
Wear |
Friction Factor |
Weigh Before Wear |
Weight After Wear |
Difference in Weight |
SNRA1 |
STDE1 |
MEAN1 |
|
1 |
15 |
500 |
30 |
5.7 |
10.455 |
10.441 |
0.014 |
-20.3807 |
0.009899 |
10.448 |
|
2 |
20 |
500 |
31 |
1.9 |
10.562 |
10.539 |
0.023 |
-20.4655 |
0.016263 |
10.5505 |
|
3 |
25 |
500 |
40 |
5.1 |
10.562 |
10.526 |
0.036 |
-20.4601 |
0.025456 |
10.544 |
|
4 |
15 |
600 |
48 |
2.5 |
10.743 |
10.727 |
0.016 |
-20.616 |
0.011314 |
10.735 |
|
5 |
20 |
600 |
64 |
4.3 |
10.448 |
10.427 |
0.021 |
-20.3719 |
0.014849 |
10.4375 |
|
6 |
25 |
600 |
95 |
6.5 |
10.265 |
10.23 |
0.035 |
-20.2124 |
0.024749 |
10.2475 |
|
7 |
15 |
700 |
75 |
4.1 |
10.257 |
10.248 |
0.009 |
-20.2166 |
0.006364 |
10.2525 |
|
8 |
20 |
700 |
64 |
7.4 |
10.575 |
10.56 |
0.015 |
-20.4794 |
0.010607 |
10.5675 |
|
9 |
25 |
700 |
76 |
7.8 |
10.264 |
10.223 |
0.041 |
-20.209 |
0.028991 |
10.2435 |
Table 13. Signal to noise ratios
|
Level |
Load |
Speed |
Wear |
Friction Factor |
Difference in Weight |
|
1 |
-20.40 |
-20.44 |
-20.38 |
-20.47 |
-20.22 |
|
2 |
-20.44 |
-20.40 |
-20.47 |
-20.62 |
-20.38 |
|
3 |
-20.29 |
-20.30 |
-20.46 |
-20.22 |
-20.48 |
|
4 |
|
|
-20.62 |
-20.37 |
-20.62 |
|
5 |
|
|
-20.43 |
-20.46 |
-20.37 |
|
6 |
|
|
-20.22 |
-20.38 |
-20.47 |
|
7 |
|
|
-20.21 |
-20.21 |
-20.21 |
|
8 |
|
|
-20.21 |
-20.48 |
-20.46 |
|
9 |
|
|
|
-20.21 |
-20.21 |
|
Delta |
0.15 |
0.13 |
0.41 |
0.41 |
0.41 |
|
Rank |
4 |
5 |
2 |
2 |
2 |
Table 14. Response table for means
|
Level |
Load |
Speed |
Wear |
Friction Factor |
Difference in Weight |
|
1 |
10.48 |
10.51 |
10.45 |
10.55 |
10.25 |
|
2 |
10.52 |
10.47 |
10.55 |
10.73 |
10.45 |
|
3 |
10.35 |
10.35 |
10.54 |
10.25 |
10.57 |
|
4 |
|
|
10.73 |
10.44 |
10.73 |
|
5 |
|
|
10.50 |
10.54 |
10.44 |
|
6 |
|
|
10.25 |
10.45 |
10.55 |
|
7 |
|
|
10.24 |
10.25 |
10.25 |
|
8 |
|
|
10.25 |
10.57 |
10.54 |
|
9 |
|
|
|
10.24 |
10.24 |
|
Delta |
0.17 |
0.16 |
0.49 |
0.49 |
0.49 |
|
Rank |
4 |
5 |
2 |
2 |
2 |
Figure 5. Main effects for means
Figure 6. Main plot for S/N ratio
4.5 Duplex TiN+TiAlN coating
4.5.1 Parameters and their levels
For the design of experiments the parameter and levels are in Table 15.
4.5.2 Optimal combination of wear, speed and weight difference
To improve the tribological behaviour of grade5 titanium alloy coated with TiN +TiAlN coating the response are based on smaller is better. The optimization parameters criterion is based on the smaller is better S/N ratios. Figures 7-8 and Tables 16-17 show the main effects pots for means and S/N ratios for optimal combinations for load 15 N and speed 700 rpm level 3. The ratio of frictional force to the normal load was improved based on smaller is better response. The optimization parameters criterion is based on better is small for S/N ratios from. Figures 7-8 for optimal combinations at Load 15N, 700 rpm level 3. Weight before wear and weight after wear was based on the smaller is better. The optimization parameters are based on smaller is better for S/N ratios from Figures 7-8 Optimal combinations are 15Nload, speed 500rpm level 1.
Table 15. Parameters and their levels
|
S. No. |
Load |
Speed |
Wear |
Friction Factor |
Weight Before Wear |
Weight After Wear |
Difference in Weight |
SNRA1 |
STDE1 |
MEAN1 |
|
1 |
15 |
500 |
27 |
1.9 |
10.471 |
10.449 |
0.022 |
-20.3906 |
0.015556 |
10.46 |
|
2 |
20 |
500 |
32 |
3.8 |
10.251 |
10.226 |
0.025 |
-20.2047 |
0.017678 |
10.2385 |
|
3 |
25 |
500 |
54 |
8.6 |
10.806 |
10.78 |
0.026 |
-20.6628 |
0.018385 |
10.793 |
|
4 |
15 |
600 |
33 |
2.6 |
9.788 |
9.777 |
0.011 |
-19.809 |
0.007778 |
9.7825 |
|
5 |
20 |
600 |
44 |
0.4 |
10.182 |
10.161 |
0.021 |
-20.1477 |
0.014849 |
10.1715 |
|
6 |
25 |
600 |
56 |
6.7 |
10.364 |
10.343 |
0.021 |
-20.3017 |
0.014849 |
10.3535 |
|
7 |
15 |
700 |
35 |
3.2 |
10.363 |
10.33 |
0.033 |
-20.2959 |
0.023335 |
10.3465 |
|
8 |
20 |
700 |
48 |
5.3 |
10.468 |
10.413 |
0.055 |
-20.3745 |
0.038891 |
10.4405 |
|
9 |
25 |
700 |
58 |
6.9 |
10.394 |
10.325 |
0.069 |
-20.3068 |
0.04879 |
10.3595 |
Figure 7. Main effects pots for means
Figure 8. Graphical representation of main effects using S/N ratios
Table 16. Responses for signal to noise ratios
|
Level |
Load |
Speed |
Wear |
Friction Factor |
Difference in Weight |
|
1 |
-20.17 |
-20.42 |
-20.39 |
-20.15 |
-19.81 |
|
2 |
-20.24 |
-20.09 |
-20.20 |
-20.39 |
-20.22 |
|
3 |
-20.42 |
-20.33 |
-19.81 |
-19.81 |
-20.39 |
|
4 |
|
|
-20.30 |
-20.30 |
-20.20 |
|
5 |
|
|
-20.15 |
-20.20 |
-20.66 |
|
6 |
|
|
-20.37 |
-20.37 |
-20.30 |
|
7 |
|
|
-20.66 |
-20.30 |
-20.37 |
|
8 |
|
|
-20.30 |
-20.31 |
-20.31 |
|
9 |
|
|
-20.31 |
-20.66 |
|
|
Delta |
0.26 |
0.33 |
0.85 |
0.85 |
0.85 |
|
Rank |
5 |
4 |
2 |
2 |
2 |
Table 17. Responses for means
|
Level |
Load |
Speed |
Wear |
Friction Factor |
Difference in Weight |
|
1 |
10.196 |
10.497 |
10.460 |
10.171 |
9.782 |
|
2 |
10.284 |
10.103 |
10.239 |
10.460 |
10.262 |
|
3 |
10.502 |
10.382 |
9.782 |
9.782 |
10.460 |
|
4 |
|
|
10.346 |
10.346 |
10.239 |
|
5 |
|
|
10.171 |
10.239 |
10.793 |
|
6 |
|
|
10.441 |
10.441 |
10.346 |
|
7 |
|
|
10.793 |
10.354 |
10.441 |
|
8 |
|
|
10.354 |
10.360 |
10.360 |
|
9 |
|
|
10.360 |
10.793 |
|
|
Delta |
0.306 |
0.395 |
1.011 |
1.011 |
1.011 |
In order to calculate the coefficient of friction (COF) and wear rate were evaluated across different speed and loading conditions, the primary objective of the studyaimed to explore and examine the contact phenomena between the work piece and tool utilized during machining. the goal was attained with the aid of thorough experimental and statistical analysis. Following observations are obtained from experimental and statistical analyses.
[1] Munsch, M. (2017). Laser additive manufacturing of customized prosthetics and implants for biomedical applications. In Laser additive Manufacturing, pp. 399-420. https://doi.org/10.1016/B978-0-08-100433-3.00015-4
[2] Soboyejo, W.O., Nemetski, B., Allameh, S., Marcantonio, N., Mercer, C., Ricci, J. (2002). Interactions between MC3T3-E1 cells and textured Ti6Al4V surfaces. Journal of Biomedical Materials Research, 62(1): 56-72. https://doi.org/10.1002/jbm.10221
[3] Collings, E.W. (1984). The physical metallurgy of titanium alloys. Metals Park Ohio, 3. American Society for Metals.
[4] John, J., Nagarajan, N.M. (2015). Age hardening treatment of Ti-6Al-4V alloy dome for aerospace application. International Journal of Innovative Science, Engineering & Technology, 2(8): 342-346.
[5] Lin, Z.J., Wang, L.Q., Wai, K., Yeung, K., Qin, J. (2013). The ultrafine-grained titanium and biomedical titanium alloys processed by severe plastic deformation (SPD). SOJ Materials Science & Engineering, 1(1): 1-5. https://doi.org/10.15226/SOJMSE.2013.00101
[6] Liew, W.Y.H., Lim, H.P., Melvin, G.J.H., Dayou, J., Jiang, Z.T. (2022). Thermal stability, mechanical properties, and tribological performance of TiAlXN coatings: Understanding the effects of alloying additions. Journal of Materials Research and Technology, 17: 961-1012. https://doi.org/10.1016/j.jmrt.2022.01.005
[7] Variola, F., Yi, J.H., Richert, L., Wuest, J.D., Rosei, F., Nanci, A. (2008). Tailoring the surface properties of Ti6Al4V by controlled chemical oxidation. Biomaterials, 29(10): 1285-1298. https://doi.org/10.1016/j.biomaterials. 2007.11.040
[8] Cavaleiro, A., De Hosson, J.T. (Eds.). (2007). Nanostructured coatings. Springer Science & Business Media. https://doi.org/10.1007/978-0-387-48756-4
[9] Yildiz, F., Yetim, A.F., Alsaran, A., Efeoglu, I. (2009). Wear and corrosion behaviour of various surface treated medical grade titanium alloy in bio-simulated environment. Wear, 267(5-8): 695-701. https://doi.org/10.1016/j.wear.2009.01.056
[10] Chien, C.S., Liu, C.W., Kuo, T.Y. (2016). Effects of laser power level on microstructural properties and phase composition of laser-clad fluorapatite/zirconia composite coatings on Ti6Al4V substrates. Materials, 9(5): 380. https://doi.org/10.3390/ma9050380
[11] Tang, J., Liu, D., Zhang, X., Du, D., Yu, S. (2016). Effects of plasma ZrN metallurgy and shot peening duplex treatment on fretting wear and fretting fatigue behavior of Ti6Al4V alloy. Materials, 9(4): 217. https://doi.org/10.3390/ma9040217
[12] Cai, Z.B., Zhang, G.A., Zhu, Y.K., Shen, M.X., Wang, L.P., Zhu, M.H. (2013). Torsional fretting wear of a biomedical Ti6Al7Nb alloy for nitrogen ion implantation in bovine serum. Tribology International, 59: 312-320. https://doi.org/10.1016/j.triboint.2012.06.009
[13] Hajare, A.S., Gogte, C.L. (2018). Comparative study of wear behaviour of Thermal Spray HVOF coating on 304 SS. Materials Today: Proceedings, 5(2): 6924-6933. https://doi.org/10.1016/j.matpr.2017.11.354
[14] Costa, M.Y.P., Venditti, M.L.R., Cioffi, M.O.H., Voorwald, H.J.C., Guimarães, V.A., Ruas, R. (2011). Fatigue behavior of PVD coated Ti–6Al–4V alloy. International Journal of Fatigue, 33(6): 759-765. https://doi.org/10.1016/j.ijfatigue.2010.11.007
[15] de Souza, T.M., Leite, N.F., Trava-Airoldi, V.J., Corat, E.J. (1997). Studies on CVD-diamond on Ti6Al4V alloy surface using hot filament assisted technique. Thin Solid Films, 308: 254-257. https://doi.org/10.1016/S0040-6090(97)00378-7
[16] Kustas, F.M., Misra, M.S. (2007) Friction and wear of titanium alloys. In ASM Handbooksonline, 17.
[17] Yang, X., Richard Liu, C. (1999). Machining titanium and its alloys. Machining Science and Technology, 3(1): 107-139. https://doi.org/10.1080/10940349908945686
[18] Martini, C., Ceschini, L. (2011). A comparative study of the tribological behaviour of PVD coatings on the Ti-6Al-4V alloy. Tribology International, 44(3): 297-308. https://doi.org/10.1016/j.triboint.2010.10.031
[19] Chen, L., Wang, S.Q., Zhou, S.Z., Li, J., Zhang, Y.Z. (2008). Microstructure and mechanical properties of Ti (C, N) and TiN/Ti (C, N) multilayer PVD coatings. International Journal of Refractory Metals and Hard Materials, 26(5): 456-460. https://doi.org/10.1016/j.ijrmhm.2007.10.003
[20] Martini, C., Ceschini, L. (2011). A comparative study of the tribological behaviour of PVD coatings on the Ti-6Al-4V alloy. Tribology International, 44(3): 297-308. https://doi.org /10.1016/j.triboint. 2010.10 .031
[21] Proudhon, H., Savkova, J., Basseville, S., Guipont, V., Jeandin, M., Cailletaud, G. (2014). Experimental and numerical wear studies of porous Reactive Plasma Sprayed Ti–6Al–4V/TiN composite coating. Wear, 311(1-2): 159-166. https://doi.org/10.1016/j.wear.2014.01.012
[22] Mellor, B.G. (2006). Surface coatings for protection against wear. Woodhead Publishing. Taylor & Francis; London, UK: https://doi.org/10.1504/IJMMP.2008.022048
[23] Santecchia, E., Hamouda, A.M.S., Musharavati, F., Zalnezhad, E., Cabibbo, M., Spigarelli, S. (2015). Wear resistance investigation of titanium nitride-based coatings. Ceramics International, 41(9): 10349-10379. https://doi.org/10.1016/j.ceramint.2015.04.152
[24] Dion, I., Rouais, F., Trut, L., Baquey, C., Monties, J.R., Havlik, P. (1993). TiN coating: Surface characterization and haemocompatibility. Biomaterials, 14(3): 169-176. https://doi.org/10. 1016 /0142-9612(93)90019-X
[25] Yoneyama, T., Doi, H., Kobayashi, E., Nakano, T., Hamanaka, H. (1997). Deformation property of titanium and dental alloys in an indentation test. Dentistry in Japan, 33: 92-96. https://doi.org/10.3390/lubricants7080065
[26] Wang, L., Su, J.F., Nie, X. (2010). Corrosion and tribological properties and impact fatigue behaviors of TiN-and DLC-coated stainless steels in a simulated body fluid environment. Surface and Coatings Technology, 205(5): 1599-1605. https://doi.org/10.1016/j.surfcoat.2010.07.111
[27] Navinšek, B., Panjan, P., Milošev, I. (1999). PVD coatings as an environmentally clean alternative to electroplating and electroless processes. Surface and Coatings Technology, 116-119: 476-487. https://doi.org/10.1016/S0257-8972(99)00145-0
[28] Fernández-Abia, A.I., Barreiro, J., Fernández-Larrinoa, J., de Lacalle, L.L., Fernández-Valdivielso, A., Pereira, O.M. (2013). Behaviour of PVD coatings in the turning of austenitic stainless steels. Procedia Engineering, 63: 133-141. https://doi.org/10.1016/j.proeng.2013.08.241
[29] Endrino, J.L., Fox-Rabinovich, G.S., Gey, C. (2006). Hard AlTiN, AlCrN PVD coatings for machining of austenitic stainless steel. Surface and Coatings Technology, 200(24): 6840-6845. https://doi.org/10.1016/j.surfcoat.2005.10.030
[30] Ensinger, W., Lensch, O., Kraus, T., Sundermann, C., Enders, B. (2002). Coating the inner walls of metal tubes with carbon films by physical vapor deposition at low temperature. Surface and Coatings Technology, 150(2-3): 227-231. https://doi.org/10.1016/S0257-8972(01)01513-4
[31] Hoche, H., Schmidt, J., Groß, S., Troßmann, T., Berger, C. (2011). PVD coating and substrate pretreatment concepts for corrosion and wear protection of magnesium alloys. Surface and Coatings Technology, 205(S2): S145-S150. https://doi.org/10.1016/j.surfcoat.2010.12.040
[32] Bayón, R., Igartua, A., Fernández, X., Martínez, R., Rodríguez, R.J., García, J.A., De Damborenea, J. (2009). Corrosion-wear behaviour of PVD Cr/CrN multilayer coatings for gear applications. Tribology International, 42(4): 591-599. https://doi.org/10.1016/j.triboint.2008.06.015
[33] Oskouei, R.H., Ibrahim, R.N. (2011). The effect of a heat treatment on improving the fatigue properties of aluminium alloy 7075-T6 coated with TiN by PVD. Procedia Engineering, 10: 1936-1942. https://doi.org/10.1016/j.proeng.2011.04.321
[34] Gali, O.A., Shafiei, M., Hunter, J.A., Riahi, A.R. (2014). The tribological behavior of PVD coated work roll surfaces during rolling of aluminum. Surface and Coatings Technology, 260: 230-238. https://doi.org/10.1016 /j.surfcoat.2014.06.071
[35] Costa, M.Y.P., Cioffi, M.O.H., Venditti, M.L.R., Voorwald, H.J.C. (2010). Fatigue fracture behavior of Ti-6Al-4V PVD coated. Procedia Engineering, 2(1): 1859-1864. https://doi.org/10.1016/j.proeng.2010.03.200
[36] Ichimura, H., Kawana, A. (1993). High-temperature oxidation of ion-plated TiN and TiAlN films. Journal of Materials Research, 8(5): 1093-1100. https://doi.org/10.1557/JMR.1993.1093
[37] Li, Y., Liu, Z., Yang, J., Chen, Y. (2013). Microstructure and properties of (Ti, Al) N coatings on WC-Co cemented carbide. In Journal of Physics: Conference Series, 419(1): 012028. https://doi.org/10.1088/1742-6596/419/1/012028
[38] Tanaka, Y., Gür, T.M., Kelly, M., Hagstrom, S.B., Ikeda, T., Wakihira, K., Satoh, H. (1992). Properties of (Ti1−xAlx) N coatings for cutting tools prepared by the cathodic arc ion plating method. Journal of Vacuum Science & Technology A: Vacuum, Surfaces, and Films, 10(4): 1749-1756. https://doi.org/10.1080/10426910902840995
[39] Smallman, R.E., Ngan, A.H.W. (2014). Oxidation, corrosion and surface engineering, Modern Physical Metallurgy, 617-657. https://doi.org/10.1016/B978-0-08-098204-5.00016-X
[40] Sui, X., Li, G., Jiang, C., Wang, K., Zhang, Y., Hao, J., Wang, Q. (2018). Improved toughness of layered architecture TiAlN/CrN coatings for titanium high speed cutting. Ceramics International, 44(5): 5629-5635. https://doi.org/10.1016/j.ceramint.2017.12.210
[41] Jensen, H., Sobota, J., Sorensen, G. (1997). Multilayer film deposition of TiN/AlN on a rotating substrate holder from reactive sputtering of elemental targets of titanium and aluminum. Journal of Vacuum Science & Technology A: Vacuum, Surfaces, and Films, 15(3): 941-945. https://doi.org/10.1116/1.580783
[42] Jindal, P.C., Santhanam, A.T., Schleinkofer, U., Shuster, A.F. (1999). Performance of PVD TiN, TiCN, and TiAlN coated cemented carbide tools in turning. International Journal of Refractory Metals and Hard Materials, 17(1-3): 163-170. https://doi.org/10.1016/S0263-4368(99)00008-6
[43] Nordin, M., Larsson, M., Hogmark, S. (1998). Mechanical and tribological properties of multilayered PVD TiN/CrN, TiN/MoN, TiN/NbN and TiN/TaN coatings on cemented carbide. Surface And Coatings Technology, 106(2-3): 234-241. https://doi.org/10.1016/S0257-8972(98)00544-1