Hind B. Ali* | Jawad K. Oleiwi | Farhad M. Othman
© 2022 IIETA. This article is published by IIETA and is licensed under the CC BY 4.0 license (http://creativecommons.org/licenses/by/4.0/).
OPEN ACCESS
Additive Manufacturing (AM) technologies have been emerged as a fabrication method to obtain engineering components within a short span of time. 3D printing, also referred as additive layer manufacturing technology is one of the powerful methods of rapid prototyping (RP) technique that fabricates three-dimensional engineering components. fused deposition modelling (FDM) is one of the most commonly used additive manufacturing (AM) methods, with applications in modelling, prototyping, and production. Acrylonitrile–butadiene–styrene (ABS) is a widely used industrial thermoplastic that is also the most commonly used material in FDM technology. Understanding the impact of FDM build settings on material characteristics is essential for predicting the behaviour of ABS components. The purpose of this study is to determine the impact of specimen tensile and compressive behaviour on ABS components produced using FDM. The Ultimaker+2 printer is used to create ABS thermoplastic samples for the investigation. The samples are put through their tests using a modified form of ASTM D638 for tensile strength and ASTM D695 for compressive strength. An Instron testing machine is used to put the printed parts to the test. The approach employed was Design of Experiment (DOE). Three primary criteria are used in the plastics experiment: infill density, layer thickness, and infill pattern. We measured the tensile and compressive strengths of zigzag and gyroid specimens, as well as cross specimens. The highest compressive strength at break (25.01 MPa), Young's modulus (2.473 GPa), fracture strength (21.016 MPa), and ultimate tensile stress (23.1 MPa) were all discovered in a sample with 60% infill density, 0.05mm layer thickness, and a GYROID infill pattern.
additive manufacturing, fused deposition modeling, compressive, ABS, infill pattern, layer thickness
New technologies are transforming our world. The term "complexity is free" is frequently used when it comes to additive manufacturing (AM), which will allow nearly any geometric form to be created. When balancing fabrication technique and cost, traditional production processes put many constraints on the geometry of a part. When doing design for manufacturing (DFM) using AM as the desired production technique, this weight of free complexity can be quite expensive. 3-dimensional (3D) printing is becoming increasingly popular in the industrial production industry [1].
When discussing additive manufacturing (AM), which allows almost anything to be fabricated when balancing fabrication technique and cost, the traditional manufacturing process puts many constraints on the geometry of a component. When doing design for manufacture (DFM), if the planned manufacturing technique is AM, this weight of free complexity may be highly costly. This is becoming increasingly essential in the product development industry for industrial production. Complex prototype goods with sophisticated functions and parameters such as temperature, printer speed, infill pattern, and so on can be created using 3D printing [2].
ABS is used in a wide range of industries because of its special characteristics, which include strong mechanical reaction, chemical resistance, excellent surface finish, and processing quality [1]. ABS is a robust and durable resin that is chemically resistant, although it is vulnerable to polar solvents. It has better compressive characteristics than HIPS and a slightly higher thermal distortion temperature. Acrylonitrile butadiene styrene has a large processing window and may be handled on a wide range of machines. Extrusion, injection molding, and blow moulding are all possibilities. It has a low melting point, making it ideal for additive manufacturing processes on a fused deposition modelling machine [3].
The most popular of all additive manufacturing (AM) processes is Fused Deposition Modeling (FDM), often known as Fused Filament Fabrication (FFF). This is owing to its low cost, simplicity of usage, and wide range of commercially accessible materials. FFF frequently uses polymers such as acrylonitrile butadiene styrene (ABS), polycarbonate (PC), polylactic acid (PLA), and polyether ether ketone (PEEK) [4].
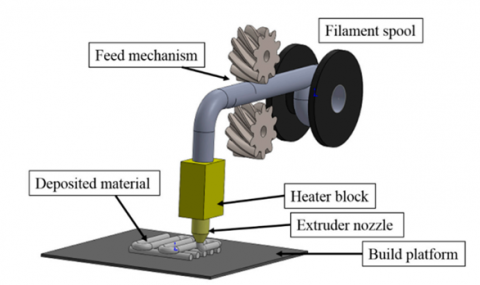
A heating block, an extruder (nozzle), and a platform make up fused deposition machines. The heater and the nozzle are set on a moveable frame that moves freely in relation to the building base or the other way around. After being placed in the heater block, the filament feedstock is partially melted. Through the nozzle, the material is extruded. Figure 1. shows how to do this operation. The G-code provides instructions that are processed. G-codes are lines of instructions that contain the coordinates that the nozzle should follow. The distance between the nozzle and the platform is increased once a layer of material has been extruded in order to extrude another layer of material [5].
The FDM method used by Stratasys being with the creation of three-dimensional geometrical in a CAD software program, which can be converted to an STL coded file. In this format, the component's exterior design is represented with triangles using tessellation. After that, the geometrical is put into the FDM machine software program, where it is oriented in place and geometrically split into horizontal layers of the machine's necessary thickness. Depending on the position of the component and its shape, a support structure is built [4].
The purpose of this research is to investigate the unique effects of printing settings on mechanical characteristics. The impact of various processing factors on the mechanical properties of a 3D printed ABS component was investigated using an experimental approach utilizing a fractional orthogonal array design to optimize the printing process [6, 7].
Many printing settings used to create components using FDM have been investigated and reported. Some authors looked at the experimental to see how three process factors, such as layer height, raster angle, and raster width, affected the tensile characteristics of PLA specimens printed using them (FDM) [8]. To carry out the process, Taguchi was employed. To determine the optimum combination of process parameters, the value of experimental error was analysed using analysis of variance (ANOVA) and signal-to-noise (S/N) ratio analysis. Hu et al. [9] investigated the quality of production in the optimization of settings using Fused Deposition Modelling (FDM) for 3D printers of the polymer acrylonitrile-butadiene-styrene (ABS). ABS was tested at different temperatures for 3D printing while printing at the same speed. As a sample, an evaluation sample was picked (dog bone). The materials were described using differential scanning calorimetry (DSC), a 3D scanner, the melt flow index (MFI), bending and tensile tests, and notched toughness measurements. The ideal melting point was determined based on the sample's mechanical characteristics and printing quality. The findings revealed that for this material, selecting the proper 3D-printed temperatures and base temperature is critical. Temperatures around 245℃ are recommended for prototypes that should have more flexibility. On the other hand, for samples that do not require flexibility, temperatures of around 275℃ are recommended. As proven by DSC, there is no material deterioration due to the ABS material's brief contact time with the nozzle.
The influence of FDM settings on flexural strength was investigated by Peko et al. [10] who utilizing a Makerot Replicator 2 printer to fabricate PLA samples. In this work, the influence of infill pattern, layer thickness, and infill density on the compression and tensile characteristics of 3D printed Acrylonitrile Butadiene Styrene (ABS) is investigated. The process parameters that were investigated were build orientation, layer thickness, and infill density. The significance of the influence of variables on flexural strength was investigated using a factorial Design of Experiment approach and Analysis of Variance (ANOVA). According to the findings of experiments and statical analysis (ANOVA), Flexural strength was affected by layer thickness and the connection between build construction direction and infill density.
Rodríguez et al. [11] investigated the properties of ABS M30 produced using FDM (Vantage SE machine). In order to identify the best process parameter combination, Taguchi's DOE technique was combined with Grey Relational Analysis (GRA) multi-objective optimization. To enhance the dimensional accuracy and surface finishing of the components, the best combination of settings was determined utilizing GRA with raster angle at 0°, part orientation, layer thickness of 0.254mm, zero air gaps, and raster width at 0.4564mm.
Liu et al. [12] investigated the impact of the five factors: raster gap, deposition orientation, layer thickness, deposition style, and raster width on the mechanical characteristics (tensile strength, impact strength, and flexural strength) of PLA parts produced by FDM. To perform experimental research, the Taguchi system was utilized, and analysis of variance (ANOVA) was used to determine the significance and influence of each parameter on component quality. Finally, using grey relational analysis, a set of optimal process parameter combinations were created to maximise the comprehensive mechanical characteristics of FDM components. Aalaie and Rahmatpour [2] investigated the effects of part build angular position, layer thickness, raster to raster gap, raster angle, and raster thickness on the accuracy of dimension of FDM constructed components at three levels, as well as the interaction of part build orientation angle with all other factors. Lužanin et al. [13] investigated that, when compared to ABS monofilament, the mechanical behaviour of ABS was examined by analysing the elastic moduli and strength of FDM, which indicated a decline in modulus of 11-37 percent and a strength loss of 22-57 percent. The mechanical characteristics of the construction pieces were considerably impacted by the build orientation.
The purpose of this work is to investigate the mechanical characteristics of printed ABS components after printing, utilizing tensile and compressive tests.
Figure 1. Schematic diagram of the FDM process [14]
Ultimaker 2+ prints using Acrylonitrile Butadiene Styrene (ABS), a polymer commonly used in Fused Deposition Modelling. ABS is a robust and durable resin that is chemically resistant, although it is vulnerable to polar solvents. It has better compressive characteristics than HIPS and a slightly higher thermal distortion temperature [15].
Therefore, ABS was chosen as a construction material; thus, the standard mechanical characteristics of ABS are shown in Table 1.
Table 1. Mechanical Characteristics of ABS [15-17]
|
Elongation at Break |
10-50% |
|
Elongation at Yield |
1.7-6% |
|
Flexibility (Flexural Modulus) |
1.6-2.4 GPa |
|
Hardness Shore D |
100 |
|
Strength at Break (Tensile) |
22.1-74 MPa |
|
Strength at Yield (Tensile) |
13-65 MPa |
|
Toughness (Notched-Izod Impact at Room Temperature) |
8-48 KJ/m2 |
|
Toughness at Low Temperature (Notched-Izod Impact at Low Temperature) |
7-22 KJ/m2 |
|
Young's Modulus |
1.79-3.2 GPa |
3.1 Process parameters
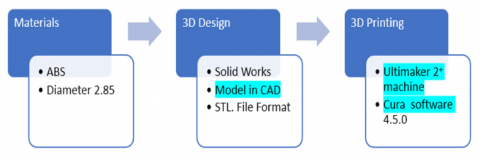
It is necessary to know that process parameters and their levels have been used because they are sufficient to study and evaluate process performance. They are infill density, infill pattern, and layer thickness. The Unigraphics NX software was used to create the specimens. The UG NX programme was used to design specimens according to the standard specifications for each mechanical property test, and then the designs had to be saved in Standard Triangle Language (STL) file form. The utility of the STL form is that the CAD packages support it. Then sliced using Cura software, the STL file is exported and opened in the Cura software slicing programs. The goal of the slicing programme is to split the specimen into the desired number of layers. The slicing programme can specify the process parameters [18]. The programme communicates the code to the printer and controls the extruder nozzle temperature (Figure 2).
Figure 2. 3D model and specimen creation methodology for 3D printing
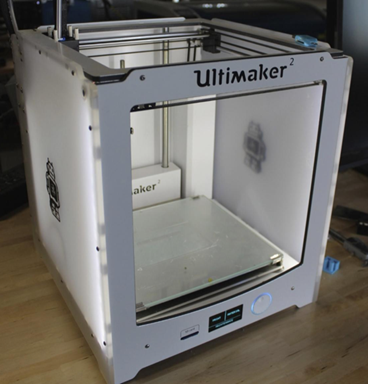
According to the material used, the settings of object position, settings of filament, settings of print, and settings of slicer have been controlled by the computer connected. Filament settings contain the length of extrusion for the printing, while printer settings provide full control of the settings of the bed temperature and filament extrusion. After checking the settings of all filaments, the settings slice tab, the printer axis, and extrusion, the printing will finally start. Ultimaker2+ is a Fused Deposition Modelling machine for manufacturing specimens as shown in Figure 3. It can support a wide range of materials, including ABS material, which was employed in this research [17, 19].
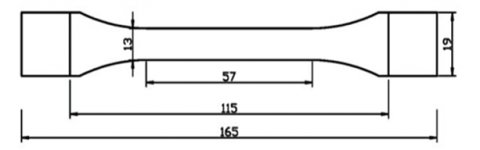
Technical properties such as ultimate tensile and compressive strengths were measured using specimens that were evaluated for compressive and tensile characteristics to the technical properties [20]. Figure 4 shows a 3D CAD geometric model created as a tensile test specimen using ASTM D638-02a specifications (Type I specimen, thickness 7mm) using the tensile machine. ASTM D695 specifies the strength at break of a compressive property using the same machine as that of a tensile property with a crosshead speed of 5mm/min and the full-range load at 25KN [21]. Figure 5 shows the compressive strength sample.
Figure 3. Ultimaker 2+ FDM Machine
Figure 4. Type I tensile strength test specimen according to ASTM D638-02a [19]
Figure 5. A specimen of compressive strength (all dimensions are in mm) [18]
3.2 Design of experiments
The selection of control variables and their levels is a most crucial step in the design of an experiment. The most researched process parameters include Layer thickness, infill density, and infill pattern, as shown in Table 2, which have substantial effects on filament (inter-layer and intra-layer) bonding, and thus influence the mechanical performance of FDM printed components. In addition, these parameters play a significant role from the perspective of mechanical properties. The allowed minimum and maximum values suggested by the equipment manufacturer, as well as experience and real-world industrial applications, are used to determine the levels of factors [22]. Table 2 lists the operational conditions under which testing is counted.
Table 2. The most important factors and their levels
|
Fixed Factors |
Control Factors |
||||||
|
Factors |
Value |
Unit |
Factors |
Levels |
Unit |
||
|
1 |
2 |
3 |
|||||
|
Print speed |
60 |
mm/s |
Layer thickness |
0.05 |
0.15 |
0.25 |
mm |
|
Shell thickness |
0.2 |
mm |
Infill density |
20 |
40 |
60 |
% |
|
part Orientation |
45 |
degree |
Infill pattern |
ZIGZAG |
CROSS |
GYROID |
- |
|
diameter of Nozzle |
0.4 |
mm |
|
|
|
|
|
|
temperature of Printing |
200 |
̊C |
|
|
|
|
|
|
temperature of Build plate |
60 |
̊C |
|
|
|
|
|
The choice of an orthogonal array in the Taguchi design is critical for getting reliable findings. This research takes into account three elements, each at three levels, as well as the interplay of orientation with the other components. L9 is the suitable orthogonal array in this situation. This array has 9 rows for the trial or experiment conditions and columns for assigning variables or interactions. The variables and interactions are assigned as shown in Table 3 to avoid erroneous analysis, wrong conclusions, and to reduce the confounding impact of factors and interactions.
Table 3. L9 orthogonal array
|
Sample no. |
Layer thickness mm |
Infill density % |
Infill pattern |
|
1 |
0.05 |
20 |
ZIGZAG |
|
2 |
0.05 |
40 |
CROSS |
|
3 |
0.05 |
60 |
GYROID |
|
4 |
0.15 |
20 |
CROSS |
|
5 |
0.15 |
40 |
GYROID |
|
6 |
0.15 |
60 |
ZIGZAG |
|
7 |
0.25 |
20 |
GYROID |
|
8 |
0.25 |
40 |
ZIGZAG |
|
9 |
0.25 |
60 |
CROSS |
In this investigation, ABS specimens were examined to see how different manufacturing factors affected their mechanical characteristics. Table 4 shows the results of a tensile and compressive test based on Taguchi L9 OA that was done with 9 specimens (with three repeats). According to the compressive test results, sample no. 3 had the highest compressive strength at break (25.01 MPa) when printed at 60% infill density, GYROID infill pattern, and 0.05 mm layer thickness. In addition, sample no. 3 had a value of (23.1Mpa) for ultimate tensile stress when printed at 60% infill density, GYROID infill pattern, and 0.05mm layer thickness. Figures 6 and 7 show 3D images of specimens following tensile and compressive tests.
Figure 6. After the tensile test, 3D printed tensile test specimens (as per Table 3)
Figure 7. After compression testing, 3D printed specimens for compressive testing (as per Table 3)
Table 4. Design of experiment and tensile and compressive test results (Mpa)
|
Sample no. |
Layer thickness (mm) |
Infill density (%) |
Infill pattern |
Ultimate tensile stress (Mpa) |
Young's modulus (GPa) |
Fracture strength (Mpa) |
compression strength at break (Mpa) |
|
1 |
0.05 |
20 |
ZIGZAG |
16.4 |
2.153 |
11.178 |
16.3 |
|
2 |
0.05 |
40 |
CROSS |
17.5 |
2.130 |
20.875 |
17.9 |
|
3 |
0.05 |
60 |
GYROID |
23.1 |
2.473 |
21.016 |
25.01 |
|
4 |
0.15 |
20 |
CROSS |
14.4 |
2.175 |
12.794 |
15.5 |
|
5 |
0.15 |
40 |
GYROID |
13.4 |
2.184 |
20.895 |
20.4 |
|
6 |
0.15 |
60 |
ZIGZAG |
12.8 |
2.236 |
12.525 |
23.5 |
|
7 |
0.25 |
20 |
GYROID |
10.3 |
2.276 |
10.101 |
19.6 |
|
8 |
0.25 |
40 |
ZIGZAG |
11.8 |
2.274 |
12.794 |
14.9 |
|
9 |
0.25 |
60 |
CROSS |
12.5 |
2.148 |
11.178 |
22.6 |
As indicated in Table 5, the signal-to-noise (SN) ratio was determined to optimize the input parameters. For the large is better type scenario, the SN ratio was computed as follows:
$(S / N)_{H B}=-10 \log \left[\frac{1}{n} \sum_{i=1}^{n} \frac{1}{y_{i}^{2}}\right]$ (1)
where:
$y_{i}$= Value of the characteristics in an observation i
n= Number of repetitions in a trial
Data analysis is done using Minitab R17 software. Taguchi results are presented for tensile and compression strength in Tables 6, 7, 8, and 9, respectively.
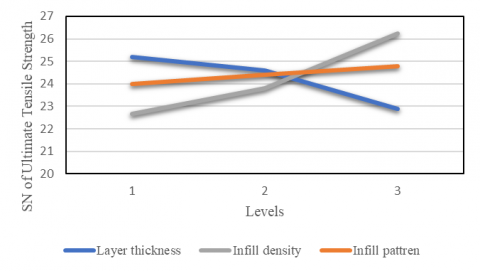
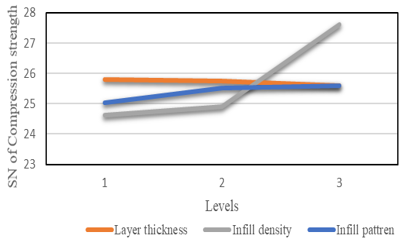
The plots showing the major influence of the SN ratio on the tensile and compressive characteristics of the 09 set of samples are shown in Tables 6, 7, 8, and 9 and Figures 8 to 11. Layer thickness of 0.05 mm, infill density of 60%, and infill pattern GYROID are the optimum sets of the input parameters for ultimate tensile and compression strength as shown in Figures 8 to 11.
As opposed to samples with greater layer thickness, samples with smaller layer thicknesses are stacked closer together, resulting in a better connection between layers. As a result, the mechanical characteristics of samples with a thinner layer are better. As shown in Figures 8 to 11, decreasing the layer thickness leads to an increase in the mechanical properties.
The rank (1) for infill density, as shown in Tables 6, 7, 8, and 9, is an essential process parameter that has a considerable impact on mechanical characteristics. The best mechanical properties are achieved when the specimens' infill density is high, around 60%, as illustrated in Figures 8 to 11.
Figure 8. Ultimate Tensile strength Main effects plots
Figure 9. Young's Modulus Main effects graphs
Table 5. S/N ratios for tensile and compressive characteristics (MPa)
|
Sample no. |
Layer thickness (mm) |
Infill density (%) |
Infill pattern |
S/N ratio of ultimate tensile stress |
S/N ratio of Young's modulus |
S/N ratio of fracture strength |
SN ratio of compression strength |
|
1 |
0.05 |
20 |
ZIGZAG |
21.138 |
6.661 |
20.809 |
24.244 |
|
2 |
0.05 |
40 |
CROSS |
22.607 |
6.568 |
20.648 |
25.057 |
|
3 |
0.05 |
60 |
GYROID |
24.910 |
7.143 |
24.851 |
27.458 |
|
4 |
0.15 |
20 |
CROSS |
23.167 |
6.749 |
22.321 |
23.807 |
|
5 |
0.15 |
40 |
GYROID |
24.297 |
6.785 |
24.097 |
26.193 |
|
6 |
0.15 |
60 |
ZIGZAG |
26.361 |
6.989 |
27.667 |
27.421 |
|
7 |
0.25 |
20 |
GYROID |
23.694 |
7.864 |
22.463 |
25.845 |
|
8 |
0.25 |
40 |
ZIGZAG |
24.506 |
7.136 |
25.693 |
23.464 |
|
9 |
0.25 |
60 |
CROSS |
27.421 |
6.641 |
23.647 |
27.959 |
Table 6. SN ratios of Ultimate Tensile strength in order of importance
|
Level |
Layer thickness |
Infill density |
Infill pattern |
|
1 |
25.21 |
22.67 |
24 |
|
2 |
24.61 |
23.8 |
24.4 |
|
3 |
22.89 |
26.23 |
24.8 |
|
delta |
2.32 |
3.56 |
0.4 |
|
rank |
2 |
1 |
3 |
Table 7. S/N ratios for Young's Modulus in order of importance
|
Level |
Layer thickness |
Infill density |
Infill pattern |
|
1 |
7.214 |
6.929 |
6.829 |
|
2 |
6.841 |
6.652 |
6.925 |
|
3 |
6.791 |
7.264 |
7.092 |
|
delta |
0.423 |
0.612 |
0.262 |
|
rank |
2 |
1 |
3 |
Table 8. S/N ratios for Fracture strength in order of importance
|
Level |
Layer thickness |
Infill density |
Infill pattern |
|
1 |
22.10 |
21.86 |
24.72 |
|
2 |
24.69 |
23.48 |
22.21 |
|
3 |
23.93 |
25.39 |
23.80 |
|
delta |
2.59 |
3.52 |
2.52 |
|
rank |
2 |
1 |
3 |
Table 9. S/N ratios for compression strength in order of importance
|
Level |
Layer thickness |
Infill density |
Infill pattern |
|
1 |
25.81 |
24.63 |
25.04 |
|
2 |
25.76 |
24.9 |
25.51 |
|
3 |
25.59 |
27.61 |
25.6 |
|
delta |
0.22 |
2.98 |
0.09 |
|
rank |
2 |
1 |
3 |
Figure 10. Main effects plots for fracture strength
Figure 11. Main effects plots for compression strength
When evaluating the mechanical characteristics of all samples, the findings show that the effect is strong when the infill pattern is a GYROID. The filament path is therefore seen as rigid and stronger because the order of bonding intersects with the other in opposite directions, giving a more dense and rigid structure than the cross and zigzag pattern. The intersecting direction will give higher mechanical properties compared to the other pattern, thus the optimum values at GYROID for each mechanical property, as shown in Figures 8 to 11.
One of the benefits of FDM three-dimensional printing is that varied infill densities may be used to create different products. As a result of this benefit, time and material consumption, as well as final product cost, can be reduced. It may be deduced from the tensile test finding that infill type and density have an influence on compressive and tensile characteristics. The tensile and compressive characteristics of the material increase as the density rises from 20% to 60%. According to the finding, the infill has a maximum strength of 60%. The "GYROID" infill pattern has the highest compression and ultimate tensile strength.
Infill density, thickness of the layer, and infill pattern are the three most significant factors in determining tensile and compression strength. As the thickness of the layer lowers, a large number of layers are needed, the distorting impact would be decreased, and the strength would improve as a result.
For mechanical characteristics, the optimum layer thickness was 0.05 mm, whereas the layer thickness of 0.25 mm for samples was not noteworthy in any of the samples evaluated. Young's modulus (2.473 GPa), maximum compressive strength at break (25.01 MPa), fracture strength (21.016 Mpa), and ultimate tensile stress (23.1 MPa) were measured for the functional prototype based on the 3D printed ABS matrix with layer thickness (0.05 mm), infill density (60 percent), and GYROID infill pattern. As a result, we found that experiment number three is the best choice for a 3D-printed structure for applications needing higher resistance.
[1] Turner, B.N., Strong, R., Gold, S.A. (2014). A review of melt extrusion additive manufacturing processes: I. Process design and modeling. Rapid Prototyping Journal, 20(3): 192-204. https://doi.org/10.1108/RPJ-01-2013-0012
[2] Aalaie, J., Rahmatpour, A. (2007). Study on preparation and properties of acrylonitrile‐butadiene‐styrene/montmorillonite nanocomposites. Journal of Macromolecular Science, Part B: Physics, 46(6): 1255-1265. https://doi.org/10.1080/00222340701629372
[3] Attoye, S.O. (2018). A study of fused deposition modeling (FDM) 3-D printing using mechanical testing and thermography. Doctoral Dissertation. http://dx.doi.org/10.7912/C2/2731
[4] Cuan-Urquizo, E., Barocio, E., Tejada-Ortigoza, V., Pipes, R.B., Rodriguez, C.A., Roman-Flores, A. (2019). Characterization of the mechanical properties of FFF structures and materials: A review on the experimental, computational and theoretical approaches. Materials, 12(6): 895. https://doi.org/10.3390/ma12060895
[5] Othman, F.M., Fadhil, T., Ali, A.H.B. (2018). Influence of process parameters on mechanical properties and printing time of FDM PLA printed parts using design of experiment. J. Eng. Res, 2248-9622. https://doi.org/10.9790/9622-080702656965
[6] Abbas, T.F., Othman, F.M., Ali, H.B. (2018). Influence of layer thickness on impact property of 3D-printed PLA. Int. Res. J. Eng. Technol. (Irjet), 5: 1-4.
[7] Dvorak, K., Zarybnicka, L., Dvorakova, J. (2019). Quality parameters of 3D print products by the DMLS method. Manuf. Technol, 19(2): 209-215.
[8] Gonçalves, C., Gonçalves, I.C., Magalhães, F.D., Pinto, A.M. (2017). Poly (lactic acid) composites containing carbon-based nanomaterials: A review. Polymers, 9(7): 269. https://doi.org/10.3390/polym9070269
[9] Hu, K.H., Kao, C.S., Duh, Y.S. (2008). Studies on the runaway reaction of ABS polymerization process. Journal of Hazardous Materials, 159(1): 25-34. https://doi.org/10.1016/j.jhazmat.2007.09.124
[10] Peko, I., Krolo, J., Bagavac, P., Đurić, S., Kostić, N., Bašić, A. (2017). Modeling and optimization of tensile strength of ABS parts manufactured by the fused deposition modeling process. In International Conference on Mechanical Technologies and Structural Materials, pp. 103-110.
[11] Rodríguez, J.F., Thomas, J.P., Renaud, J.E. (2001). Mechanical behavior of acrylonitrile butadiene styrene (ABS) fused deposition materials. Experimental investigation. Rapid Prototyping Journal, 7(3): 148-158. https://doi.org/10.1108/13552540110395547
[12] Liu, X., Zhang, M., Li, S., Si, L., Peng, J., Hu, Y. (2017). Mechanical property parametric appraisal of fused deposition modeling parts based on the gray Taguchi method. The International Journal of Advanced Manufacturing Technology, 89(5): 2387-2397. https://doi.org/10.1007/s00170-016-9263-3
[13] Lužanin, O., Movrin, D., Plančak, M. (2014). Effect of layer thickness, deposition angle, and infill on maximum flexural force in FDM-built specimens. Journal for Technology of Plasticity, 39(1): 49-58.
[14] Rajpurohit, S.R., Dave, H.K. (2018). Effect of process parameters on tensile strength of FDM printed PLA part. Rapid Prototyping Journal, 24(8): 1317-1324. https://doi.org/10.1108/RPJ-06-2017-0134
[15] Nancharaiah, T.R.D.R.V., Raju, D.R., Raju, V.R. (2010). An experimental investigation on surface quality and dimensional accuracy of FDM components. International Journal on Emerging Technologies, 1(2): 106-111.
[16] Somireddy, M., Singh, C.V., Czekanski, A. (2020). Mechanical behaviour of 3D printed composite parts with short carbon fiber reinforcements. Engineering Failure Analysis, 107: 104232. https://doi.org/10.1016/j.engfailanal.2019.104232
[17] Sood, A.K., Ohdar, R.K., Mahapatra, S.S. (2012). Experimental investigation and empirical modelling of FDM process for compressive strength improvement. Journal of Advanced Research, 3(1): 81-90. https://doi.org/10.1016/j.jare.2011.05.001
[18] Abbas, T., Othman, F.M., Ali, H.B. (2017). Effect of infill Parameter on compression property in FDM process. Dimensions, 12(7): 25-4.
[19] Torrado, A.R., Shemelya, C.M., English, J.D., Lin, Y., Wicker, R.B., Roberson, D.A. (2015). Characterizing the effect of additives to ABS on the mechanical property anisotropy of specimens fabricated by material extrusion 3D printing. Additive Manufacturing, 6: 16-29. https://doi.org/10.1016/j.addma.2015.02.001
[20] Venkatasubbareddy, O.Y., Siddikali, P., Saleem, S.M. (2016). Improving the dimensional accuracy and surface roughness of FDM parts using optimization techniques. IOSR Journal of Mechanical and Civil Engineering, 16(053): 18-22.
[21] Torrado, A.R., Roberson, D.A. (2016). Failure analysis and anisotropy evaluation of 3D-printed tensile test specimens of different geometries and print raster patterns. Journal of Failure Analysis and Prevention, 16(1): 154-164. https://doi.org/10.1007/s11668-016-0067-4
[22] Roberson, D.A., Perez, A.R.T., Shemelya, C.M., Rivera, A., MacDonald, E., Wicker, R.B. (2015). Comparison of stress concentrator fabrication for 3D printed polymeric izod impact test specimens. Additive Manufacturing, 7: 1-11. https://doi.org/10.1016/j.addma.2015.05.002