Jean Claude Tchamba | Théodore Gautier L.J. Bikoko* | Felix Ndubisi Okonta
© 2022 IIETA. This article is published by IIETA and is licensed under the CC BY 4.0 license (http://creativecommons.org/licenses/by/4.0/).
OPEN ACCESS
We present in this work the results of an experimental study obtained on fresh cement pastes (PC) PC30, PC36 and PC40 with water- to- cement ratio (W/C) of 0.30, 0.36 and 0.40, respectively and on fresh limestone filler pastes (Fc) with water-to-limestone filler ratio (W/Fc) = 0.30 and 0.348 for the measurement of the hydraulic conductivity using the constant head permeameter. Discontinuous measurement of hydraulic conductivity was used. An analysis of this parameter allows some information to be obtained on the rheological behavior of the material in the first hours of its manufacture. It appears that at the same volume concentration and for a comparable particle size, the hydraulic conductivity of limestone filler pastes is greater than that of cement pastes.
fresh cement pastes, fresh limestone filler pastes, hydraulic conductivity, rheology, water-to-cement ratio (W/C), water-to-limestone filler ratio (W/Fc)
Cement paste is defined as a mixture of cement and water, while limestone filler paste is defined as a mixture of limestone filler and water. The water used in the mixing of cementitious materials is called mixing water. In the presence of anhydrous cement, it triggers a certain number of complex chemical reactions, which evolve at different kinetics depending on the formulation of the different constituent phases of Portland cement. These mechanisms are called hydration reactions.
During these reactions, some of mixing water or bound water is gradually consumed by Portland cement, and is responsible for the transformation of the silicate crystals into calcium silicate hydrate (C-S-H) for the setting of the cement. The other part, free which does not participate in the hydration reactions is likely to move inside the paste, it can evaporate during penetrant testing.
Cementitious materials develop from water-cement contact volume variations when they are isolated from any exchange with the external environment even in the absence of any loading. The driving mechanism of this variation finds its origin in the hydration of the cement [1].
The hydraulic conductivity or permeability changes during the hydration of cementitious materials. The data of permeability measurement are prerequisites for constructions of the Buildings and Public Works. Previous studies have reported that the permeability (k) of fresh cement-based materials help to understand the hydro-mechanical properties and their evolution with time [2-4]. The hydraulic conductivity measurement can be used also to quantify the liquid filtration rate under a given pressure gradient [2], to predict the amount of bleed water using consolidation theory [2, 5-9], to give drainage criteria for various concrete casting and pre-casting procedure [2, 10, 11].
In this context, a test campaign was carried out to assess the hydraulic conductivity of fresh cement-based materials from placement in a mold until the start of hardening. Through this investigation, the aim is to study the setting kinetics of fresh cement-based materials from the point of view of the simultaneous evolution on the one hand, of its internal porosity, and on the other hand, of its retention capacity.
Four parameters of influence are retained:
In the literature of fresh cementitious materials, very few studies [2, 12-16] have already been carried out on the measurement of hydraulic conductivity or permeability and hence more researches are needed.
The objective of this article was to measure the hydraulic conductivity or permeability of fresh cement pastes and fresh limestone filler pastes. This article is divided into the following 5 parts: Part 1 serves as an introduction, part 2 presents the review of the literature, part 3 presents the materials and methods used in the experiment, part 4 analyzes the results from experimentation and finally, the conclusions of the article are given in part 5.
In this part, previous studies related to the measurements of hydraulic conductivity or permeability of cementitious materials are reviewed as well as the parameters which determine them.
Permeability testing involves forcing a fluid, usually water or gas, to flow under a given pressure through the material. The hydraulic conductivity is an intrinsic parameter of the material and does not depend on the fluid used. The most popular method is the use of water as a fluid. However, the circulation of water can modify the degree of saturation of the material and therefore its hydraulic conductivity.
In a cement paste, the flow of water through the capillary pores follows Darcy's law [17]. Darcy's law determines the flow rate of the fluid passing through a porous medium over time, the parameter K defines the evolution of this flow.
Andriamantsilavo [18] measured the hydraulic conductivity of cement pastes with water-to-cement ratios (W/C) of 0.30, 0.36 and 0.45. Based on the results obtained, he concluded that the greater the water-to-cement ratio (W/C), the more intense the initial water flow and the greater the total amount of water drained.
Gardner [19] has developed a testing method to measure the water permeability of unsaturated soils. This involves monitoring over time the amount of water leaving a sample subjected to positive air pressure. Several factors influence the hydraulic conductivity of the materials, among them are the temperature, the type of cement, the water- to- cement ratio (W/C) [20], the mixing time.
Uzomoka [21] and Moffat and Uzomoka [22] reported the settlement of fresh concrete using the principles of soil mechanics. From the permeability, shear, triaxial and consolidation tests, they found that mixtures with a cement matrix after remoulding have a behavior similar to the behavior of clays which undergo low compressibility.
The consolidation tests carried out by Jefferis [23] on cement grouts with water- to- cement ratio (W/C) = 0.4 to 0.6 under their own load show that cement grouts can be treated in the same way as a soil whose chemical reaction is inert. Similarly, Powers [24] suggested that settlement correlates with the amount of water drained through the cement paste until the flow is zero.
Florin and Ivanov [25] described the compaction of saturated sand in the sense of a compaction that moves upward through the soil at a constant rate determined by the permeability of the sand and the final porosity.
McRoberts and Nixon [26] argued that the settlement transition in the behavior of suspended soils as a particle decreases as a function of the dimension of the grain sizes.
Bolton and Mckinley [27] conducted the experiments on fresh cement pastes using the oedometer with upward drainage.
Tchamba and Bikoko [2] carried out experiments on fresh cement pastes using the permeameter at water/cement ratio (W/C) = 0.3 to 0.4.
Li and Xu [28] developed a numerical test method based on 3D FEM to predict the permeability of cement paste.
The work of Bikoko and Tchamba [13] stated that the volume of water collected during the filtration tests is systematically greater when the water- to- cement ratio (W/C) of the pastes increases.
Perrot and Rangeard [29] reported the effects of mix design parameters on consolidation behaviour of fresh cement-based materials.
Tchamba and Bikoko [14] developed a model during the continuous filtration test due to the formation of the cake that had formed on the lower part of the cell.
3.1 Materials
Portland cement (CEM I 52.5 N CE CP2 NF) of strength class 52.5 MPa at 28 days was used in this study. Its chemical compositions was given by Lafarge group (Producer). Tables 1 and 2 give respectively the chemical composition and the proportion of the main four phases (C3S, C2S, C3A and C4AF). The proportion of the four main phases of this cement was obtained by applying the formulas of Bogue. Its physical and mechanical characteristics are given in Table 3. CEM I 52.5 N CE CP2 NF is composed of 95% clinker, 2% limestone and 3% filler.
Table 1. Chemical composition of CEM I 52.5 N CE CP2 NF used
|
Component |
(%) Mass Percentage |
|
SiO2 |
20.70 |
|
Al2O3 |
4.70 |
|
Fe2O3 |
3.00 |
|
CaO |
64.70 |
|
MgO |
0.90 |
|
K20 |
0.98 |
|
Na2O |
0.16 |
|
SO3 |
3.30 |
|
Sulfur from sulphides |
0.01 |
|
Cl |
0.02 |
|
Fire loss |
0.85 |
|
P2O5 |
0.35 |
|
No dosed |
0.34 |
|
Insoluble |
0.22 |
|
CO2 |
0.40 |
|
Free lime Cao |
1.30 |
|
Equivalent alkalis |
0.80 |
Table 2. Proportion of the main four phases (C3S, C2S, C3A and C4AF) and others of CEM I 52.5 N CE CP2 NF used
|
Constituents |
(%) Mass Percentage |
|
C3S |
52.71 |
|
C2S |
17.86 |
|
C3A |
8.20 |
|
C4AF |
8.35 |
|
Gypsum |
7.74 |
|
Carbonates |
1.36 |
Table 3. Physical and mechanical characteristics of cement used (La Farge 2006)
|
|
CEM I 52.5 N CE CP2 NF |
|
Compressive strength at 1 days (MPa) |
23.8 |
|
Compressive strength at 2 days (MPa) |
33.8 |
|
Compressive strength at 7 days (MPa) |
44.3 |
|
Compressive strength at 28 days (MPa) |
60.2 |
|
Initial setting time (min) |
120 |
|
Density (g/cm3) |
3.16 |
|
Blaine specific surface (cm2/g) |
3520 |
The limestone filler used is marketed under the name BETONCARB P2. It is a light gray, crushed filler. It was supplied by the MEAC group. Its characteristics provided by the MEAC group (Producer) indicate that it is mainly composed of carbonate (98.5%). Its density is 2714 kg/m3 and its Blaine specific surface is 3970 cm2/g. The chemical characteristics are given in Table 4.
Table 4. Chemical characteristics of limestone filler used (%)
|
|
BETONCARB P2 |
|
Water content |
0.2 |
|
Total carbonate content |
98.5 |
|
Calcium carbonate content |
97.7 |
|
Value in Blue |
2 |
|
Equivalent alkali content Na2O |
0.002 |
|
Organic matter content |
0.020 |
|
Chloride content |
0.003 |
|
Sulphate content |
0.003 |
|
Total sulfur content |
0.002 |
(a)
(b)
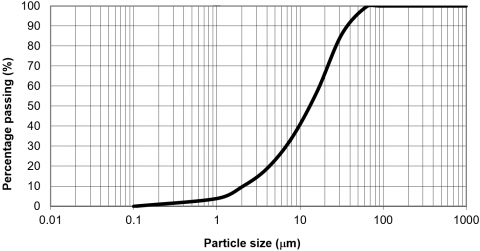
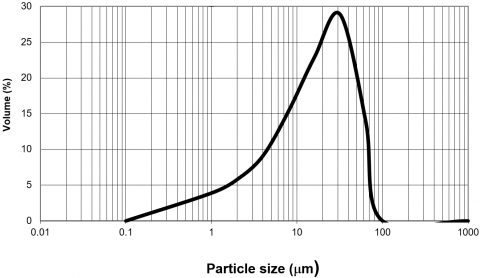
Figure 1. (a) Mass distribution of cement grain size-CEM I 52.5 N CE CP2 NF; (b) Volume distribution of the size of cement grains-CEM I 52.5 N CE CP2 NF
(a)
(b)
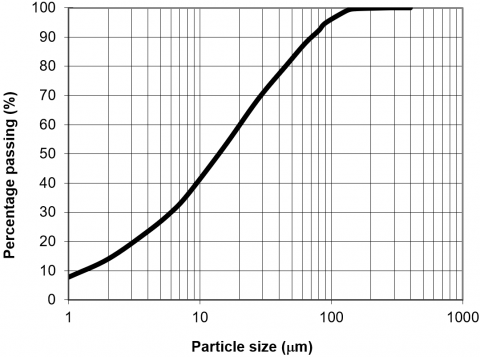
Figure 2. (a) Mass distribution of limestone filler grain size-BETONCARB P2; (b). Volume distribution of the size of limestone filler grains-BETONCARB P2
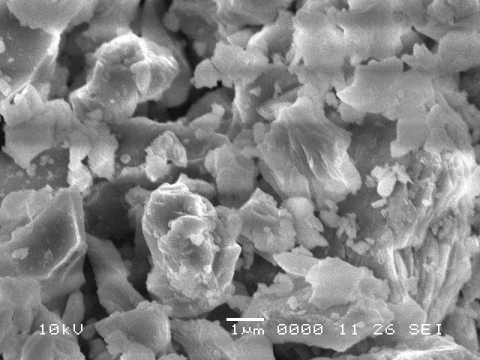
Figure 3. SEM micrograph of CEM I 52.5 N CE CP2 NF [2, 14]
The particle size analyses of cement and limestone filler were carried out by Lafarge group and MEAC group, respectively. Figure 1(a) and Figure 2(a) show on one hand the mass distribution and on the other hand, Figure 1(b) and Figure 2(b) show the volume distribution of grains of the same diameter.
Figure 3 shows the SEM micrograph of CEM I 52.5 N CE CP2 NF used obtained using the scanning electron microscope of the University of South Brittany (UBS), Lorient, France.
3.2 Methods
3.2.1 Preparation of the sample
The preparation of the cement paste sample was as follow: water was introduced in 50 s into the cement and mixed for 4 minutes at 140 rpm. After a rest period of 60 s, the cement paste was remixed for 2 additional minutes at 285 rpm. Three mixtures namely, PC30, PC36 and PC40 corresponding to water- to- cement ratio (W/C) of 0.30, 0.36 and 0.40, respectively were prepared. The mixing water being kept at a constant temperature of 20°C for all the tests.
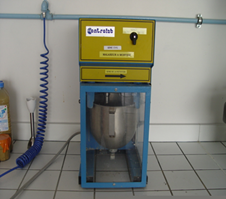
The mixtures of the two constituents i.e. cement and water were introduced into the mixer tank according to standard NF EN 196-1 [30] to obtain a homogeneous mixture. This mixer is shown in Figure 4. It comprises a stainless steel tank with a capacity of 5 liters for the reception of the constituents and a rotatable pale press in light alloy for mixing which can run at slow speed of 140 rpm and high of 285 rpm [2, 13].
The mixing protocol is summarized in Table 5. The limestone filler pastes were obtained by the same mixing protocol as the cement pastes. Unlike cement pastes, prepared mixtures are non-hardening threshold fluids.
Table 5. Mixing operation in the mixer
|
Operations |
Introduction of cement |
Water introduction |
|
Bowl adjustment |
|
|
Duration of operations |
|
50s |
4 min |
60s |
2 min |
|
State of the pale |
Stop |
Slow speed |
Stop |
High speed |
|
Figure 4. Standard mixer for cement paste provided with the vessel [2, 13, 14]
3.2.2 Composition of cement pastes
Three compositions of cement pastes (Table 6) were made. The mixing of cement and water was carried out in a single batch of 5 liters. The mixtures thus obtained are fluids with a hardening thixotropic threshold.
Table 6. Composition of cement pastes
|
Mixture |
W (l/m3) |
C (Kg/m3) |
W/C |
ρ (Kg/m3) |
ϕ0 |
|
PC 30 |
487 |
1622 |
0.30 |
2109 |
0.52 |
|
PC 36 |
532 |
1478 |
0.36 |
2010 |
0.47 |
|
PC 40 |
558 |
1396 |
0.40 |
1954 |
0.45 |
where, ϕ0 is the solid concentration in the mixture, given by the expression:
$\varphi_{0}=\frac{\text { Volume solide }}{\text { Volume total }}$
3.2.3 Experimental protocol
This test consisted of applying a constant water pressure to the saturated sample which will create a flow of water which will flow from the permeameter into a container.
Prior to testing, the filtration systems i.e., filter paper and grid were saturated. The fresh cement paste samples were then introduced into the permeameter cell in 4 layers of equal depth, tamping each layer 25 times with the tamping rod [2, 13]. The tamping rod was that used for the slump test to Abram’s cone (NF P 18-451) [2, 13, 31].
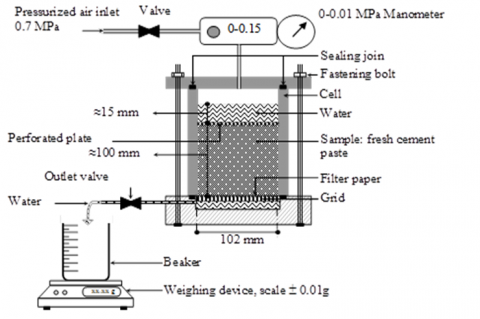
Over the sample, 160g of water was poured in order to keep the sample fully saturated throughout the duration of the test (See Figure 5). Figures 5 and 6 show respectively the schematic view of the permeameter used and the experimental setup.
Water was also added in the base of the cell, up to the level of the metal plate so that the water expelled from the sample is measurable from the start of the test. This plate and the stainless steel filter, surmounted by a second filter paper, serve to distribute the pressures well on the lower base and prevent the entrainment of the finest particles of the material by leaching.
Figure 5. Schematic representation of the constant head permeameter [2, 13-16]
(a)
(b)
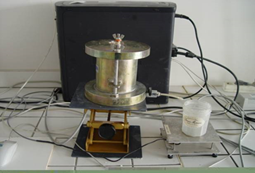
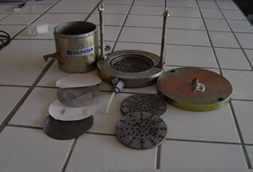
Figure 6. (a) Photo of the experimental setup [13, 14]; (b) Details of permeameter cell [13, 14]
The cell is sealed by the upper cover. Air pressure, regulated by a manometer, is then applied from above and the outgoing water flow is collected in a container placed on a balance connected to an acquisition device.
The experimental protocol and the characteristics of the permeameter used can be found in more detailed in Tchamba and Bikoko [2] and Bikoko and Tchamba [13].
(1) Parameter measured
The quantity of water leaving the cell as a function of time is the parameter measured. This measurement is provided by a balance of accuracy of 0.01 g (Figure 5) connected to a measurement acquisition system.
The goal is to measure the hydraulic conductivity (K) of the sample.
If we consider the sample as a non-deformable porous medium and the infiltration fluid as inert with respect to the porous medium passed through, Darcy's law can be considered.
The general formulation of this law is given by:
$\frac{\mathrm{Q}}{\mathrm{S}}=\mathrm{K} \frac{\Delta \mathrm{h}}{\mathrm{L}}$ (1)
where:
-Q represent the flow rate in m3/s;
-K is the hydraulic conductivity in m/s;
-S is the cross-sectional area perpendicular to flow direction in m2
-Δh is the hydraulic pressure difference measured in m;
-L is the length of flow path in m.
The tests were carried out at an ambient temperature of 20 ± 2°C and 60% relative humidity. The hydraulic conductivities measured subsequently are therefore relative to this temperature.
The materials studied are: PC30, PC36 and PC40 cement pastes then, by way of comparison, water-limestone filler mixture ratio (W/Fc) = 0.3 and 0.348 was used.
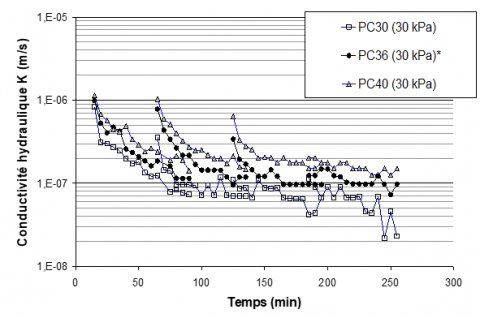
4.1 Effect of the W/C ratio
Figure 7 shows that for three (3) batch test procedures, the overall hydraulic conductivity of the sample tends to increase with the water- to- cement ratio (W/C), regardless of the hydration time of the paste. However, a more marked difference is observed for longer hydration times as well as for measurements made at the end of the procedure.
Note: The X axis in this figure represent the hydration time in minute and the Y axis represent the hydraulic conductivity in m/s
Figure 7. Evolution of the hydraulic conductivities deduced from each percolation step for 3 consecutive tests and reported as a function of the hydration time for the cement pastes of W/C = 0.3, W/C = 0.36 and W/C = 0.4
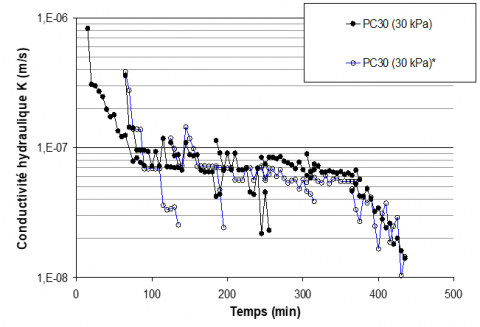
4.2 Measurements between 0-100min and 250-430min
Figure 8 shows the evolution of the hydraulic conductivities as a function of the hydration time for a cement paste of W/C = 0.3. It can be seen from the figure that the rapid decrease of hydraulic conductivity occurred in 0-100 min and 250-430 min. At 6 hours i.e. 360min and beyond 6 hours, the hydraulic conductivity drops significantly certainly due to the setting of the cement subsequently resulting in a greater dispersion of the measurements.
The percolated flows decrease in such a way that it becomes difficult to be able to accurately determine the related hydraulic conductivities.
Note: the symbol '*' in the figure indicates that the pressure is applied for a hydration time of 15 minutes and is kept constant (30 kPa) until the end of the test. The X axis in this figure represent the hydration time in minute and the Y axis represent the hydraulic conductivity in m/s
Figure 8. Evolution of the hydraulic conductivities deduced from each percolation step for 2 consecutive tests and reported as a function of the hydration time for a cement paste of W/C = 0.3
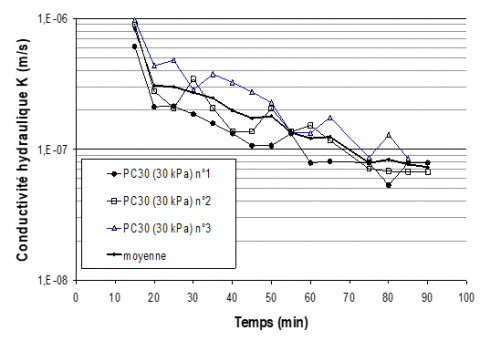
4.3 Repeatability of measurements
Overall, the dispersion of the measurements is greater for cement pastes with a low water- to- cement ratio (W/C) and for the first measurements. This is probably due to the placement of the sample in the cell. Over time, the sample has time to stabilize better in the cell, and the occluded air eventually has time to be released. Also, when the W/C ratio decreases, the paste flow less well, and probably contains more occluded air.
Figure 9 shows the state of the repeatability of the hydraulic conductivities deduced from the measurements on cement paste with water- to- cement ratio (W/C) = 0.3 during the first measurements procedure of the hydration times of 15 minutes to 1h30, the one on which the dispersion of measurements seems to be the most critical. This can be of the order of ± 50% around the mean, which for hydraulic conductivity measurements is acceptable without being negligible.
Most of the measurements were taken at least twice (Figure 9). In cases where several measurements have been taken, only the average of the results obtained at a given hydration time is considered.
4.4 Comparison of cement with limestone filler
Limestone filler is an inert material that does not exhibit hydration reactions with water unlike cement. The purpose of these tests is to discriminate the role of cement hydration on the measurements made, by comparing cement pastes and limestone filler pastes.
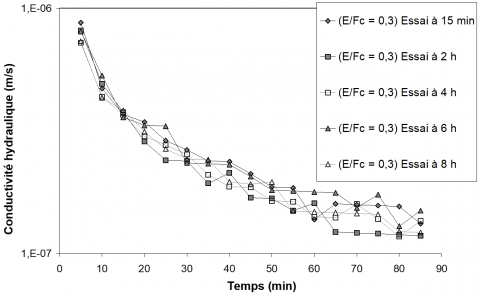
The permeability tests were carried out with the limestone filler paste with the parameter W/FC having the same mass value as W/C = 0.30 under identical conditions, with a delay corresponding to 15 minutes; 2h; 4h; 6h; and 8h successively.
Figure 10 shows that the curves are generally identical. This allows us to conclude that the time has no influence on the water + limestone filler mixture unlike cement (water + cement mixture). As the water is free, there is no change in the state of the water in the measurement time considered.
Note: The X axis in this figure represent the hydration time in minute and the Y axis represent the hydraulic conductivity in m/s
Figure 9. Evolution of hydraulic conductivities deduced from several samples of cement paste of W/C = 0.30 at different hydration times
Note: The X axis in this figure represent the hydration time in minute and the Y axis represent the hydraulic conductivity in m/s
Figure 10. Evolution of the hydraulic conductivities deduced from each percolation step of a discontinuous test as a function of the "hydration" time of limestone filler paste samples with a W/Fc ratio = 0.3
In order to compare the hydraulic conductivities between cement pastes and limestone filler pastes, it is necessary to ensure that they have the same solid volume fraction [32-35]. Furthermore, it must be considered that the particle size is identical. In our case, the particle size of the limestone filler is slightly greater than that of the cement. The hydraulic conductivities deduced from these tests should therefore be comparable, or even slightly higher, than that of the cement paste of water-to cement ratio (W/C) = 0.3.
By taking the following values respectively for the density of the cement and the limestone filler ρc = 3150 kg/m3 and ρfc = 2714 kg/m3 and for W/C = 0.3, the value of the volume concentration was taken equal to:
$\varphi=\frac{\mathrm{V}_{\mathrm{c}}}{\mathrm{V}_{\mathrm{c}}+\mathrm{V}_{\text {eau }}}=\frac{\frac{1000}{3150}}{\frac{1000}{3150}+0,3}$
Therefore, $\varphi=0.514$.
This leads to obtaining the mass of water necessary for the mixture.
By taking 1kg of limestone filler, the volume of water is:
$\mathrm{V}_{\mathrm{eau}}=\frac{\mathrm{V}_{\mathrm{fc}}}{\varphi}-\mathrm{V}_{\mathrm{f} c}$
Therefore, Vwater = 0.348 liters or 348 g.
Note: The X axis in this figure represent the hydration time in minute and the Y axis represent the hydraulic conductivity in m/s
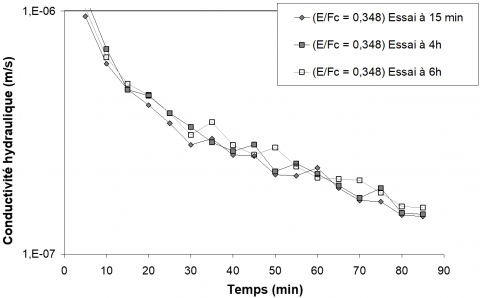
Figure 11. Evolution of the hydraulic conductivities deduced from each percolation step of a discontinuous test as a function of the "hydration" time of limestone filler paste samples with a W/Fc ratio 0.348
The mass ratio to be carried out to be at the same volume concentration is therefore: W/FC = 0.348. The tests were carried out with this mass ratio for delays corresponding to 15 minutes, 4h and 6h. From Figure 11 no variation over time has been recorded.
From Figures 10 and 11, we deduce that the repeatability of the measurements is satisfactory. Subsequently, we consider that these different tests are identical and we deduce an average value which will be compared with that obtained on the cement pastes of water-to-cement ratio (W/C) = 0.3.
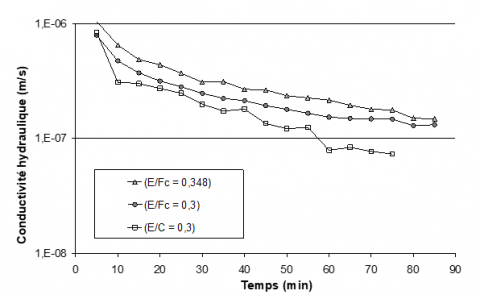
Figure 12 summarizes the hydraulic conductivities deduced from the tests carried out on two limestone filler pastes with water-to-limestone filler ratio (W/Fc) = 0.30 and 0.348 and cement paste with water- to- cement ratio (W/C) of 0.30. These tests confirm the role of the volume concentration on the hydraulic conductivity of limestone filler paste (it decreases when W/FC decreases). A difference is however observed between the limestone filler paste of W/FC = 0.348 and the cement paste of W/C = 0.3. This may be due to the following reasons:
• A coarser grain size of the limestone filler. Indeed, it is slightly higher than that of cement. At equal volume concentration, the hydraulic conductivities of limestone filler pastes may be slightly higher than those of cement pastes.
• The onset of hydration phenomena: unlike limestone filler, cement paste is the site of physicochemical transformations corresponding to the initial phase of hydration mechanisms also called the induction period. This inevitably leads to a change in the porosity of the material, fixation of water, dissolutions and coalescence of solid phases leading to a decrease in hydraulic conductivity.
Note: The X axis in this figure represent the hydration time in minute and the Y axis represent the hydraulic conductivity in m/s
Figure 12. Evolution during a test of the average hydraulic conductivities deduced from each percolation step of the discontinuous tests of samples of limestone filler paste with W/Fc ratio = 0.348 and 0.3 and cement paste of W/C = 0.3
The following conclusions were obtained based on the studies conducted on this article:
The comparison with the limestone filler confirms the effect of hydration on the hydraulic conductivity of cement pastes from the first hours. Furthermore, it seems that the volume concentrations of the limestone filler pastes have a greater influence on their permeability. At identical volume concentration and for a comparable particle size, the hydraulic conductivity of limestone filler pastes is greater than that of cement pastes. This is due to the change induced by the hydration of the cement in the very first hours.
It is also interesting to note that the comparison with an inert material of the limestone filler type confirms the effect of hydration from the first hours of hydration since at equal volume concentration; the difference in permeability is significant.
[1] Mounanga, P. (2003). Étude expérimentale du comportement de pâtes de ciment au très jeune âge: hydratation, retraits, propriétés thermophysiques (Doctoral dissertation, Nantes).
[2] Tchamba, J.C., Bikoko, T.G.L.J. (2016). Study of transfer properties on fresh cement pastes; laboratory experiments: discontinue measurements using a permeameter. Journal of Materials Science Research, 5(2): 29-38. http://dx.doi.org/10.5539/jmsr.v5n2p29
[3] Picandet, V., Rangeard, D., Perrot, A., Lecompte, T. (2011). Permeability measurement of fresh cement paste. Cement and Concrete Research, 41(3): 330-338. http://dx.doi.org/10.1016/j.cemconres.2010.11.019
[4] Assaad, J.J., Harb, J. (2013). Use of the falling-head method to assess permeability of freshly mixed cementitious-based materials. Journal of Materials in Civil Engineering, 25(5): 1-11. http://dx.doi.org/10.1061/(ASCE)MT.19435533.0000630
[5] Rangeard, D., Perrot, A., Picandet, V., Mélinge, Y., Estellé, P. (2015). Determination of the consolidation coefficient of low compressibility materials. Materials and Structures, 48(5): 1475-1483. http://dx.doi.org/10.1617/s11527-014-0247-1
[6] Assaad, J.J., Harb, J. (2011). Surface settlement of cementitious-based materials determined by oedometer testing. Materials and Structures, 44: 845-856. http://dx.doi.org/10.1617/s11527-010-9671-z
[7] Josserand, L., Coussy., O., de Larrard, F. (2006). Bleeding of concrete as an ageing consolidation process. Cement and Concrete Research, 36(9): 1603-1608. http://dx.doi.org/10.1016/j.cemconres.2004.10.006
[8] Josserand, L., de Larrard, F. (2004). A method for concrete bleeding measurement. Materials and Structures, 37: 666-670. http://dx.doi.org/10.1007/BF02480511
[9] Yim, H.J., Kim, J.H., Kwak, H.G., Kim, J.K. (2013). Evaluation of internal bleeding in concrete using a self-weight bleeding test. Cement and Concrete Research, 53: 18-24. http://dx.doi.org/10.1016/j.cemconres.2013.05.015
[10] Pierre, A., Perrot, A., Picandet, V., Guevel, Y. (2015). Cellulose ethers and cement paste permeability. Cement and Concrete Research, 72: 117-127.http://dx.doi.org/10.1016/j.cemconres.2015.02.013
[11] Perrot, A., Lanos, C., Estellé, P., Mélinge, Y. (2006). Ram extrusion force for a frictional plastic material: Model prediction and application to cement paste. Rheol. Acta, 45: 457-467. http://dx.doi.org/101007/s00397-005-0074-y
[12] Picandet V., Amziane, S., Tchamba, J.C. (2005). Study of early shrinkage, hydraulic pressure and conductivity of cement paste. Concreep 7 Conference. Nantes 05, France, 405-410.
[13] Bikoko, T.G.L.J., Tchamba, J.C. (2017). Filtration of fresh cement pastes. Electronic Journal of Geotechnical Engineering, 22(6): 1791-1803.
[14] Tchamba, J.C., Bikoko, T.G.L.J. (2017). Methods of determining transfer properties of fresh cement pastes. Electronic Journal of Geotechnical Engineering, 21(7): 2347-2370.
[15] Tchamba, J.C. (2008). Contribution à l’étude expérimentale du comportement des matériaux cimentaires au jeune âge: pression; rhéologie et perméabilité. (Unpublished doctoral thesis). Université de Bretagne Sud, Lorient, France.
[16] Amziane, S. (2005). Contribution a l'etude des matériaux cimentaires a l'etat frais. Doctoral dissertation, Université de Bretagne Sud. https://tel.archives-ouvertes.fr/tel-00069705/document.
[17] Neville, A.M. (1992). Propriétés des bétons. Ed. Eyrolles, 805.
[18] Andriamanantsilavo, N.R. (2003). Comportement des matériaux cimentaires dans un coffrage: Expérimentation, modélisation et simulation de la poussée et du processus de maturation. Doctoral dissertation, Lorient.
[19] Gardner, W.R. (1956). Calculation of capillary conductivity from pressure plate outflow data. Soil Science Society of America Journal, 20(3): 317-320. https://doi.org/10.2136/sssaj1956.03615995002000030006x
[20] Radocea, A. (1992). A new method for studying bleeding of cement paste. Cement and Concrete Research, 22(5): 855-868. https://doi.org/10.1016/0008-8846(92)90110-H
[21] Uzomaka, O.J. (1969). Some fundamental engineering properties of plastic concrete. Doctoral dissertation, University of Newcastle upon Tyne. https://ethos.bl.uk/OrderDetails.do?uin=uk.bl.ethos.475895.
[22] Moffat, A.I., Uzomaka, O.J. (1970). A soil mechanics analogy applied to the study of plastic concrete. Civil Eng & Public Works Review/UK/, 65(766): 535-538.
[23] Jefferis, S.A. (1988). Application of bleed and settlement theory to problems of offshore grouting. Proc. Grouts and Grouting for Construction and Repair of Offshore Structures, London: HMSO, 72-90.
[24] Powers, T.C. (1968). The Properties of Fresh Concrete. New-York: John Wiley & Sons, Inc, 664.
[25] Florin, V.A., Ivanov, P.L. (1961). Liquefaction of saturated sandy soils. Proceedings of the 5th International Conference on Soil Mechanics and Foundation Engineering, Dunod, 1961: 107-111.
[26] McRoberts, E.C., Nixon, J.F. (1976). A theory of soil sedimentation. Canadian Geotechnical Journal, 13(3): 294-310. https://doi.org/10.1139/t76-031
[27] Bolton, M.D., McKinley, J.D. (1997). Geotechnical properties of fresh cement grout—pressure filtration and consolidation tests. Géotechnique, 47(2): 347-352. https://doi.org/10.1680/geot.1997.47.2.347
[28] Li, X., Xu, Y. (2019). Microstructure-based modeling for water permeability of hydrating cement paste. Journal of Advanced Concrete Technology, 17(7): 405-418. https://doi.org/10.3151/jact.17.405
[29] Perrot, A., Rangeard, D. (2017). Effects of mix design parameters on consolidation behaviour of fresh cement-based materials. Materials and Structures, 50(2): 1-9. https://doi.org/10.1617/s11527-016-0988-0
[30] NF EN 196-1. (2006). Méthodes d’essais des ciments-Partie 1: détermination des résistances mécaniques [Methods of testing cements–part 1: determination of mechanical strengths].
[31] Norme NF P 18-451. (1981). Essais pour béton frais - Partie 2: essais d’affaissement.
[32] De Larrard, F. (2000). Structures granulaires et formulation des bétons. Laboratoire central des ponts et chaussées.
[33] Bikoko, T.G.L.J., Tchamba, J.C., Katte, V., Amziane, S., Okonta, F.N., Tamo, T. (2021). Characterization of lightweight concrete impregnated with cement and cameroonian charcoal as coarse lightweight aggregate. International Journal of Advanced Research in Engineering and Technology, 12(3): 330-365. https://doi.org/10.34218/IJARET.12.3.2021.033
[34] Bikoko, T.G.L.J., Tchamba, J.C., Katte, Deh, K.D. (2022). Effects of 0-30% wood ashes as a substitute of cement on the strength of concretes. in construction technologies and architecture. 4th International Conference on Bio-Based Building Materials. Trans Tech Publications Ltd. 1: 51-60. https://doi.org/10.4028/www.scientific.net/cta.1.51
[35] Bikoko, T.G.L.J. (2021). A Cameroonian study on mixing concrete with wood ashes: Effects of 0-30% wood ashes as a substitute of cement on the strength of concretes. Revue des Composites et des Matériaux Avancés, 31(5): 275-282. https://doi.org/10.18280/rcma.310502