Neelmani | Ramanujam Sarathi* | Hisayuki Suematsu | Toshikatsu Tanaka
© 2021 IIETA. This article is published by IIETA and is licensed under the CC BY 4.0 license (http://creativecommons.org/licenses/by/4.0/).
OPEN ACCESS
The electrical and mechanical properties of the epoxy alumina nanocomposites depend on the uniform dispersion of the nanofiller in the epoxy matrix. Epoxy alumina nanocomposites were prepared using 1, 3, and 5 wt% of alumina nanofiller, and electrical and mechanical properties were analyzed using experimental and modelling studies. Water droplet initiated corona inception voltage (CIV) was identified using fluorescence fiber technique and by Ultra High Frequency (UHF) technique, under AC and DC voltages. The CIV formed due to water droplet have reduced drastically with increase in number of droplets and fluorescent fiber technique found to be more sensitive to identify water droplet initiated discharges. A micro mechanical model was proposed to analyse the combined effect of the interphase and agglomeration properties of the alumina nanoparticles on the tensile strength of epoxy alumina nanocomposites. Variation in ϕagg, Eagg, and E were analysed by adopting the non-parametric distribution of alumina nanoparticles and Young’s modulus increased with the increment in the alumina nanofiller dispersion level. The presence of aggregated particles exhibits a negative effect on the tensile properties of nanocomposites.
alumina, nanoparticles, fluorescence fiber technique, CIV, interphase, agglomeration, Young’s modulus
Epoxy based insulating materials are widely used as an insulant in different high voltage equipment like current transformers, gas insulated switchgear, dry type transformers, etc., because of its good insulating, mechanical, and thermal properties [1]. Development of any reliable insulation structures not only depends on the electrical properties of the insulating materials but also on its mechanical performance. Hence, it is important to understand the both electrical and mechanical behaviour of insulating materials. Further, these electrical and mechanical properties can be improved by the addition of fillers to the base epoxy resin [2]. It is well proven that addition of nanoparticles to base polymer matrix have shown improved properties compared to unmodified polymeric insulating materials or micro filled composites [3]. The improvement in the functional properties of the epoxy nano composites be attributed to the formation of interphase layer between the epoxy matrix and nanofiller. The physical properties of the interphase are different from the base epoxy resin and nanofiller. The cause for it could be due to high surface to volume ratio of the nanoparticles and also the effective electrical and mechanical properties of the nanocomposites mostly depend on the interphase behaviour. Tanaka et al. [4] proposed the multi-layered core model to describe the effect of the interfacial layer on the various properties and phenomena of polymer nanocomposites.
One of the major threats to the insulating material is the accumulation of the charge over the surface of the insulators which could lead to different surface discharge activities. These discharge activities get intensified due to the presence of the water droplet over the surface of the insulating material [5]. In recent times, optical fibers are gaining more importance for the identification of the discharges and recently, Mahidhar et al. [6] indicated fluorescent fiber could identify incipient discharges compared to UHF technique. Hence, it is important to study the variation in the corona inception voltage (CIV) of the epoxy alumina nanocomposites in the presence of water droplets, using UHF and optical fluorescence fiber technique.
Addition of nanofiller affects the tensile properties of the insulating materials. These tensile properties are dependent on the interphase as well as the agglomeration properties of the nanoparticles. Zare [7] determined the theoretical value of Young’s modulus for different polymer nanocomposites using the Halpin-Tsai model by considering the effect of interphase properties and size of nanofiller. A good correlation between the theoretical and experimental was observed at lower content of the nanofiller. Ashraf et al. [8] investigated the effect of the aggregation of nanoparticles on the tensile properties of the polymer nanocomposites and observed that agglomeration can lead to the decrement in the tensile strength of the polymer nanocomposites. Literature on the combined effect of the interphase and agglomeration on the tensile properties of epoxy nanocomposites are scanty. Manta et al. [9] have indicated that tensile properties of nanocomposites are strongly influenced by the uniform dispersion of nanoparticles into the base polymer matrix. In practice, with higher weight percentage of filler in nanocomposites, only certain percentage of nanofillers gets uniformly distributed and the remaining particles gets agglomerated, and its size may not be uniform [10]. Also, non-parametric type of distribution studies on level of agglomeration, size of formation and its distribution in nanocomposites is limited. So, it is very important to analyse the effect of the different level of dispersion of the alumina nanofiller and interphase properties on the tensile strength of the epoxy alumina nanocomposites adopting non-parametric distribution of the agglomerated particles.
Having known all these facts, the present study focusses on (a) study on Corona discharge activity formed due to water droplet on epoxy alumina nanocomposites, under AC and DC voltages, was measured using fluorescence fiber optic technique and UHF technique (b) understanding the impact of interphase and agglomerated particles on the Young’s modulus of the epoxy alumina nanocomposites, by adopting the effect of uniform dispersion and non-parametric type distribution of agglomerated particles.
2.1 Raw materials, instruments and equipment
In the present study, base epoxy (Araldite CY 205 unmodified Bisphenol epoxy purchased from HUNTSMAN), alumina nanoparticles of average particles size of 20-30 nm (Richem international, USA) and the curing agent (Tri-ethylene tetra-amine purchased from HUNTSMAN) was used as raw materials for the preparation of epoxy alumina nanocomposites.
Further, for water droplet initiated discharge studies, function generator (Tektronix 3051C) was used to generate the different voltage profile which was amplified using Trek amplifier (Model 20/20C). Further optical fluorescence signal was recorded using digital storage oscilloscope.
Tensile test was performed on the epoxy alumina nanocomposites using a universal testing machine (KIC-2-0200-C) at a loading capability of 20 kN.
2.2 Preparation of epoxy alumina nanocomposites
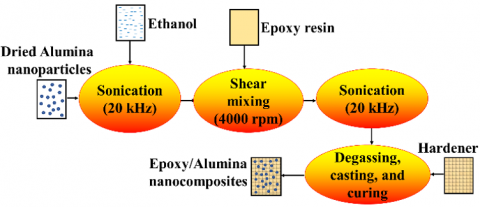
In the present study, epoxy alumina nanocomposites were prepared using base epoxy and alumina nanoparticles. Figure 1 shows the different steps involved in the fabrication of epoxy alumina nanocomposites. First of all, alumina nanoparticles were dried at 150℃ for 24 hours to remove the moisture content present in the nanoparticles. Then the nanoparticles were properly dispersed in the ethanol solution using ultra sonicator for 1 hours. After that appropriate amount of the epoxy resin was added to the alumina-ethanol solution, and was mixed properly using high speed shear mixer. Shear mixing of the epoxy and alumina-ethanol solution was performed for 6 hours at a speed of 4000 rpm. Properly mixed epoxy alumina solution was sonicated for 1 hour in order to uniformly disperse the alumina nanoparticles in the base epoxy resin. Finally, the curing agent was added to the viscous solution of epoxy and alumina and kept into the vacuum desiccator for degassing in order to remove the air bubbles. Finally, the epoxy alumina mixture was casted into the mould and left for curing at room temperature for 24 hours. Epoxy alumina nanocomposites were prepared with 1wt%, 3wt%, and 5wt% of alumina nanofiller.
Figure 1. Preparation of Epoxy/alumina nanocomposites
2.3 Water droplet initiated discharge studies
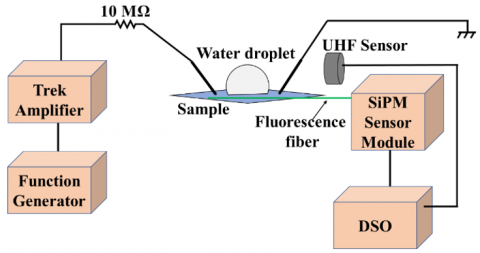
Figure 2. Experimental setup for identifying water droplets initiated discharge using fluorescent fiber technique and UHF technique
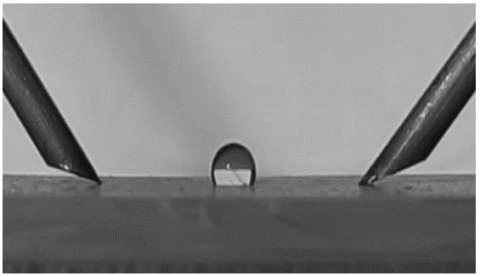
Figure 3. Typical position of the water droplet in electrode gap
Figure 2 shows the water droplet initiated corona discharge inception voltage measurement setup. Test electrode was made up of the stainless steel with the tip cut at 45o as per IEC 60112 [11]. Function generator was used to generate the different voltage profile which was further amplified using Trek amplifier and was connected to one of the electrodes, and the other electrode was grounded. In the present work, water droplet initiated discharge was identified using the fluorescence based partial discharge (PD) measurement system. It consists of the fluorescent fiber, highly sensitive photodetector and digital storage oscilloscope. In the present work, Saint Gobain Crystals BCF 91 A optical fiber was used and it is made of the polystyrene core and polymethylmethacrylate cladding. Optical fiber was placed near the test setup and radiation from the other end was incident on the active area of the silicon photomultiplier (SiPM) module's (SensL's MicroFCSMA 10050), which was supplied with the 29 V of bias voltage. SiPM module exhibited the maximum response around 430 nm wavelength and the signal acquired during the discharges due to the water droplets was amplified (Agilent 8447D amplifier) and recorded using digital storage oscilloscope. In the present work, water droplet of volume 10µl was placed on the surface of the sample and CIV was measured with 1, 2, and 3 droplets placed on the sample surface. Broad band UHF sensor was used to sense the radiated electromagnetic waves due to discharges and its output connected to high bandwidth digital storage oscilloscope. The typical position of the water droplet in electrode gap is shown in Figure 3.
2.4 Tensile test
A universal testing machine was employed to perform the tensile test on the epoxy alumina nanocomposites, at a loading capability of 20 kN. The displacement rate of the upper cross head was kept constant at 2 mm/min for all the specimen. For conducting tensile testing, dumbbell shaped nanocomposites were prepared as per ASTM D-638 (Type IV) standard having gauge length of 25 mm and dimensions 115 X 6 X 3mm. Different strain were measured for all the samples corresponding to the applied stress, and Young’s modulus were calculated.
3.1 Classical models for evaluating Young’s modulus
Incorporation of nanoparticles to the polymer matrix basically alters the tensile properties of the nanocomposites. The tensile parameters are very much dependent on the level of dispersion of nanofiller, mechanical performance of the nanoparticles and on the type of base polymers. Theoretical studies have been carried out to determine the tensile properties of the polymer nanocomposites. Classical models like Einstein, Kerner, Nielsen and Halpin-Tsai models [12-14] were used to evaluate the Young’s modulus of the nanocomposites.
The Einstein model provides the very low value of the Young’s modulus as compared the to the experimental data, as the model relies on the volume fraction of the nanoparticles [12]. Kerner model included the effect of the deformation of materials in terms of Poisson ratio [12]. Yet, the Young’s modulus calculated didn’t show good correlation with experimental studies. Nielsen proposed a model based on the Einstein and Kerner model which takes the account of the nanoparticles volumetric packing fraction, which over predicts at lower wt% of nanofillers and under predicts at higher content of nano filler [12]. Later, Halpin-Tsai model proposed a model, which ignores the effect of interphase, as result it under predicts the value of Young’ modulus for most of the polymer nanocomposites [14].
3.2 Proposed model for evaluating Young’s modulus by considering the effect of interphase and agglomeration
The classical models are based on the tensile properties of polymer matrix and volume fraction of the nanofiller. The classical models ignored the effect of interphase and agglomeration in the model and as a result tensile property predicted by those models for nanocomposites have large deviation from experimental results.
Incorporation of nanoparticles to the polymer matrix, generates the interphase region between the polymer matrix and nanofiller, which actually determines the overall electrical and mechanical properties of the nanocomposites and at higher content of nanofiller, nanoparticles will get agglomerated [15]. So, tensile properties of the nanocomposites depend on the interphase and agglomeration properties. Zare introduced the interphase parameters into the basic Halpin-Tsai model and developed the mathematical model to evaluate the effective Young’s modulus for different polymer nanocomposites [7]. This model is able to estimate the Young’s modulus of polymer nanocomposites containing the lower wt% of nanofiller. At higher wt%, agglomeration of nanoparticles will take place, as result the Young’s modulus evaluated using this model will provide larger deviation.
Nanoparticles have high surface area, as a result there will be strong bonding between the nanoparticles and polymer matrix which enhances the mechanical properties of the nanocomposites. Any agglomeration of nanofiller alters the total surface area, which ultimately changes the tensile properties of nanocomposites.
The total surface area (A) of the nanoparticles dispersed in the polymer matrix can be calculated as,
$A=N\left(2 \pi R^{2}\right)$ (1)
where, N is number of isolated nanoparticles which can be represented as,
$N=\frac{W_{f}}{d_{f} \frac{4}{3} \pi R^{3}}$ (2)
where, R is radius of nanoparticles, Wf is the weight of the nanoparticles, and df is the density of the nanoparticles. The agglomerated nanoparticles have negative impact on the mechanical properties of nanocomposites and will lower down its mechanical performance [16]. So, the effect of the agglomeration along with the interphase properties need to be incorporated in the above model in order to get the appropriate value of Young’s modulus even at higher content of nanoparticles in the polymer matrix.
The volume fraction of the agglomeration present in the base polymer matrix can be determined as [10],
$\phi_{\mathrm{agg}}=\left(\frac{\mathrm{d}_{\mathrm{f}}}{\mathrm{d}_{\mathrm{agg}}}\right)^{\frac{1}{3}} \times \phi_{\mathrm{f}}$ (3)
where, df is the diameter of the nanofiller and dagg is the diameter of the agglomerated nanoparticles.
So, the proposed micro mechanical model is based on the Halpin-Tsai equations by incorporating the agglomeration and interfacial parameters into the equations, and can be represented as,
$\mathrm{E}=\left[\frac{1+2 \eta_{\mathrm{f}} \phi_{\mathrm{f}}+2 \eta_{\mathrm{i}} \phi_{\mathrm{i}}+2 \eta_{\mathrm{agg}} \quad \phi_{\mathrm{agg}}\quad}{1-\eta_{\mathrm{f}} \phi_{\mathrm{f}}-\eta_{\mathrm{i}} \phi_{\mathrm{i}}-\eta_{\mathrm{agg}} \quad \phi_{\mathrm{agg}}\quad}\right] \times \mathrm{E}_{\mathrm{m}}$ (4)
$\eta_{\mathrm{f}}=\left[\frac{\mathrm{E}_{\mathrm{f}} / \mathrm{E}_{\mathrm{m}}-1}{\mathrm{E}_{\mathrm{f}} / \mathrm{E}_{\mathrm{m}}+2}\right]$ (5)
$\eta_{i}=\left[\frac{E_{i} / E_{m}-1}{E_{i} / E_{m}+2}\right]$ (6)
$\phi_{\mathrm{i}}=\left[\left(\frac{\mathrm{R}+\mathrm{R}_{\mathrm{i}}}{\mathrm{R}}\right)^{3}-1\right] \phi_{\mathrm{f}}$ (7)
$\eta_{\mathrm{agg}}=\left[\frac{\mathrm{E}_{\mathrm{agg}} / \mathrm{E}_{\mathrm{m}}-1}{\mathrm{E}_{\mathrm{agg}}/{\mathrm{E}_{\mathrm{m}}+2}}\right]$ (8)
where, Ef is the Young’s modulus of the filler material, Em is Young’s modulus of the base polymer matrix, ϕf is the nanofiller volume fraction, Ei is the Young’s modulus of the interphase, ϕi is the interphase volume fraction, R is the radius of nanofiller, Ri is the interphase thickness and Eagg is the Young’s modulus of agglomeration in the polymer nanocomposites. Eq. (4) represents the theoretical evaluation of Young’s modulus for polymer nanocomposites by considering the both agglomeration and interphase effect.
4.1 Variation in water droplet initiated Corona inception voltage
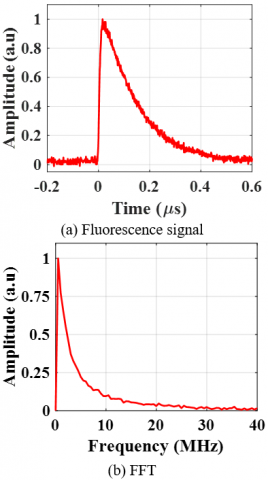
Figure 4. Fluorescence signal and its FFT
Water droplet initiated discharge was carried out with different number of water droplets under AC and DC voltage profile, and corresponding signal was detected using fluorescence sensor. The CIV was obtained based on the first fluorescence signal generated during the discharge due to the water droplets on application of voltage. The luminescence of the fluorescent fiber at its end (F) can be expressed as [17],
$\mathrm{F}=\int_{-\pi / 2}^{-\pi / 2} \int_{0}^{\mathrm{L}} \mathrm{I}(\Theta, \mathrm{Z}) . \mathrm{T}(\theta, \mathrm{Z}) . \mathrm{E}(\Theta, \mathrm{Z}) .[1-\mathrm{K}(\mathrm{Z})] \mathrm{d} \theta . \mathrm{dz}$ (9)
where, L is the fluorescent fiber length, I is the partial discharge light flux, T is the transmissivity of the fluorescent fiber, E is the effective conversion efficiency from the radiant flux of the refracted discharge light to the propagated light through the optical fiber, and K is the transmission loss. During the inception, fluorescent signal was captured using the digital storage oscilloscope. Based on the stored data, MATLAB software was used to plot the graph and further FFT was done for the time domain fluorescent signal. Figure 4 shows the typical fluorescent signal captured during the water droplet initiated discharge and its Fast Fourier Transform (FFT). The frequency response of the fluorescence signal lies in the range of the DC to 25 MHz.
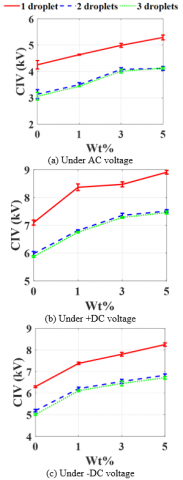
Figure 5. Variation in CIV due to water droplets on epoxy alumina nanocomposites measured by UHF technique
Figure 5 and Figure 6 respectively the shows the variation in the water droplets initiated CIV for different number of water droplets for the epoxy alumina nanocomposites measured using UHF technique and fluorescence fiber technique, under the application of AC, +DC, and -DC voltage supply. Based on the first UHF and fluorescent signal, CIV value was obtained for the pure epoxy and nanocomposites sample.
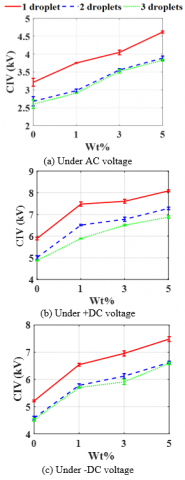
Figure 6. Variation in CIV due to water droplets on epoxy alumina nanocomposites measured by fluoroscent fiber technique
The fluorescent fiber technique was observed to be more sensitive than UHF technique, for identifying the discharges, as result CIV measured using fluorescent fiber technique was observed to be lower as compared to the UHF technique irrespective of the voltage profile. CIV value increased with the increment in the content of the alumina nanofiller. Increment in the value of CIV could be attributed to the increment in the hydrophobicity of the epoxy of alumina nanocomposites with the increment in the wt% of alumina nanofiller [18]. Water droplet under high electric field, it elongates along the direction of high electric field which lead to the enhancement of the electric field near the triple point. Once, these enhancement in the electric field crossed the local ionization potential, incipient discharge occurs. With the increment in the content of the alumina nanofiller, hydrophobicity increased which lead to the increment in the effective distance between the water droplets and the electrode, as a result CIV increased. Also, CIV under AC voltage was observed to be lower than the DC voltage. Under the application of AC voltage, water droplet oscillates between the electrodes which actually polarises the water and lead to the enhancement in the electric field at the triple point and inception occurred at lower voltage. Also, rate of the change in the voltage is higher in AC as compared to DC due to which CIV was observed to higher in case of DC voltages [19].
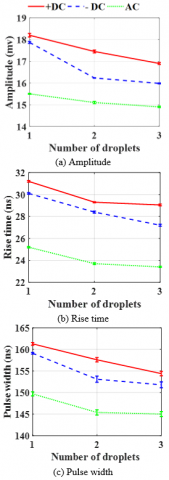
Figure 7. Variation in fluorescence signal formed due to water droplet initiated discharges under AC and DC voltages for the 3wt% sample
It can be observed that CIV value drastically reduced with two and three droplet configurations irrespective of the voltage profile and content of the alumina nanofiller. With the increment in the number of water droplets, number of triple point water junction increased which lead to the more intensification of the electric field near the triple point, as a result electric field would become more non uniform leading to inception at lower voltages. A marginal variation in the CIV was observed for two and three water droplets configuration, under AC and DC voltages, as measured using fluorescent fiber technique.
The amplitude, rise time, and the pulse width of the fluorescence signal captured during the inception was measured and Figure 7 shows the variation in the amplitude, rise time and pulse width of the fluorescence signal for the 3wt% of the epoxy alumina nanocomposites. All the parameters of the fluorescence observed to lower for the applied AC voltage profile as compared to DC voltage, and also the amplitude, rise time, and pulse width of the signal reduced for the 2 droplets and 3 droplets configuration. In general, fluorescence signal parameters varied in proportional to the CIV value.
4.2 Effect of interphase and agglomeration on the Young’s modulus
Having known, interphase parameters of epoxy alumina nanocomposites were determined using modified Halpin-Tsai model. The interphase modulus (Ei) was varied from the epoxy resin modulus (Em) to alumina nanofiller modulus (Ef) i.e. (Em < Ei < Ef). Based on the different Ei value, several interphase thicknesses (Ri) were calculated as per Eq. (4). Now the interphase thicknesses were averaged, which actually represent the exact interphase thickness around nanoparticles in nanocomposites. Finally, the calculated value of Ri was used to determine the exact value of interphase modulus (Ei) using Eqns. (4-6). Similarly, Ri and Ei value were calculated at different content of alumina nanofiller in the epoxy nanocomposites.
The effect of the agglomeration on the Young’s modulus of the nanocomposites were determined using the Eq. (4), the proposed model. The diameter of the agglomerate was varied till 25 times of the alumina filler size and corresponding Young’s modulus were evaluated.
The agglomeration volume fraction (ϕagg) was determined using Eq. (3). Y. Zare evaluated the interphase thickness and corresponding interphase volume fraction for the different polymer nanocomposites and found that lower sized nanoparticles created largest interphase volume fraction which led to the increment in the tensile strength [7].
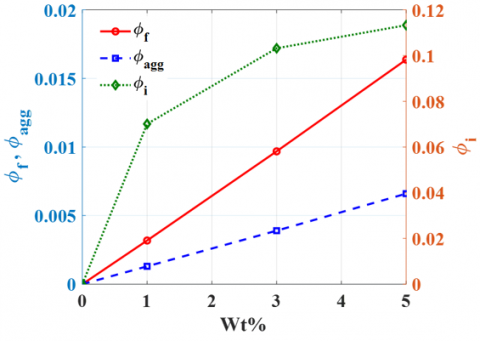
Figure 8 shows the variation in the volume fraction of alumina nanoparticles, aggregated particles, and interphase calculated using Eq. (3) and Eq. (7), at different wt% of alumina nanofiller in the epoxy nanocomposites. The volume fraction for the aggregated alumina nanoparticles was calculated and is highest for 5wt% sample. Ashraf et al. analysed the effect of the size and agglomeration of nanoparticles on the tensile strength of polymer nanocomposites and concluded that the presence of large sized spherical aggregated particles suppressed the interphase properties resulting into the poor tensile strength [8].
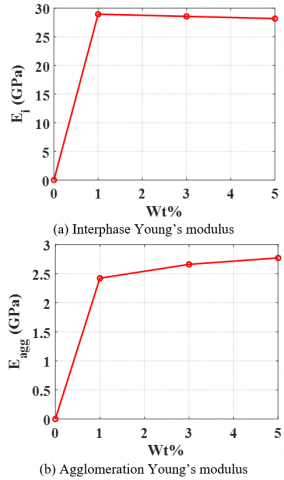
Figure 9 shows the variation in the Young’s modulus of the interphase and agglomeration of epoxy nanocomposites at different content of alumina nanofiller. Neelmani et al. calculated the Young’s modulus and found to be increased with the increment in the wt% of alumina nanofiller [20]. It was observed that variation in the interphase and agglomeration Young’s modulus was small with increase in wt% of alumina nanofiller, and the interphase Young’s modulus was observed to be high.
Figure 8. Variation in the volume fraction of interphase and aggregated nanoparticles for epoxy alumina nanocomposites
Figure 9. Variation in the theoretical Young’s modulus
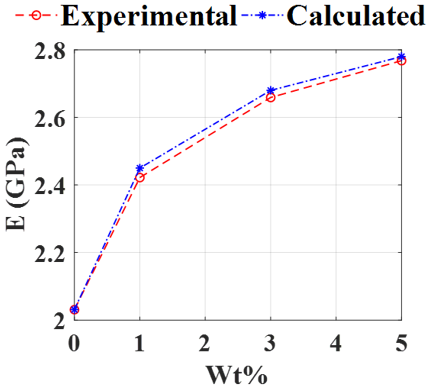
Figure 10 shows the comparison of the experimental and calculated value of Young’s modulus for the epoxy alumina nanocomposites. The experimental [20] and theoretical value of the Young’s modulus are nearly the same, for different wt% of alumina nanofiller in epoxy nanocomposites. This correlation enabled the correctness of the proposed model in estimating the tensile properties of nanocomposites by considering the effect of the both interphase and agglomeration. It can be observed that Young’s modulus was highest for the 5 wt% nanocomposites, as the interphase volume fraction was highest and its effect was dominant as compared to agglomeration effect in estimating the tensile properties.
Figure 10. Experimental and calculated value of Young’s modulus for epoxy alumina nanocomposites
4.3 Effect of uniform dispersion of nanoparticles on the Young’s modulus
Figure 11. Surface area variation with agglomeration diameter for 3wt% samples
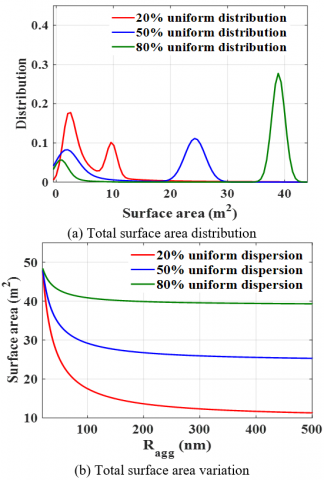
Figure 11 shows the effect of the different level of uniform dispersion of the alumina nanoparticles in the base epoxy matrix, on the total surface area of the nanoparticles. Surface area was observed to follow non parametric distribution and corresponding bandwidth is shown in Table 1. Bandwidth represents the smoothing parameter at which data can be accurately fitted according to non-parametric distribution characteristics and it was observed to be highest for 20% uniformly distributed alumina nanoparticles. First peak in the non-parametric distribution curve of the surface area (Figure 11(a)) corresponds to the surface area affected due to the agglomerated particles and other peak corresponds to the area formed due to uniform dispersion of the alumina nanofiller in the base epoxy matrix. With the increment in the % of the uniform dispersion, right most peak of the distribution curve increased to higher value and observed to be distributed along the higher surface area.
Figure 11(b) shows the variation in the surface area of the nanoparticles as a function of the agglomeration radius at different level of dispersibility of alumina nanofiller in the base epoxy resin. Surface area decreased with the increment in the aggregated alumina nanoparticles size and also surface area characteristics shifted to higher value with the increment in the percentage of the uniform dispersion of alumina nanofiller.
Figure 12. Distribution of the ϕagg, Eagg, and E in the 3wt% epoxy alumina at different levels of uniform dispersion
Figure 12 shows the non-parametric distribution of the volume fraction and Young’s modulus of the agglomeration, and effective Young’s modulus calculated using the proposed model, at different level of uniform distribution of alumina nanofiller in the 3wt% sample of epoxy nanocomposites. The bandwidth at which non-parametric distribution curve of the ϕagg, Eagg, and E were fitted are shown in Table 2, and the bandwidth value was observed to decrease with the increment in the dispersibility of alumina nanofiller in the base epoxy matrix.
Dispersion of the alumina nanofiller were varied for 20% to 80% and it was observed that non-parametric distribution of the agglomeration volume fraction shifted from lower to higher value enhancing the tensile strength of the epoxy alumina nanocomposites.
Table 1. Bandwidth for surface area distribution
|
% Uniform dispersion |
Bandwidth |
|
20% |
0.00914 |
|
50% |
0.0062 |
|
80% |
0.0009 |
Table 2. Bandwidth for ϕagg, Eagg, and E distribution
|
% Uniform dispersion |
Bandwidth |
||
|
ϕagg |
Eagg |
E |
|
|
20% |
0.0015 |
0.046 |
0.0090 |
|
50% |
0.0012 |
0.038 |
0.0075 |
|
80% |
0.0004 |
0.014 |
0.002 |
The important conclusions accrued based on the present study are the following.
The electrical and mechanical properties of the epoxy alumina nanocomposites were analysed using experimental and modelling studies.
Water droplets initiated discharges studies were carried out and corona inception voltage was identified using UHF and fluorescent optical fiber technique. Also, the fluorescent fiber technique was observed to be more sensitive than UHF technique, for identifying the discharges.
The CIV value increased with the increment in the content of the alumina nanofiller due to increment in the hydrophobicity of the materials. It was also observed that increment in number of water droplets in the electrode gap reduces CIV due to increment in the number of triple point water junction which led to the more intensification of the electric field near the triple point.
The micromechanical model was proposed including the effect of interphase and agglomeration on the tensile properties of the nanocomposites materials which was neglected by the classical model.
The effect of the uniform dispersion on the tensile strength was evaluated adopting non-parametric distribution of aggregated and uniformly dispersed alumina nanoparticles in the epoxy alumina nanocomposites. The Young’s modulus increased with the increment in the nanofiller dispersion level. At 5wt% of alumina nanofiller, agglomeration of the nanoparticles would be dominant and it suppressed the tensile properties of nanocomposites.
[1] Calebrese, C., Hui, L., Schadler L.S., Nelson, J.K. (2011). A review on the importance of nanocomposite processing to enhance electrical insulation. IEEE Transactions on Dielectrics and Electrical Insulation, 18(4): 938-945.
[2] Tanaka, T., Montanari, G.C., Mülhaupt, R. (2004). Polymer nanocomposites as dielectrics and electrical insulation-perspectives for processing technologies material characterization and future applications. IEEE Transactions on Dielectrics and Electrical Insulation, 11(5): 763-783. https://doi.org/10.1109/TDEI.2004.1349782
[3] Tanaka, T., Imai, T. (2017). Advanced Nanodielectrics: fundamentals and applications, CRC Press, United States
[4] Tanaka, T., Kozako, M., Fuse, N., Ohki, Y. (2005). Proposal of a multicore model for polymer nanocomposite dielectrics. IEEE Transactions on Dielectrics and Electrical Insulation, 12(4): 669-681. https://doi.org/10.1109/TDEI.2005.1511092
[5] Du, B.X., Xia, M. (2014). Influence of surface charge on DC flashover characteristics of epoxy/BN nanocomposites. IEEE Transactions on Dielectrics and Electrical Insulation, 21(2): 529-536. https://doi.org/10.1109/TDEI.2013.004137
[6] Mahidhar, G.D.P., Sarathi, R., Srinivasan, B. (2020). Fluorescence fiber based identification of partial discharges in liquid nitrogen for high-Temperature superconducting power apparatus. IEEE Sensors Letters, 4(2): 5000304. https://doi.org/10.1109/LSENS.2020.2971015
[7] Zare, Y. (2016). Development of Halpin-Tsai model for polymer nanocomposites assuming interphase properties and nanofiller size. Polymer Testing, 51: 69-73. https://doi.org/10.1016/j.polymertesting.2016.02.010
[8] Ashraf, M.A., Peng, W., Zare, Y., Rhee, K.Y. (2018). Effects of size and aggregation/agglomeration of nanoparticles on the interfacial/interphase properties and tensile strength of polymer nanocomposites. Nanoscale Research Letters, 13(214): 1-7. https://doi.org/10.1186/s11671-018-2624-0
[9] Manta, A., Gresil, M., Soutis, C. (2020). Tensile and flexural behaviour of a graphene/epoxy composite: experiments and simulation. Journal of Physics: Materials, 3(1): 014006. https://doi.org/10.1088/2515-7639/ab52d8
[10] Šupová, M., Martynková, G.S., Barabaszová, K. (2011). Effect of nanofillers dispersion in polymer matrices: A review. Science of Advanced Materials, 3(1): 1-25. https://doi.org/10.1166/sam.2011.1136
[11] IEC 60112. (1972). Recommended Method for Determining the Comparative Tracking Index of Solid Insulating Material Under Moist Condition, 2nd edition.
[12] Moreira, D.C., Sphaier, L.A., Reis, J.M.L., Nunes, L.C.S. (2012). Determination of Young’s modulus in polyester-Al2O3 and epoxy-Al2O3 nanocomposites using the Digital Image Correlation method. Composites Part A: Applied Science and Manufacturing, 43(2): 304-309. https://doi.org/10.1016/j.compositesa.2011.11.005
[13] Wu, Y.P., Jia, Q.X., Yu, D.S., Zhang, L.Q. (2004). Modeling Young’s modulus of rubber-clay nanocomposites using composite theories. Polymer Testing, 23(8): 903-909. https://doi.org/10.1016/j.polymertesting.2004.05.004
[14] Halpin, J.C. (1969). Stiffness and expansion estimates for oriented short fiber composites. Journal of Composite Materials, 3: 732-734. https://doi.org/10.1177/002199836900300419
[15] Lewis, T.J. (2004). Interphases are the dominant feature of dielectrics at the nanonmetric level. IEEE Transactions on Dielectrics and Electrical Insulation, 11(5): 739-753. https://doi.org/10.1109/TDEI.2004.1349779
[16] Ma, X., Zare, Y., Rhee, K.Y. (2017). A two-step methodology to study the influence of aggregation/agglomeration of nanoparticles on Young’s modulus of polymer nanocomposites. Nanoscale Research Letters, 12(621): 1-7. https://doi.org/10.1186/s11671-017-2386-0
[17] Muto, K. (1989). Electric-discharge sensor utilizing fluorescent optical fiber. Journal of Lightwave Technology, 7(7): 1029-1032. https://doi.org/10.1109/50.29629
[18] Neelmani, Suematsu, H., Sarathi, R. (2020). Investigation on space charge dynamics and mechanical properties of Epoxy Alumina nanocomposites. Material Research Express, 7(2): 025037. https://doi.org/10.1088/2053-1591/ab5ee3
[19] Nazemi, M.H., Hinrichsen, V. (2013). Experimental investigations on water droplet oscillation and partial discharge inception voltage on polymeric insulating surfaces under the influence of AC electric field stress. IEEE Transactions on Dielectrics and Electrical Insulation, 20(2): 443-453. https://doi.org/10.1109/TDEI.2013.6508746
[20] Neelmani, Velmurugan, R., Jayaganthan, R., Sarathi R., Suematsu, H. (2020). Investigation of surface strain by digital image correlation and charge trap characteristics of epoxy alumina nanocomposites. Nano Express, 1(1): 010043. https://doi.org/10.1088/2632-959X/ab95e7