Zhenduo Sun* | Shifeng Wang | Dongbo Hou
© 2021 IIETA. This article is published by IIETA and is licensed under the CC BY 4.0 license (http://creativecommons.org/licenses/by/4.0/).
OPEN ACCESS
The work aims to obtain the local mechanical parameters of carburized layer of CiNi steel. Tensile test and nano-indentation test were carried out for CrNi steel, stress-strain curve and load-displacement curve were then obtained. The finite element model of nano-indentation was built, and a model for obtaining the local mechanical parameters of carburized layer from load-displacement curve was established combined with dimension analysis. The mechanical parameters of pure iron and carburized layer of CrNi steel were calculated. The results show that, the dimension analysis model is accurate for predicting the mechanical properties of pure iron, the model accuracy is verified. The local mechanical parameters of carburized layer are predicted by the model, the simulated load-replacement curve based on the predicted mechanical parameters is in good agreement with the experimental result, it shows that the prediction result of the model is reasonable.
CrNi steel, carburized, nano-indentation, dimension analysis, mechanical property
With the development of the industry, the key components of the mechanical structure are required to carry the cycle life of the ultra-high cycle in addition to high-speed, overload and lightweight design requirements [1, 2]. The key components of the mechanical structure are mostly made of high-strength steel materials. In order to improve the fatigue life of key components, it is often necessary to surface strengthen treatment of high-strength steel materials to enhance their mechanical properties and fatigue strength [3, 4]. Therefore, it is important to study the basic mechanical properties of steel containing surface reinforcing layers. It is very difficult to measure the mechanical properties of the surface reinforced layer by experimental method, researchers usually regard the surface reinforced layer as uniform material when studying the surface reinforced component, and ignore the mechanical properties of the surface reinforced layer when analyzing its mechanical properties.
Many scholars have discussed the improvement of fatigue and mechanical properties by surface strengthening such as carburizing, shot peening and rolling from a macroscopic point of view, but there are relatively few studies to analyze the characteristics of carburizing layer from a microscopic point of view of mechanical properties. Since the mechanical properties of thin film materials are difficult to be measured by macroscopic means, nano-indentation was initially used to push back the mechanical properties of thin film materials. Later, some scholars carried out research work on the mechanical properties of metal materials based on nano-indentation. Dao et al. [5] carried out the research work on the micro-mechanical properties of materials based on nano-indentation, and established the correlation model between the load-displacement curve and the elastic-plastic constitutive relation curve obtained by nano-indentation measurement based on the dimensional analysis. Niu and Li [6] tested the local hardness, elastic modulus and load-displacement curve of cold-struck splines through nano-indentation experiment, and established a model to calculate the micro-hardness mechanical parameters by the load-displacement curve of local performance layer of splines. Chen et al. [7] measured the elastic modulus, hardness and load displacement curves of the inclusion and matrix structure based on nano-indentation, and calculated the strength and plasticity index of the inclusion and matrix. Guo et al. [8] measured the elastic modulus, hardness and load-displacement curves of different areas of the welded joint based on nano-indentation, and discussed the cyclic deformation characteristics and local mechanical properties of the welding weakening area. Li et al. [9] used nano-indentation test and tensile test to measure the hardness, elastic modulus, strain hardening index and other parameters of 45 steel after torsion, and calculated the yield strength and other mechanical properties of 45 steel based on load-displacement curve. Yin et al. [10] measured the mechanical properties of different regions of electron beam welding joints based on nano-indentation, and established the relationship between load-displacement curve and macroscopic mechanical parameters based on dimensionless function. In the above studies, the relationship model between nano-indentation load-displacement curve and material mechanical parameters is not given in part, and there is a large deviation when calculate the mechanical property parameters of carburizing layer based on the existing model.
Based on CrNi steel as the research object, this paper measured the microscopic parameters such as elastic modulus, hardness based on the nano-indentation apparatus, and established the model describing the relationship between the load-displacement curve and macroscopic stress-strain combined with nano-indentation finite element model and dimension analysis based on the load-displacement curve, and used the purity of the model to verify the accuracy of the model, and calculated the local mechanical performance parameters of the CrNi steel carbon region.
2.1 Experimental materials
The test material is CrNi steel, and its ingredients are shown in Table 1.
Table 1. Chemical composition of steel (wt%)
|
C |
Si |
Mn |
Cr |
Ni |
W |
V |
Mo |
|
0.16 |
0.19 |
0.33 |
1.55 |
4.22 |
0.97 |
0.01 |
0.01 |
Some of the samples were carburized, followed by quenching process at 860℃ for 30 minutes and low temperature tempering process at 200℃ for 2 hours.
2.2 Tensile mechanical properties
Tensile tests were carried out on standard tensile specimens of uncarburized CrNi steel using the MTS-809 fatigue testing machine, and the stress-strain curves of the steel were obtained, as shown in Figure 1.
Figure 1. Stress-strain curve of CrNisteel
2.3 Nano-indentation experiment
The uncarburized and carburized specimens of CrNi steel were polished and polished with sand paper and abrasive paste respectively. Then nano-indentation tests were carried out from the surface to the inside of the specimens with Agilent-G200 nano-indentation instrument. The indentation interval of uncarburized sample is 100 μm, and that of carburized sample is 50 μm, as shown in Figure 2.
Figure 2. The microscopic indentation morphology
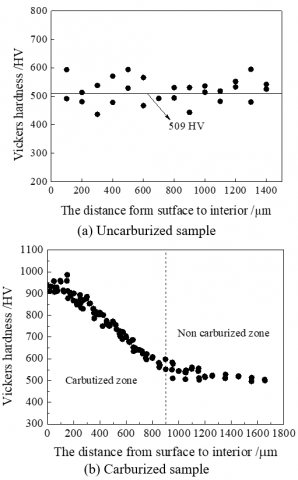
The hardness trend of uncarburized and carburized specimens of CrNi steel from surface to inside is plotted, as shown in Figure 3. It can be found that the hardness distribution of uncarburized samples is roughly uniform, and the average Vickers hardness is 509HV. The hardness of the carburized sample decreases gradually with the change of the distance from the surface to the interior, and the dispersion of surface data is large, about 950HV. When it extends to the interior of about 900μm, the hardness value tends to be constant, about 500HV, which is equivalent to the hardness of the uncarburized sample.
Figure 3. Micro-hardness of CrNi steel
3.1 Finite element model
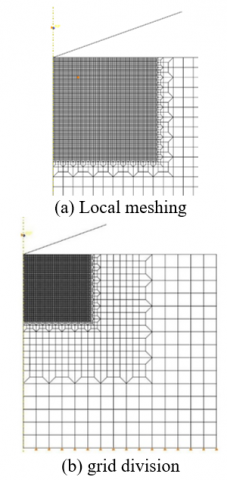
Standard Berkovich indentation head was selected for the nano-indentation experiment. Due to the symmetry of the structure of the pressed material and the load applied by the indentation head, the two-dimensional symmetric model can obtain basically the same simulation results as the three-dimensional model [11]. Therefore, this paper used the symmetric two-dimensional model to simulate the nano-indentation experiment based on the ABAQUS software. Berkovich indenter is equivalent to rigid conical indenter with half angle θ = 70.32°. In addition, the friction coefficient has little influence on the dimensionless function [12], so the friction coefficient between the head and the material is set to 0. The meshing structure of the model is shown in Figure 4.
Figure 4. Schematic diagram of two-dimensional axisymmetric grid division
3.2 Finite element analysis results
As shown in Figure 5, the finite element analysis results show that the strain and stress of the material at the tip of the indenter are the highest, and both stress and strain show a trend of gradual decrease from the tip to the nearby.
Figure 5. Mises equivalent stress distribution under the action of Berkovich indenter
Figure 6. The simulated load-displacement curve is compared with the experimental one
Based on nano-indentation experiment and finite element simulation analysis respectively, comparing the load-displacement curve as shown in Figure 6, the maximum load of the simulation curve is consistent with the experiment, and there is a small error at the end of the unloading curve, but the overall trend is relatively close, it shows that the analysis results of finite element model is relatively accurate.
4.1 Method of dimensional analysis
It is assumed that the uniaxial stress-strain relationship of metal materials obeys Hooke's law at the elastic stage and conforms to the power-enhanced exponential function model distribution and satisfies the Von Mises yield criterion at the plastic stage, as shown in Figure 7. The elastic-plastic power strengthening stress-strain relationship is expressed as [5]:
$\sigma=\left\{\begin{array}{cc}E \varepsilon & \left(\sigma \leq \sigma_{\mathrm{y}}\right) \\ R \varepsilon^{n}=\sigma_{y}\left(1+\frac{E}{\sigma_{y}} \varepsilon_{p}\right)^{n} & \left(\sigma>\sigma_{\mathrm{y}}\right)\end{array}\right.$ (1)
where, R is the strength coefficient (Mpa), n is the strain hardening index, σy is the yield strength (Mpa), and εp is the plastic strain larger than εy in the total strain.
Figure 7. Stress-strain curve of elastic-plastic power hardening model
In dimensional analysis, the following three kinds of parameter values are taken: (1) Load-displacement curve: load F, indentation depth h and contact depth hc; (2) Elastoplastic mechanical parameters of the material: elastic modulus E, Poisson's ratio υ, yield strength σy and strain hardening exponent n; (3) Relevant parameters of the indentation head: elastic modulus of the indentation head Ei, poisson's ratio υi, half angle of the indentation head θ and friction coefficient μ between the indentation head and the material. Establish the functional relationship between the three [5]:
$F=f\left(h, E, v, \sigma_{y}, n, E_{i}, v_{i}, \theta, \mu\right)$ (2)
$h_{c}=g\left(h, E, v, \sigma_{y}, n, E_{i}, v_{i}, \theta, \mu\right)$ (3)
The indentation head can be regarded as a rigid body. The poisson's ratio of the metal material υ=0.3, the half angle of the pressure head is fixed as θ=70.32°, and the friction coefficient μ is 0. The parameters such as poisson's ratio υ of the material, elastic modulus Ei of the indenter, Poisson's ratio υi, half angle θ, and the indenter and friction coefficient μ can be removed. The above equation can be simplified as:
$F=f\left(h, E, \sigma_{y}, n\right)$ (4)
$h_{c}=g\left(h, E, \sigma_{y}, n\right)$ (5)
Length unit L, mass unit M and time unit T are selected as the basic measurement units:
$\frac{F}{E h^{2}}=\Pi_{\alpha}\left(\Pi_{1}, \Pi_{2}\right)=\Pi_{\alpha}\left(\frac{\sigma_{y}}{E}, n\right)$ (6)
$\frac{h_{c}}{h}=\Pi_{\beta}\left(\Pi_{1}, \Pi_{2}\right)=\Pi_{\beta}\left(\frac{\sigma_{y}}{E}, n\right)$ (7)
4.2 Determination of dimensional analysis model
Based on 76 materials with different properties, Dao et al. [5] established a model to reverse the mechanical parameters of materials based on load-displacement curve parameters. In this paper, when determining the model, the combination scheme which is close to the steel property is selected, and the finite element analysis results and dimensional analysis are combined to establish the model of mechanical property parameters of the carburized zone based on the load-displacement curve. The simulation scheme is shown in Table 2.
Table 2. The combination of elastoplastic mechanical parameters selected in this paper
|
Mechanical parameters |
E (Gpa) |
σy (MPa) |
σy /E |
|
Simulation scheme |
170 |
300 |
0.001765 |
|
170 |
1500 |
0.008824 |
|
|
170 |
3000 |
0.017647 |
|
|
210 |
300 |
0.001429 |
|
|
210 |
1800 |
0.008571 |
|
|
210 |
3000 |
0.014286 |
The strain hardening indices n of the above six combinations are 0, 0.1, 0.3 and 0.5, respectively.
The Mises stress nephogram when σy /E = 0.008571 is shown in Figure 8. It can be found that when n is 0 and 0.1 respectively, there is a large stress concentration phenomenon at the edge of indentation, and the pile-up effect will occur. When n is 0.3 and 0.5 respectively, there is almost no stress concentration at the indentation edge, and the sink-in effect will occur at this time, which is the same as the study of Giannakopoulos [13], that is, in the low-strain-hardening alloy, the incompressibility of the plastic deformation makes the plastically displaced material tend to flow upward (accumulated on the surface of the indenter). The high strain hardening material sinks below the initial surface with the indentation and the plastic deformation area is pushed out of the indentation head.
Figure 8. Mise equivalent stress distribution cloud diagram, σy/E = 0.008571
When σy /E = 0.008571, the load-displacement curve is shown in Figure 9. With the increase of n, the load at the tip of the indentation head increases from about 565mN to 920mN, which is consistent with the change trend of the equivalent stress at the indentation head. This indicates that the ability of metal material to resist plastic deformation under the action of load increases correspondingly, and the stress at the tip of the indentation head also increases with the increase of the strain hardening index.
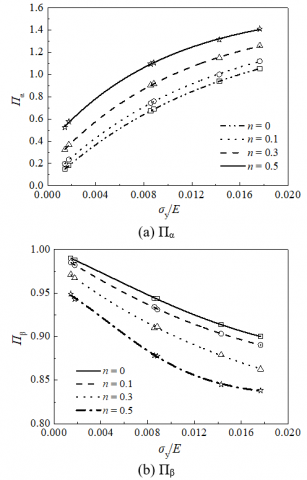
The trend of the dimensionless function with respect to σy /E is shown in Figure 10. It can be found that Πα increases with the increase of σy /E, while Πβ decreases with the increase of σy /E under the same strain hardening exponent n. For the same σy /E, Πα increases with the increase of n, while Πβ decreases with the increase of n.
Figure 9. The simulated load-displacement curve, σy/E=0.008571
Figure 10. The relationships of dimensionless functions withσy/E
Fit the above data to obtain the following dimensionless function expression:
$\Pi_{\alpha}=\left(3.16-7.65 x+5.06 x^{2}\right.$
$+9.55 y) y^{\left(-0.0698 \ln (y)-0.7075 x-0.3185 x^{2}\right)}$ (8)
$\Pi_{\beta}=4.05+1.51 x+0.3108 x^{2}-$
$3.05 \exp \left(0.5107 x-0.0151 x^{2}\right) \exp \left(2.85 y-56.58 y^{2}\right)$ (9)
Eqns. (8) and (9) are the dimensional function model for calculating the mechanical property parameters of the CrNi steel carburizing zone based on the load-displacement curve.
Using the nano-indentation experimental data of pure iron and combining with the above model, the macroscopic mechanical property parameters of pure iron were deduced and compared with the experimental data in literature [14] to verify the accuracy of the model. The yield strength of pure iron based on the model inversion is 310 MPa, and the strain hardening index is 0.196. The stress-strain curve of pure iron is obtained by the elastic-plastic power strengthening law. The load-displacement curve is obtained based on the finite element model simulation, and compared with the indentation test data of pure iron, the results are shown in Figure 11.
Figure 11. Comparison of pure iron simulation curve and experimental curve
It can be found that in the loading area, the experimental results are slightly higher than the simulation results, but the error is not large, and the maximum loading load is basically the same. The first part of the curve is consistent while there is a small deviation in the second part during unloading. In general, the simulation results are consistent with the experimental results, which indicates the accuracy of the dimensionless function model constructed in this paper is high.
4.3 Calculation of mechanical parameters of carburizing layer
In order to avoid the influence of the dispersion of the nano-indentation test data on the surface of the carburized sample, the parameters of the nano-indentation test data in a local area of 150μm from the surface to the interior were extracted as follows: Fmax = 626.83 mN,S = 1613.30mN/μm,hmax = 1.91μm, hc = 1.63 μm, E = 220 GPa, The dimensionless parameters (Πα, nβ) are calculated.
$\Pi_{\alpha}=F_{\max } / E h^{2}=0.8210$
$\Pi_{\beta}=h_{c} / h_{\max }=0.8533$
The mechanical properties of the local area of the carburized layer are obtained by substituting(Πα,Πβ) into equations (8) and (9), i.e., the strain hardening index n = 0.2078 and the yield strength σy = 1774.8 MPa. The uniaxial stress-strain relationship of the carburized layer obeyed Hooke's law in the elastic stage, and the power strengthening exponential model was used in the plastic stage, and the Von Mises yield criterion was followed. The elastoplastic power strengthening stress-strain curve of the local carburized zone at a depth of 150 μm was obtained, as shown in Figure 12. The stress-strain relationship was imported into the finite element model to obtain the simulated load-displacement curve, which was compared with the experimental curve, as shown in Figure 13.
Figure 12. Stress - strain curve of carburized layers at a depth of 150μm
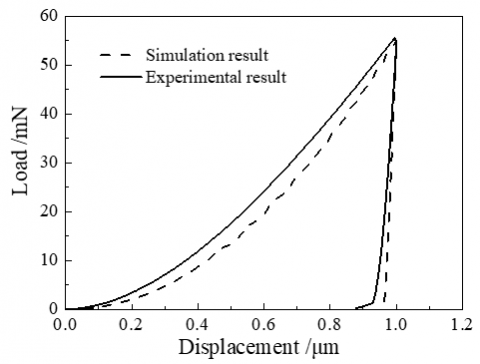
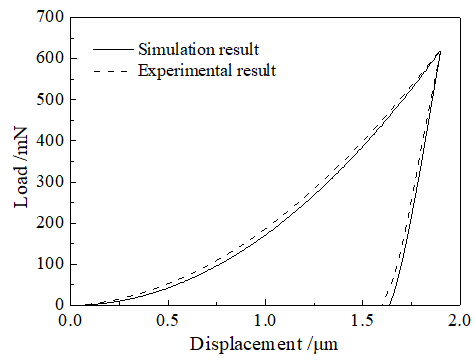
Figure 13. Comparison of simulation curve and experimental curve
It can be found that the local load-displacement curve of the carburizing area obtained by simulation is in good agreement with the experimental curve on the whole. In the loading part of the curve, the beginning and the end of the curve basically coincide. In the middle part, the simulation curve is slightly lower than the experimental curve, but the error is small. The maximum load obtained from the simulation is 619.3 mN, and the maximum load obtained from the experimental curve is 626.8 mN, and the error between the two is only 1.2%. The simulation curve in the unloading area agrees well with the experimental curve. Therefore, the mechanical property parameters of the carburizing layer obtained by backward deduction are more accurate.
In this paper, CrNi steel was taken as the research object, a dimensional analysis model was established to calculate the local mechanical property parameters of CrNi steel in the carburizing region based on load-displacement curve parameters combined with nano-indentation experiment and finite element analysis. The following conclusions were drawn:
(1) The mechanical property parameters of pure iron were calculated, and the power function stress-strain relationship curve was given based on the established dimensional analysis model, combined with the nano-indentation load-displacement experimental curve of pure iron. The simulation load displacement curve of pure iron was given based on the finite element model. The results show that the simulation curve of pure iron is consistent with the experimental curve, which verifies the accuracy of the model.
(2) The mechanical property parameters of the carburized region 150μm from the surface were predicted, and the stress-strain curve of the carburized region was given based on the established dimensional analysis model. The load-displacement simulation curve of the region was calculated based on the finite element model, and the simulation curve was in good agreement with the experimental curve. It shows that the prediction results of the model for the local mechanical properties of carburizing are reasonable.
This research was supported by the Natural Science Foundation of Hebei Province (No. E2018201265) and funded by Science and Technology Project of Hebei Education Department (No. QN2017307).
[1] Xie, X.T., He, B.L., Deng, H.P. (2018). Ultra high cycle fatigue properties of MB8 magnesium alloy welded joint. Ordnance Material Science and Engineering, 41(1): 20-23. https://doi.org/10.14024/j.cnki.1004-244x.20171206.001
[2] Zeng, C., Tian, W., Luo, S.M., Liu, X.Y. (2020). Fatigue characteristics of aeronautic riveted lap joint based on equivalent life. Ordnance Material Science and Engineering, 43(2): 81-86. https://doi.org/10.14024/j.cnki.1004-244x.20191202.006
[3] Zhao, G.H., Lv, Z.J., Yang, W.H., Wang, Y.P., Bao, M.D. (2020). Rolling strengthening and comprehensive properties of manganese brass. Ordnance Material Science and Engineering, 43(6): 74-77. https://doi.org/10.14024/j.cnki.1004-244x.20200910.001
[4] Li, W., Sun, Z., Zhang, Z., Deng, H., Sakai, T. (2015). Influence of case-carburizing and micro-defect on competing failure behaviors of Ni–Cr–W steel under gigacycle fatigue. International Journal of Fatigue, 72: 66-74. https://doi.org/10.1016/j.ijfatigue.2014.11.004
[5] Dao, M., Chollacoop, N.V., Van Vliet, K.J., Venkatesh, T.A., Suresh, S. (2001). Computational modeling of the forward and reverse problems in instrumented sharp indentation. Acta Materialia, 49(19): 3899-3918. https://doi.org/10.1016/S1359-6454(01)00295-6
[6] Niu, T., Li, Y.T. (2018). Analysis on mechanical properties and mechanical model of performance layer forhigh speed cold roll-beating spline. Forging & Stamping Technology, 43(2): 62-68. https://doi.org/10.13330/j.issn.1000-3940.2018.02.012
[7] Chen, D., Li, R.W., Ma, R., Chen, X.L., Wang, Z.H., Su, B., Zhang, X.J., Meng, D.Q. (2019). Nanoindentation Characterization of Inclusions in U-Nb Alloy. Rare Metal Materials and Engineering, 48(1): 165-170.
[8] Guo, S.J., Cui, Y.Y., Huang, Y.H., Xuan, F.Z. (2018). Experimental study on the local plastic behavior in the welded joint based on the cyclic indentation method. Chinese Quarterly of Mechanics, 39(4): 742-749. https://doi.org/10.15959/j.cnki.0254-0053.2018.04.008
[9] Li, C., Zhao, H.W., Sun, L.L. (2019). Mechanical property of 45 steel under reciprocating torsional load based on nanoindentation analysis. Journal of Jilin university (Engineering and Technology Edition), 49(3): 859-864. https://doi.org/10.13229/j.cnki.jdxbgxb20180667
[10] Yin, L.W., Yang, S.H., Guo, H.D. (2020). Mechanical properties of Ti2ANb welded joints based on nano-indentation. Journal of Materials Science and Engineering, 38(3): 397-487. https://doi.org/10.14136/j.cnki.issn1673-2812.2020.03.009
[11] Lichinchi, M., Lenardi, C., Haupt, J., Vitali, R. (1998). Simulation of Berkovich nanoindentation experiments on thin films using finite element method. Thin Solid Films, 312(1-2): 240-248. https://doi.org/10.1016/S0040-6090(97)00739-6
[12] Ma, Z.S. (2011). Nanoindentation method was used to characterize the mechanical properties of metal films. Xiangtan University.
[13] Giannakopoulos, A.E., Suresh, S. (1999). Determination of elastoplastic properties by instrumented sharp indentation. Scripta Materialia, 40(10): 1191-1198.
[14] Bao, W.P., Ren, X.P., Zhang, Y. (2009). The characteristics of flow stress and dynamic constitutive model at high strain rates for pure iron. Journal of Plasticity Engineering, 16(5): 125-129.