Naga Venkata Sai Ram Yellapragada* | Tara Sasanka Cherukuri | Prabakaran Jayaraman | Sameer Kumar Devarakonda
© 2021 IIETA. This article is published by IIETA and is licensed under the CC BY 4.0 license (http://creativecommons.org/licenses/by/4.0/).
OPEN ACCESS
This work confers to the preparation of Lanthanum Hexa Aluminate (LHA) nanoparticles by chemical precipitation and filtration technique followed by characterization studies conducted through X-ray peak profile analysis (XPPA) and Field Emission Scanning Electron Microscopy (FESEM) supported by Energy Dispersive Spectroscopy (EDS). From the X-ray diffraction (XRD) analysis, it has been observed that the prepared powder has hexagonal crystal structure. Further, Scherrer Method (S-M), modified Williamson–Hall (W-H), and Size–Strain Plot (SSP) methods have been implemented to all LHA reflection peaks for the comprehensive crystalline analysis. The influence of crystallite size, stress, strain, and energy density values on the peak broadening of LHA nanoparticles has been critically examined and discussed in the current work. In addition to regular mathematical models this paper also provides an insight into the calculation of Youngs modulus without tedious experimental procedure. The predicted crystallite size estimated from Scherrer’s formula, and W-H models are correlated to scanning electron microscopy results and observed that the average grain size of LHA nano particles estimated from SEM analysis, and models have less deviation in the present study.
Lanthanum Hexa Aluminate (LHA), X-ray diffraction (XRD) analysis, Scherrer Method (S-M), Williamson–Hall (W-H), Size–Strain Plot (SSP)
Hexa aluminates have strange layered structures consisting of alternately stacked spinel blocks and mirror planes. Because of the superior sintering and thermal shock resistance capabilities, these materials have made attention in high-temperature applications [1]. Lanthanum Hexa Aluminate (LHA) is a composite oxide derived from Lanthanum as one of the matrix materials. Within less time, this material has shown greater competence to the existing Yttria based materials and emerged as a novel material for thermal barrier coating in gas turbine applications [2, 3]. These materials are a new kind of heat-resistant ceramic materials that attracted considerable attention with exceptional high-temperature stability, electrical insulating properties, and optical consistency in the fields of aviation, electrical, marine, and thermal barriers coatings industry [4-7]. But, the economical production of LHA nano particles is a major challenge.
A lot of research has been underway in recent years on the preparation nano powders by Ball milling, Shockwave consolidation technique, Sol-gel method, Electroless plating, and Chemical precipitation and filtration methods [8-10]. However, Chemical precipitation and filtration method is adopted here with due considerations of low cost and easy implementation. After preparation, the characterization of these powder samples is essential because these materials are produced in the order of <100 nm as these can influence the properties. XRD, Photo Luminescence Spectroscopy, Fourier transform infrared spectroscopy (FTIR), FESEM with EDX, Transmission Electron Microscopy (TEM) are the popular methods used by many researchers and scientists for the analysis on composition, morphology, structure and particle size. The simplest approach for the determination of crystal size is X-ray peak profile diffraction analysis when compared to any other technique [11].
A. Guinier reported that nano crystal’s X-ray diffraction analysis can also confirm the sample's crystallinity by showing different peaks connected to different planes of reflection [12]. Apart from, the basic crystal size determination from diffraction peaks, empirical models have also been developed to predict the crystallite size based on peak broadening [13, 14]. Gonçalves et al. [15] used strain plot method for measuring the particle size strain and associated effects on NiO particles. Zak et al. [16] implemented Williamson–Hall (W-H), for the characterization of ZnO nanoparticles and reported that W-H method can also include micro strain effects in determining the crystallite size. Bindu and Thomas [17], Nath et al. [18] also reported that nanocrystals exhibit a built-in strain due to size captivity and should be considered in estimating the crystal size as it alters the optical and other properties. Modified forms of W-H, namely Method I (uniform deformation model UDM), Method II (Uniform stress deformation model-USDM), Method–III (uniform deformation energy-density model UDEDM) and the size-strain plot method (SSP) have also been considered to furnish stress-strain interactions and in estimating the elastic modulus. Holder and Schaak [19] reported that the information obtained from powder XRD is sometimes misapprehended, therefore microscopical correlation with XRD data sets is always preferable for the interpretation of results.
Since most of the literature on LHA was focused on preparation methods and its applications in thermal sciences [20, 21], this paper going to step forward on the critical examination of LHA nano crystallite size determination with multiple approaches in correlation with microstructural examination. Section 2 deals with preparation of LHA nano particle and related procedures along with XRD, FESEM experimental details whereas Section 3 interprets the XRD results with mathematical models. Finally, conclusions are drawn based on elaborated discussion.
2.1 Principle
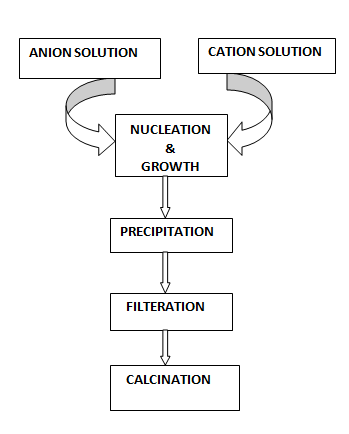
LHA powders were made ready by chemical precipitation and filtration technique. Chemical precipitation is one of the most popular techniques used to extract dissolved metals from solutions by promoting chemical reaction between the soluble metal compounds and the precipitating reagent which turn ionic metals into particles. However, a careful selection of elements is needed as such the efficiency of this process relies on many factors, including the concentration of ionic metals found in solution, the precipitant used, the solution's pH, and the presence of supporting elements [22]. The basic principle of chemical precipitation and filtration technique is shown in Figure 1.
Figure 1. Mechanism of chemical precipitation and filtration technique [23]
2.2 Materials
The current study is carried out with Alumina powder, Lanthanum oxide, Aluminium Nitrate, Ammonium carbonate, Citric acid. Lanthanum oxide was procured from Mincometsal Pvt. Limited, Bengaluru while high purity Alumina was supplied from Krish Met Tech Pvt. Limited, Chennai. Both, Lanthanum oxide and Alumina with an average particle size 50µm are considered in the present investigation. The supporting chemicals like Aluminium nitrate, Ammonium carbonate, Citric acid were purchased from National scientific products, Guntur.
2.3 Procedure
LHA nano particles are prepared according to the stoichiometric reactions mentioned by Sai et al. [24] in the previous work. 7.926 gms of Alumina powder was considered in a beaker along with distilled water. 0.05 wt % of citric acid is slowly added to form a stable solution. Citric acid was observed to be a good dispersant for alumina solutions [25]. This solution was ultrasonicated for 15 minutes to avoid the formulation of agglomerations. In another beaker, 0.467 gms lanthanum oxide powder and 0.54 gms of Nitric Acid is mixed in de-ionized water and stirred for 15 minutes and heated to form Lanthanum Nitrate solution. A weighed aluminum nitrate of 11.81 grams is put into beaker 2 and mixed with distilled water. Both solutions were mixed and the solution was reheated for 15 minutes followed by another 15minutes of ultra-sonication. 0.2 M Ammonium Carbonate Solution was applied drop by drop to the precipitation solution and filtering was then performed using Wattman 41 filter paper. The filter paper was allowed to dry overnight and powder of Al2O3-x LaAl11O18 is collected. The powder prepared with the meager facilities available is shown in Figure 2.
Figure 2. Prepared LHA nano particles
2.4 Characterization studies
Prepared LHA nano-powders are subjected to phase analysis using X-Ray Diffraction using MINIFLEX 300/600 (Rigaku, Japan Company) machine with a scan range of 3 to 90 degrees with a speed of 3 degrees per minute. The XRD analysis was done at Vignan University, Guntur. The profile peaks are analyzed using MATCH-3.10.0.167 Software. Particle size and composition analysis was carried out through FESEM attached with EDS (TESCAN-MIRA 3 LMH, 2014 coupled with QUANTAX 200 with XFlash BRUKER, 2014). The FESEM analysis was done at Centre for Nano and Soft Matter Sciences (CeNS), Bengaluru.
3.1 XRD analysis
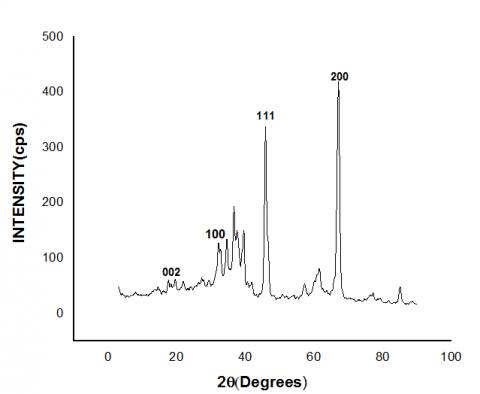
The XRD pattern of prepared LHA particles is shown in Figure 3. In XRD analysis, the peaks corresponding to Lanthanum Aluminate (AlLaO3), Lanthanum Hexa-aluminate (Al11.95La0.9O18.9) matched with JCPDS cards 31-0022 and 33-0699 and it was observed that hexagonal structure with magneto plumbite phase is formed which is confirmed with the literature [24]. The peak broadening of XRD pattern evidently shows the occurrence of small sized crystals in the samples. The sharp diffraction peaks are an indicative of good crystallinity of the prepared LHA particles.
Figure 3. XRD pattern of prepared powder
3.2 Crystallite size
Crystallite size and lattice strain are the two key components that can be derived from XRD peak profile analysis. Lattice strain of particles is generally occurred due to crystal imperfections such as dislocations of the lattice. For the estimation of crystallite size researchers implemented several methods such as Scherrer method (S-M Method), Williamson's Hall method (W-H Method) etc. [17, 18, 26]. However, the later technique considers the effect of intrinsic strains associated with the particle size obtained due to increment in XRD peak width. The characterization of these powders with Scherrer method, Modified Williamson's Hall methods, Size Strain Plot method are as follows.
3.2.1 S-M method
S-M method is an easy, effective, and popular technique to estimate the crystallite size from the peak broadening of XRD analysis [27]. The crystallite size is calculated from Full Width at Half Maximum (FWHM) of LHA peaks (0 0 2) (1 0 0) (1 1 1) and (2 2 0) corresponding to prepared powder. Debye Scherrer in 1918 reported that the widths of the diffraction lines are proportional to the size of the inverse crystallite. Therefore, an average crystallite size of the LHA particle is calculated using Eq. (1):
$D=\frac{K\lambda }{{{\beta }_{hkl}}\cos \theta }$ (1)
where, λ is the wave length of the incident X-ray (λ=0.1540 nm), K is a constant equal to 0.90, βhkl is the integral half width, D is the crystallite size in nm, and θ is the Bragg angle. From Figure 3, the LHA (1 0 0) diffraction peak seems to be much stronger than the LHA (2 2 0) peak. This indicates that the produced LHA nano crystals have a preferential crystallographic (1 0 0) orientation. At last, using S-M method the average crystallite size of LHA calculated as 90.07 nm.
3.2.2 W–H methods
Using XRD peak broadening Scherrer method gives preliminary information of crystallite size measurement. But it is lagging to give the information related to intrinsic lattice strains that get developed due to the crystal defects such as grain boundary, point defect, and stacking faults particularly in nano crystals [28, 29]. The strain may be occurred due to the lattice contraction that was associated in the measuring the lattice parameters. To accommodate this, many methods such as Warren-Averbach method, Williamson's Hall method, etc., may be implemented for the estimation of the core strain along with the particle size from the strain-induced peak broadening. Among these procedures, the W–H method is popular and can be applied to isotropic materials [30-32], while three modified W-H equations namely Method I, Method II and Method III was developed to measure average particle size and micro-strain of anisotropic materials.
(1) Method I
Method I consider uniform strain in the crystallographic path which is caused by crystal imperfections in the nano crystals. This model is proposed with an assumption that the crystal is isotropic and the properties to be measured are independent of the direction. Williamson and Hall mentioned that crystallite size and stress can affect the broadness of diffraction lines. However, UDM model of W–H method clearly differentiate size and strain parameters in the assessment of peak broadening with due importance to peak width as a function of 2θ [33]. The strain ‘ε’ in LHA nano powders due to crystal dislocation was calculated using the mathematical expression given below:
$\epsilon =\frac{{{\beta }_{hkl}}}{4\tan \theta }$ (2)
${{\beta }_{hkl}}={{\beta }_{D}}+{{\beta }_{e}}$ (3)
From Eq. (3) it can be observed that both crystallite size (βD) and strain contributions (βe)of the material will be reflected in the estimation of total peak broadening (βhkl).Therefore, the line breadth can be represented as the sum of Eq. (1) and (2):
${{\beta }_{hkl}}=\frac{\text{K}\lambda }{\text{D}\cos \theta }+4\tan \theta $ (4)
Multiplying the above equation with on both sides of equation:
${{\beta }_{hkl}}\cos {{\theta }_{hkl}}=\frac{K\lambda }{D}+4\varepsilon \sin {{\theta }_{hkl}}$ (5)
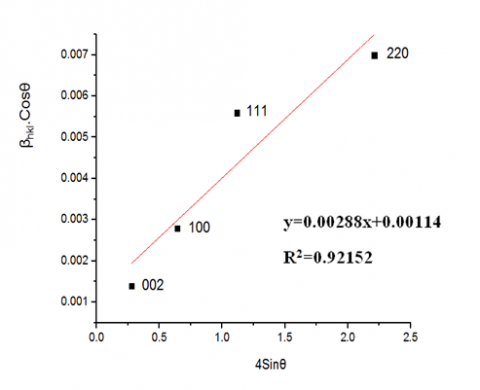
Eq. (5) is modified form of Williamson–Hall equation representing the uniform deformation model (UDM). The UDM plot for LHA particles is shown in Figure 4.
Figure 4. Plot of βhklcosθ versus 4sinθhkl
Figure 4 is plotted with the values of βhklcosθhkl on y-axis against the values 4sinθhkl on x-axis in the form of linear regression model. 0.921 R2 value represents the best fitted model. From the Y-intercept crystallite size D is measured whereas the micro - strain (ε) is acquired from the slope of the linear fit. Finally, the average crystallite size estimated for LHA powders using Method I was 97.6 nm.
(2) Method-II
In practical combination of both homogeneity and isotropy not be complied together. Therefore, an anisotropic approach is to adopted for incorporating more realistic situations. Therefore, anisotropic strain is also assimilated in W-H modified equations. In the Method-II, the stress is expected to remain constant in all the lattice directions and the particulate matter has a low micro-strain. The Hooke’s law is also valid in Method-II (USDM model) with a linear correlation between the stress and strain and is given by Stress, σ=εYhkl or ε=(σ/Yhkl). σ indicates the stress of the crystal while ε is anisotropic micro-strain, Yhkl is the modulus of elasticity. Thus, micro-strain relies on the crystallographic directions and Young’s modulus. The modified Williamson–Hall equation [27] model by substituting the value of ε in Eq. (5):
${{\beta }_{hkl}}\cos {{\theta }_{hkl}}=\frac{K\lambda }{\text{D}}+\frac{4\sigma \sin {{\theta }_{hkl}}}{{{Y}_{hkl}}}$ (6)
For a hexagonal crystal, lattice parameters based Young’s modulus is given by the following relation [13, 14]:
${{Y}_{hkl}}=\frac{{{\left[ {{h}^{2}}+\frac{{{(h+2k)}^{2}}}{3}+{{\left( \frac{al}{c} \right)}^{2}} \right]}^{2}}}{{{s}_{11}}{{\left( {{h}^{2}}+\frac{{{(h+2k)}^{2}}}{3} \right)}^{2}}+{{s}_{33}}{{\left( \frac{al}{c} \right)}^{4}}+\left( 2{{s}_{13}}+{{s}_{44}} \right)\left( {{h}^{2}}+\frac{{{(h+2k)}^{2}}}{3} \right){{\left( \frac{al}{c} \right)}^{2}}}$ (7)
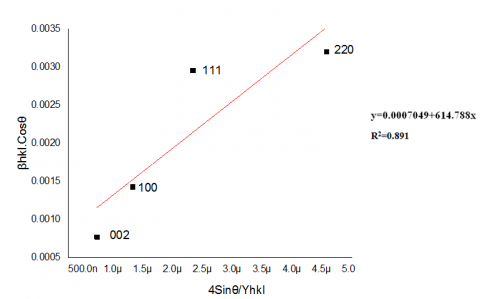
where, ‘a’ and ‘c’ are lattice parameters; s11, s13, s33 and s44 are the elastic compliances of LHA with values 0.215e11, –0.097e11, 0.345e11 and 0.88e12 m2 N-1 respectively [34]. By plotting a graph between βhklcosθhkl and 4sinθ/Yhkl, from the Y-intercept crystallite size D is measured whereas the uniform deformation stress σ is obtained from the slope of the linear fit. (Figure 5). The strain ε can be calculated based on Young’s modulus, Yhkl, of hexagonal LHA nanoparticles. The USDM model for LHA nanoparticles is shown in Figure 5.
Figure 5. Plot of βhklcosθ versus 4sinθ/Yhkl
R2 value of 0.891 gives a good correlation between the datasets and mathematical equation developed. The average crystallite size estimated for LHA powders using USDM was 100.46 nm. The Young’s modulus of LHA nano particles calculated from Eq. (7) is 298 GPa. The measured value is nearer to the LHA Young’s modulus as reported by Bogdanov et al. [33].
(3) Method-III
As mentioned in earlier sections 3.2.2.1 and 3.2.2.2 Method- I is more suitable for isotropic crystal while Method-II and Method-III can also handle the materials that are anisotropic in character. Similar to the earlier method, UDEDM also calculate the strain associated with the LHA hexagonal crystal structure due to inter-planar spacing with ample importance to energy density. When the strain energy density (ued) is involved the constants corresponding to stress–strain relation is no longer independent. Therefore, Method-III is a category of strain measurement technique from XRD peak profile analysis. The Strain energy density (Ued) is a function of strain is Ued=(ε2Yhkl)/2 in elastic systems that obeys Hooke’s law, Then, Eq. (6) can be restructured according to the energy and strain relation as [29]:
${{\beta }_{hkl}}\cos {{\theta }_{hkl}}=\left( \frac{K\lambda }{D} \right)+{{\left( 4\sin {{\theta }_{hkl}}{{\left( \frac{2{{u}_{ed}}}{{{Y}_{hkl}}} \right)}^{\frac{1}{2}}}\frac{2{{u}_{ed}}}{{{Y}_{hkl}}} \right)}^{\frac{1}{2}}}$ (8)
Figure 6. βhkl cosθ versus 4sinθhkl(2/Yhkl)1/2
A graph between βhkl cosθhkl vs 4sinθhkl (2/Yhkl)1/2 was shown in Figure 6. From the Y-intercept crystallite size D is measured whereas energy density Ued was calculated from slope of linear regression fit. The linear model has R2 value of 0. 961. The relation between stress, strain and Energy density can be represented as σ=(ε)(Yhkl) and Ued=0.5(ε2Yhkl). Therefore, stress σ was calculated using Eq. (9):
${{U}_{ed}}={{\sigma }^{2}}/2{{Y}_{hkl}}$ (9)
One can measure the lattice strain by knowing the Yhkl value. The average LHA crystallite size calculated from this model was100 nm.
3.2.3 Size–strain plot (SSP)
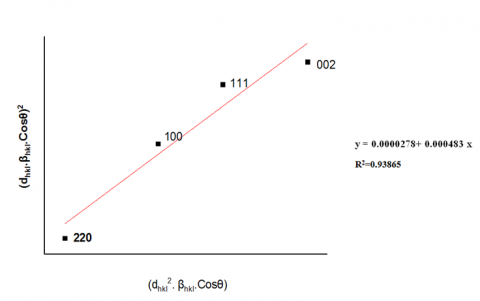
For both isotropic and anisotropic materials William hall plots describes the peak broadening due to microstrain contributions. However, using SSP method strain is estimated by considering associated parameters [29]. This approach has the advantage of paying less consideration to high-angle reflection data where accuracy is normally reduced. This method uses a Gaussian function to describe the "strain profile" and a Lorentzian function for "crystallite size" [30]. The crystallite size and strain can be calculated using Eq. (10):
${{\left( {{d}_{hkl}}{{\beta }_{hkl}}\cos {{\theta }_{hkl}} \right)}^{2}}=\frac{1}{{{V}_{s}}}\left( d_{hkl}^{2}{{\beta }_{hkl}}\cos {{\theta }_{hkl}} \right)+{{\left( \frac{{{\varepsilon }_{a}}}{2} \right)}^{2}}$ (10)
Figure 7. Plot of (dhklβhklcosθhkl)2 versus dhkl2βhklcosθhkl)
A graph between (dhkl βhkl cosθhkl)2 versus (dhkl2βhkl cosθhkl) was shown in Figure 7. The linear model has R2 value of 0.938 and the average crystallite size calculated for the prepared LHA powders was 100.46 nm.
3.3 Morphological studies
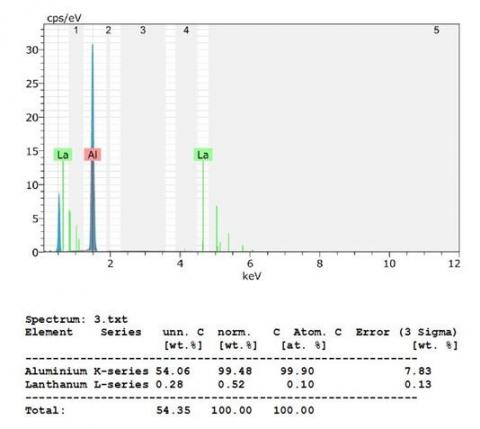
From Figure 8, it can be observed that the methodology adopted here is successful in producing the nano sized particles that are nearly the same in size and in shape. From FESEM analysis, spherical shaped LHA nanoparticles particles varied between 62 to 117 nm, with a mean particle size of 93.79 nm. The EDS analysis of the prepared powder was shown in Figure 9 and it was found from the sample mostly consists of aluminum and lanthanum indicating the main constituent elements of the process.
Figure 8. FESEM image of LHA particles
Figure 9. EDS analysis of prepared LHA nano particles
3.4 Comparison of Scherrer, W-H and SSP method and FESEM studies
The crystal size of LHA nano particles was measured using Scherrer’s equation, SSP and modified types of W–H models viz. Method-I, Method–II, Method–III while the lattice strain was determined through SSP and W–H models. The SSP approach is considered to be the most appropriate for estimating lattice strain compared to methods W–H while methods W-H has many variants and preferable for estimating crystalline size [35]. Among W-H methods, UDM considers the homogeneous isotropic nature of the crystal while USDM and UDEDM models are preferable for the crystallites with anisotropic nature. It was observed that the average crystallite size obtained from the above three methods are nearly similar and produced good accordance with the FESEM analysis findings (Table 1).
Table 1. Summary of crystallite size (D) and lattice strain (ε) calculated using different methods
|
Scherrer method |
D (nm) |
99.76 |
|
|
W-H method |
UDM |
D (nm) |
97.6 |
|
strain ε |
0.00249 |
||
|
USDM |
D (nm) |
100.46 |
|
|
strain ε |
0.00215 |
||
|
σ (N/m2) |
9.95E+07 |
||
|
Young’s Modulus (GPa) |
298 |
||
|
UDEDM |
D (nm) |
100 |
|
|
strain ε |
0.00215 |
||
|
Stress σ (N/m2) |
9.95E+07 |
||
|
Energy density Ued (KJm-3) |
1070 |
||
|
Size-Strain plot method |
D (nm) |
100.46 |
|
|
strain ε |
0.00215 |
||
|
FESEM |
D (nm) |
93.79 |
|
LHA nanoparticles with hexagonal crystal structure were prepared using chemical precipitation and filtration technique and these powders were characterized using powder XRD and FESEM with EDX. The peak broadening was analyzed by the S-M equation and modified forms of W– H models viz. UDM (Method–I), UDSM (Method–II) and UDEDM (Method–III). The lattice strains measured using W-H and SSP methods have been identified to be equivalent and accurate, and the crystallite size obtained through SSP method is in good accordance with the results estimated by W-H models and FESEM images. Incorporation of strain in different W–H models has a very less impact on average crystallite sizes of LHA nanoparticles. Furthermore, the difference in averaging particle distribution was due to a small deviation of the average crystallite size from Scherrer 's formula and W–H analysis. The FESEM pictures show that LHA nanoparticles had the same morphology with an average particle size of 93.79 nm. The results of both the techniques XRD and FESEM, given a less and acceptable deviation in measuring the crystallite size in the present case. Since LHA is an upcoming material and has plenty of scope in High-temperature applications and also in thermal barrier coatings, the preparation of LHA at the nano level with complete characterization studies can provide an exceptional significance at the industrial level.
The experimentation was supported by Research Centre, Department of Mechanical Engineering, R.V.R. & J.C. College of Engineering, Guntur and Centre for Nano and Soft Matter Sciences (CENS), Bengaluru.
|
Symbols |
|
|
D |
Crystallite size in nm |
|
σ |
Stress in N/m2 |
|
ε |
Strain |
|
λ |
Wave length of the incident X-ray in nm |
|
θ |
Bragg angle in Degrees |
|
$\beta_{D}$ |
crystallite size contribution |
|
$\beta_{e}$ |
crystallite strain contribution |
|
$\beta_{h k l}$ |
Total peak broadening |
|
$Y_{h k l}$ |
Young’s Modulus in Gpa |
|
Ued |
Energy density in KJ/m3 |
[1] Tian, M., Wang, X.D., Zhang, T. (2016). Hexaaluminates: A review of the structure, synthesis and catalytic performance. Catalysis Science & Technology, 6(7): 1984-2004. https://doi.org/10.1039/C5CY02077H
[2] Rao, R.R., Mariappan, L. (2005). Combustion synthesis and characterisation of lanthanum hexa-aluminate. Advances in Applied Ceramics, 104(5): 268-271. https://doi.org/10.1179/174367605X62427
[3] Gadow, R., Lischka, M. (2002). Lanthanum hexaaluminate-Novel thermal barrier coatings for gas turbine applications-Materials and process development. Surface and Coatings Technology, 151: 392-399. https://doi.org/10.1016/S0257-8972(01)01642-5
[4] Zhu, R.X., Liu, Z.G., Ouyang, J.H., Zhou, Y. (2013). Preparation and characterization of LnMgAl11O19 (Ln=La, Nd, Gd) ceramic powders. Ceramics International, 39(8): 8841-8846. https://doi.org/10.1016/j.ceramint.2013.04.073
[5] Pomeroy, M.J. (2005). Coatings for gas turbine materials and long term stability issues. Materials & Design, 26(3): 223-231. https://doi.org/10.1016/j.matdes.2004.02.005
[6] Belmonte, M. (2006). Advanced ceramic materials for high temperature applications. Advanced Engineering Materials, 8(8): 693-703. https://doi.org/10.1002/adem.200500269
[7] He, M., Meng, H., Wang, Y., Ren, P. (2018). Synthesis mechanism and preparation of LaMgAl11O19 powder for plasma spraying. Materials Research Express, 5(6): 065021. https://doi.org/10.1088/2053-1591/aac800
[8] Kalyanaraman, R., Yoo, S., Krupashankara, M.S., Sudarshan, T.S., Dowding, R.J. (1998). Synthesis and consolidation of iron nanopowders. Nanostructured Materials, 10(8): 1379-1392. https://doi.org/10.1016/S0965-9773(99)00017-3
[9] Nguyen-Tri, P., Nguyen, T.A., Carriere, P., Ngo Xuan, C. (2018). Nanocomposite coatings: Preparation, characterization, properties, and applications. International Journal of Corrosion, 2018: 4749501. https://doi.org/10.1155/2018/4749501
[10] Kim, G.E., Brochu, M. (2015). Thermal spray nanostructured ceramic and metal-matrix composite coatings. In Anti-Abrasive Nanocoatings, pp. 481-511. https://doi.org/10.1016/B978-0-85709-211-3.00019-4
[11] Misturea, S.T., Snyderb, R.L. (2001). X-ray diffraction. Encyclopedia of Materials: Science and technology (Second Edition), pp. 9799-9808. https://doi.org/10.1016/B0-08-043152-6/01778-2
[12] Guinier, A. (1994). X-ray diffraction in crystals, imperfect crystals, and amorphous bodies. Courier Corporation. https://doi.org/10.1021/ed041p292.2
[13] Halder, N.C., Wagner, C.N.J. (1966). Analysis of the broadening of powder pattern peaks using variance, integral breadth, and Fourier coefficients of the line profile. In Advances in X-ray Analysis, Springer, Boston, MA., pp. 91-102. https://doi.org/10.1007/978-1-4684-7633-0_8
[14] Speakman, S.A. (2014). Estimating crystallite size using XRD. MIT Center for Materials Science and Engineering, 3-8. http://prism.mit.edu/xray/
[15] Gonçalves, N.S., Carvalho, J.A., Lima, Z.M., Sasaki, J.M. (2012). Size–strain study of NiO nanoparticles by X-ray powder diffraction line broadening. Materials Letters, 72: 36-38. https://doi.org/10.1016/j.matlet.2011.12.046
[16] Zak, A.K., Majid, W.A., Abrishami, M.E., Yousefi, R. (2011). X-ray analysis of ZnO nanoparticles by Williamson–Hall and size-strain plot methods. Solid State Sciences, 13(1): 251-256. https://doi.org/10.1016/j.solidstatesciences.2010.11.024
[17] Bindu, P., Thomas, S. (2014). Estimation of lattice strain in ZnO nanoparticles: X-ray peak profile analysis. Journal of Theoretical and Applied Physics, 8(4): 123-134. https://doi.org/10.1007/s40094-014-0141-9
[18] Nath, D., Singh, F., Das, R. (2020). X-ray diffraction analysis by Williamson-Hall, Halder-Wagner and size-strain plot methods of CdSe nanoparticles-a comparative study. Materials Chemistry and Physics, 239: 122021. https://doi.org/10.1016/j.matchemphys.2019.122021
[19] Holder, C.F., Schaak, R.E. (2019). Tutorial on powder X-ray diffraction for characterizing nanoscale materials. American Chemical Society, 13(7): 7359-7365. https://doi.org/10.1021/acsnano.9b05157
[20] Ropp, R.C., Carroll, B. (1980). Solid‐state kinetics of LaAl11O18. Journal of the American CeramicSociety, 63(7‐8): 416-419. https://doi.org/10.1111/j.1151-2916.1980.tb10203.x
[21] Salavati-Niasari, M., Hosseinzadeh, G., Davar, F. (2011). Synthesis of lanthanum carbonate nanoparticles via sonochemical method for preparation of lanthanum hydroxide and lanthanum oxide nanoparticles. Journal of Alloys and Compounds, 509(1): 134-140. https://doi.org/10.1016/j.jallcom.2010.09.006
[22] Liu, Y., Gao, L., Guo, J. (2001). Comparative study on the stabilizing effect of 2-phosphonobutane-1, 2, 4-tricarboxylic acid and citric acid for alumina suspensions. Colloids and Surfaces A: Physicochemical and Engineering Aspects, 193(1-3): 187-195. https://doi.org/10.1016/S0927-7757(01)00749-X
[23] Ali, J., Irshad, R., Li, B., Tahir, K., Ahmad, A., Shakeel, M., Khan, N.U., Khan, Z.U.H. (2018). Synthesis and characterization of phytochemical fabricated zinc oxide nanoparticles with enhanced antibacterial and catalytic applications. Journal of Photochemistry and Photobiology B: Biology, 183: 349-356. https://doi.org/10.1016/j.jphotobiol.2018.05.006
[24] Sai Ram, Y.N.V., Tarasasanka, C., Prabakaran, J. (2020). Preparation and characterization of lanthanum hexa aluminate powders for high temperature applications. Materials Today: Proceedings. https://doi.org/10.1016/j.matpr.2020.05.368
[25] Hidber, P.C., Graule, T.J., Gauckler, L.J. (1996). Citric acid-A dispersant for aqueous alumina suspensions. Journal of the American Ceramic Society, 79(7): 857-1867. https://doi.org/10.1111/j.1151-2916.1996.tb08006.x.
[26] Prabhu, Y.T., Rao, K.V., Kumar, V.S.S., Kumari, B.S. (2014). X-ray analysis by Williamson-Hall and size-strain plot methods of ZnO nanoparticles with fuel variation. World Journal of Nano Science and Engineering, 4(1): 21-28. https:///doi.org/10.4236/wjnse.2014.41004
[27] Ingham, B., Toney, M.F. (2014). 1-X-ray diffraction for characterizing metallic films. In Metallic Films for Electronic, Optical and Magnetic Applications, pp. 3-38. https://doi.org/10.1533/9780857096296.1.3
[28] Das, R., Sarkar, S. (2015). Determination of intrinsic strain in poly (vinylpyrrolidone)-capped silver nano-hexapod using X-ray diffraction technique. Current Science, 109(4): 775-778.
[29] Balzar, D., Ledbetter, H. (1993). Voigt-function modeling in Fourier analysis of size-and strain-broadened X-ray diffraction peaks. Journal of Applied Crystallography, 26(1): 97-103. https://doi.org/10.1107/S0021889892008987
[30] Warren, B.E., Averbach, B.L. (1952). The separation of cold‐work distortion and particle size broadening in X‐ray patterns. Journal of Applied Physics, 23(4): 497-497. https://doi.org/10.1063/1.1702234
[31] Jacob, R., Isac, J. (2015). X-ray diffraction line profile analysis of BaSr0.6Fe0.4TiO3 [BSFTO]. Int. J. Chem. Studies, 2(5): 12-21.
[32] Izumi, F., Ikeda, T. (2015). Implementation of the Williamson-Hall and Halder-Wagner methods into RIETAN-FP.
[33] Bogdanov, S.V., Zubrinov, I.I., Pestryakov, E.V., Petrov, V.V., Semenov, V.I., Alimpiev, A.I. (2001). Elastic properties of beryllium-lantanum hexaaluminate crystal, BeLaAl11O19. Crystallography Reports, 46(3): 450-455. https://doi.org/10.1134/1.1376476
[34] Dorset, D.L. (1998). X-ray diffraction: A practical approach. Microscopy and Microanalysis, 4(5): 513-515. http://dx.doi.org/10.1007/978-1-4899-0148-4
[35] Hall, W.H. (1949). X-ray line broadening in metals. Proceedings of the Physical Society. Section A, 62(11): 741. https://iopscience.iop.org/journal/0370-1298.