Ji Li | Shaoqing Shi* | Qiulin He | Shou Chen
OPEN ACCESS
The fabrication and optimization of the shelter layer are critical to the performance of the protective works. The novel shelter layer made of steel fiber-reinforced high-strength concrete (SFRHSC) is much more advantageous than that of ordinary concrete. This paper carries out a split-Hopkinson pressure bar (SHPB) test on the steel fiber and high-strength concrete, two main components of the SFRHSC, aiming to disclose the failure features and dynamic compressive strength of the SFRHSC under dynamic conditions. Specifically, the SFRHSC specimens with 0 %, 0.5 % and 1.0 % of steel fiber were subjected to impact compression test under the air pressures of 0.7, 0.9 and 1.0MPa, respectively. In addition, the impact compression process was also numerically simulated on the finite-element software LS-DYNA. The research results show that: the increase in strain rate pushed up the dynamic compressive strength of the SFRHSC, that is, the failure degree of the specimen was greatly enhanced by the strain rate; under the air pressure of 0.7MPa, the specimen with 1.0 % of steel fiber had the highest dynamic compressive strength (180.9MPa), 22.6 % higher than that of the specimen with no steel fiber; the numerical simulation reproduced the one-dimensional (1D) propagation of the stress wave in the bars, which proves the hypothesis of 1D elastic stress wave, and restaged the impact compression process on the SFRHSC, outputting results similar to the test data.
steel fiber-reinforced high-strength concrete (SFRHSC), impact compression, strain rate effect, numerical simulation
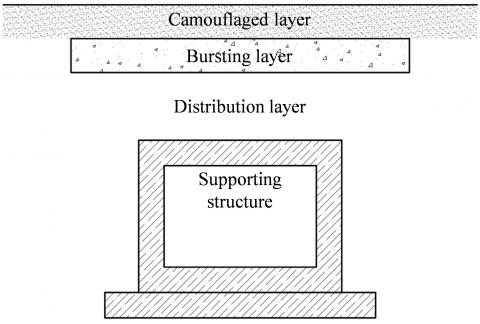
Protective works provide a credible defense against conventional weapons [1]. As shown in Figure 1, protective works typically consists of a camouflage layer, a shelter layer, a distribution layer and a support structure [2]. Among them, the shelter layer is the main contributor to the strike-resistance of protective works. Concrete is the most popular material of shelter layer in existing protective works, followed by block stones [3-4]. To further enhance the strike-resistance of protective works, the high-strength steel fiber-reinforced concrete (SFRHSC) shelter layer has been developed, in the light of material strength and composition in shelter layer. Obviously, the SFRHSC is the key to the performance of this novel shelter layer.
Figure 1. The typical structure of protective works
As its name suggests, the SFRHSC is prepared by adding steel fibers into high-strength concrete. The addition mainly aims to lower the brittleness of high-strength concrete. Despite its strong resistance to compression and deformation, high-strength concrete becomes increasingly brittle as its strength grows. Under the ultimate load, the concrete may suddenly burst due to the high brittleness. After being reinforced by steel fibers, the high-strength concrete will have better strength, toughness and crack-resistance, and much lower brittleness [5]. In terms of material strength, the SFRHSC shelter layer enjoys a clear advantage over ordinary concrete shelter layer, making it a desirable tool to prevent penetration and impact in dynamical engineering.
The split-Hopkinson pressure bar (SHPB) is a test system for studying the dynamic mechanics of materials or components. The system provides a strain rate in the range of 101~102s-1 [6]. To disclose the dynamic mechanics of concrete-filled steel tube (CFST), Zheng [7] conducted an impact compression test on a 50mm-diameter CFST on a 74 mm SHPB system, and learned that the sudden brittle failure of the CFST was transformed to plastic failure under dynamic conditions. Huang [8] explored the dynamic tensile strength and strain rate effect of C75 concrete using a large-diameter SHPB system, and numerically simulated the dynamic splitting failure of the concrete using LS-DYNA. The results show that: the splitting strength of the concrete grew linearly with the logarithm of strain rate, when the strain rate fell between 100 ~ 101 s-1; the Cowper-Symonds viscoplastic constitutive model, which considers the strain rate effect, could characterize the dynamic mechanics of C75 concrete excellently, as evidenced by the agreement between simulated results and test data. With the aid of a 74 mm SHPB system, Chen [9] tested the impact compression of polypropylene fiber-reinforced concretes (PFRCs) in different sizes, and compared the dynamic compressive strength, deformation and failure features of concretes with varied fiber contents under five different strain rates. The test results show that: with the increase in strain rate, the dynamic compressive strength and deformation of the PFRCs exhibited an obvious strain rate effect; under the same strain rate, the dynamic compressive strength increased with the fiber content.
This paper carries out an SHPB test and a numerical simulation on the dynamic mechanics of the SFRHSC. On this basis, the author identified the dynamic deformation features of the SFRHSC, examined the dynamic compressive strength of the SFRHSC under different strain rates, and analyzed the feasibility of the material composition of the concrete. The research findings provide insights into the dynamic mechanics of the novel shelter layer.
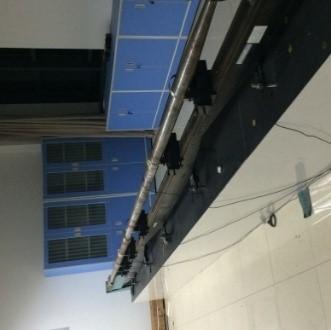
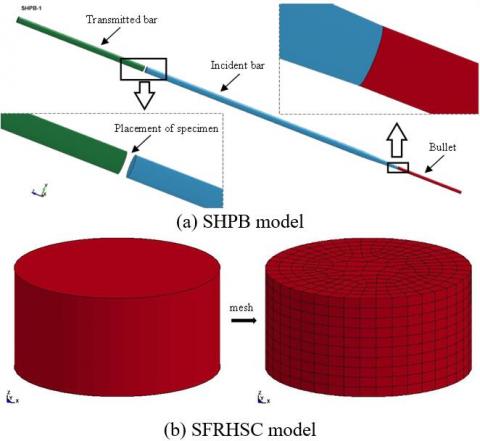
Our test was conducted in an impact compression test chamber, using a 74 mm straight-taper variable cross-section SHPB system. The sketch map and site map of the SHPB system are shown in Figures 2 and 3, respectively.
Figure 2. The sketch map of the SHPB system
Figure 3. The site map of the SHPB system
The SHPB test must satisfy the following two hypotheses, which lay the basis for the establishment and derivation of the test principle.
(1) The hypothesis of one-dimensional (1D) elastic stress wave: The stress wave is assumed to propagate in one dimension; the strain of the entire bar can be represented by the strain measured by the gauge attached to the bar; the deformation of the specimen and both bars approximately satisfy the 1D stress state [10].
(2) The hypothesis of stress uniformity: The mean stress of the specimen can be derived from the mean stress and strain of the interfaces between the specimen and the end of each bar (specimen-bar interfaces); the mean stress and strain cannot represent the actual values unless the specimen stress is uniformly distributed [11].
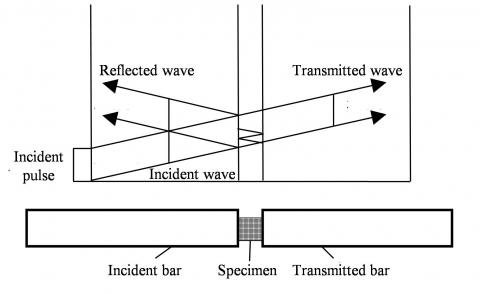
During our test, a bullet was fired and contacted the incident bar at a certain velocity, producing an incident wave εi in that bar. Once the incident wave propagates to the specimen, the specimen fails under impact compression, generating a reflected wave εr and a transmitted wave εt. The latter will propagate to the transmitted bar. The stress wave propagation is illustrated in Figure 4 below.
Figure 4. Stress wave propagation between specimen and bars
It is assumed that the SHPB bars have the same cross-sectional area and are made of the same, homogeneous material [12]. Let Ay and Ey be the cross-sectional area and elastic modulus of bars, respectively, Cy be the velocity of stress pulse wave, and As and ls be the cross-sectional area and length of the specimen, respectively.
In the light of the 1D elastic stress wave hypothesis, the displacement μ at any position in a bar can be expressed as:
$\mu \text{=}{{C}_{\text{y}}}\int_{0}^{t}{\varepsilon \cdot dt}$ (1)
where ε is the strain; t is the stress pulse action time.
According to formula (1), the displacement of specimen-incident bar interface can be described as:
${{\mu }_{\text{i}}}={{C}_{\text{y}}}\int_{0}^{t}{{{\varepsilon }_{\text{i}}}\cdot dt}-{{C}_{\text{y}}}\int_{0}^{t}{{{\varepsilon }_{\text{r}}}\cdot dt}={{C}_{\text{y}}}\int_{0}^{t}{\left( {{\varepsilon }_{\text{i}}}-{{\varepsilon }_{\text{r}}} \right)dt}$ (2)
Similarly, the displacement of specimen-transmitted bar interface can be described as:
${{\mu }_{\text{t}}}\text{=}{{C}_{\text{y}}}\int_{0}^{t}{{{\varepsilon }_{\text{t}}}\cdot dt}$ (3)
The mean strain εs of the specimen can be expressed as:
${{\varepsilon }_{\text{s}}}\text{=}\left( {{\mu }_{\text{i}}}-{{\mu }_{\text{t}}} \right)/{{l}_{\text{s}}}$ (4)
The following can be derived from formulas (2) and (3):
${{\varepsilon }_{\text{s}}}\text{=}\frac{{{C}_{\text{y}}}}{{{l}_{\text{s}}}}\int_{0}^{t}{\left( {{\varepsilon }_{\text{i}}}-{{\varepsilon }_{\text{r}}}-{{\varepsilon }_{\text{t}}} \right)dt}$ (5)
Taking the derivative of εs in formula (5), the mean strain rate ${{\dot{\varepsilon }}_{\text{s}}}$ of the specimen can be obtained as:
${{\dot{\varepsilon }}_{\text{s}}}\text{=}\frac{{{C}_{\text{y}}}}{{{l}_{\text{s}}}}\left( {{\varepsilon }_{\text{i}}}-{{\varepsilon }_{\text{r}}}-{{\varepsilon }_{\text{t}}} \right)$ (6)
In the light of the hypothesis of 1D elastic stress wave, the pressure on specimen-bar interfaces can be expressed as:
${{F}_{\text{s}1}}\text{=}{{E}_{\text{y}}}\left( {{\varepsilon }_{\text{i}}}\text{+}{{\varepsilon }_{\text{r}}} \right){{A}_{\text{y}}}{{F}_{\text{s2}}}\text{=}{{E}_{\text{y}}}{{\varepsilon }_{\text{t}}}{{A}_{\text{y}}}$ (7)
where Fs1 is the pressure on specimen-incident bar interface; Fs2 is the pressure on the specimen-transmitted bar interface.
The mean stress σs of the specimen can be expressed as:
${{\sigma }_{\text{s}}}\text{=}\frac{{{F}_{\text{s}1}}\text{+}{{F}_{\text{s}2}}}{2{{A}_{\text{s}}}}\text{=}\frac{{{E}_{\text{y}}}{{A}_{\text{y}}}}{2{{A}_{\text{s}}}}\left( {{\varepsilon }_{\text{i}}}\text{+}{{\varepsilon }_{\text{r}}}\text{+}{{\varepsilon }_{\text{t}}} \right)$ (8)
In formulas (5), (6) and (8), the mean strain, mean strain rate and mean stress of the specimen were computed using the incident wave εi, reflected wave εr, and transmitted wave εt, respectively.
According to the SHPB test principle, the test results are valid only if the specimen satisfy the dynamic stress equilibrium. To quantify the stress equilibrium, the stress equilibrium factor η can be defined as:
$\eta \text{=}\frac{2\left( {{\sigma }_{\text{i}}}\text{+}{{\sigma }_{\text{r}}}-{{\sigma }_{\text{t}}} \right)}{{{\sigma }_{\text{i}}}\text{+}{{\sigma }_{\text{r}}}\text{+}{{\sigma }_{\text{t}}}}$ (9)
where σi, σr and σt are the incident stress, reflected stress and transmitted stress, respectively. When the stress equilibrium factor approaches zero, the stresses on the two ends of the specimen reach the ideal force/stress equilibrium state.
4.1 Interface friction effect
After the bullet is fired, the ensuing stress wave causes the incident bar, the specimen and the transmitted bar to move axially in the direction of impact. Due to the disturbance of the wave propagation, relative lateral motions occur across the specimen-bar interfaces, creating the friction effect. The friction effect disturbs the normal propagation of stress wave, affects the 1D elastic stress state, and consumes some energy of impact compression, thereby reducing the test accuracy [13-15].
Klepczko proposed a simple equation to describe the friction effect;
$\sigma \text{=}{{\sigma }_{0}}\left( 1\text{-}\frac{2\mu r}{3l} \right)$ (10)
where σ is the stress calculated considering the friction effect; σ0 is the stress measured in test; μ is the friction coefficient of specimen-bar interfaces; r/l is dimeter-length ratio of the specimen. In our test, the r/l of the specimens always equals 2.
Normally, the interface friction effect is negligible if 1-2μr/3l≥0. Since r/l=2, the friction coefficient must be smaller than or equal to 0.75 to satisfy the test requirements. To reduce the impact of the friction coefficient, Vaseline was applied evenly on the interfaces to control μ between 0.02 and 0.06. In this way, the friction coefficient meets the test requirements, and the friction effect can be neglected [16].
4.2 Stress wave dispersion effect
The stress wave propagating in the SHPB is a linear elastic wave. With a certain spectral distribution, the stress wave contains harmonic components of varied frequencies. The low-frequency waves propagate faster than high-frequency ones. Thus, the different harmonic components in the stress wave differ in velocity. During the propagation, the stress wave is continuously dispersed, forming the stress wave dispersion effect [17, 18]. For the SHPB test, the ideal waveform of the incident wave is rectangular. Under the stress wave dispersion effect, however, the high-frequency components of the incident wave are slower than the low-frequency components, and gradually fall behind the wave head. Owing to the dispersion of the incident wave in the bars, the actual waveform takes the trapezoid shape (Figure 5).
Figure 5. The ideal waveform and the waveform measured in the SHPB test
The SFRHSC for the impact compression test and numerical simulation was prepared using self-developed mix ratios and the preparation and pouring techniques for self-compacting concrete. The prepared concrete was subjected to a static test, revealing that the compressive strength of SFRHSC with steel fiber contents of 0%, 0.5% and 1% was respectively 73.6 MPa, 89.9 MPa and 96.2 MPa. The technical parameters of the steel fibers are listed in Table 1 below.
Table 1. The technical parameters of the steel fibers
|
Length/mm |
Diameter/mm |
Aspect ratio |
Compressive strength/MPa |
Shape |
Appearance |
|
14 |
0.23 |
60 |
3,000 |
Straight |
Bright and clean |
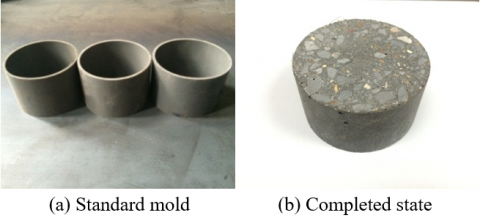
The SFRHSC was cut into the required shape with a standard mold, i.e. polyvinyl chloride (PVC) tubes with a circular cross-section (Figure 6a). Each PVC tube is 35 mm in length, 70 mm in inner diameter, and 0.5 in aspect ratio. The specimens were obtained by cutting the SFRHSC within the PVC tube in the longitudinal direction.
The next step is to ensure uniform distribution of stress in each specimen and minimize the interface friction effect. For this purpose, each specimen was polished until the upper and lower surfaces are sufficiently smooth (flatness≤0.05 mm) (Figure 6b).
Figure 6. Standard mold and completed state of specimens
To clearly depict the failure of the SFRHSC through impact compression, the dynamic finite-element analysis software LS-DYNA was adopted for numerical simulation. The simulated results were compared with the SHPB test data, aiming to confirm whether the simulation method is feasible.
Figure 7. Numerical simulation models
As shown in Figure 7, the SHPB system and the specimen were modelled in full scale, using the SOLID 164 units. The model was meshed by the 3D Lagrangian method. The interfaces between the bullet and the incident bar and the two specimen-bar interfaces were defined as CONTACT_ AUTOMATIC_SINGLE_SURFACEs. The bars were simulated by MAT_ELASTIC linear elastic model. The main parameters of the model include: density ρ=7.8 g/cm3, Poisson’s ratio μ=0.25 and elastic modulus E=2.2×10⁵ MPa. The SFRHSC was simulated by the Johnson-Holmquist-Cook (JHC) model, which considers high hydrostatic pressure, high strain rate and material damage effect. The main parameters of the model are as follows. When the steel fiber content is 0 %, density ρ=2.44 g/cm3, shear modulus G=26.9 GPa and compressive strength Fc=73.6 MPa; When the steel fiber content is 0.5 %, density ρ=2.46 g/cm3, shear modulus G=29.7 GPa and compressive strength Fc=89.9 MPa; When the steel fiber content is 1.0 %, density ρ=2.48 g/cm3, shear modulus G=34.5 GPa and compressive strength Fc=96.2 MPa; When the steel fiber content is 1.5%, density ρ=2.50 g/cm3, shear modulus G=38.6 GPa and compressive strength Fc=100.5 Mpa.
7.1 Comparison of test phenomena
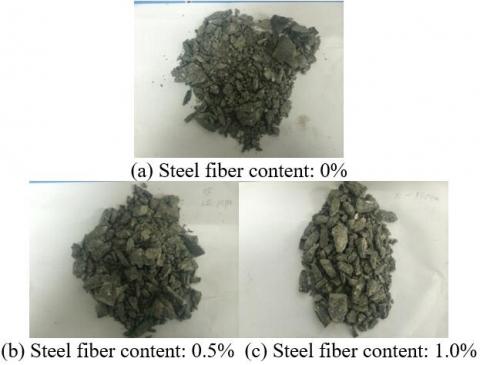
Figure 8. The failure modes of specimens with different steel fiber contents under the air pressure of 1.0 Mpa
As shown in Figure 8, under the high air pressure (1.0 MPa), all SFRHSC specimens suffered great damages under impact, whichever the steel fiber content. The specimen with zero steel fiber was crushed into granular powders. With the increase in steel fiber content, the failure mode changed from scattered granular powders to scattered concrete blocks. The test phenomena indicate that: under a high air pressure, the SFRHSC with zero steel fiber was damaged more seriously and maintained weaker integrity than any other specimen; the failure mode of the specimen improved with addition of steel fibers and the increase in fiber content; the failure was much less serious when the steel fiber content increased to 1.0 %.
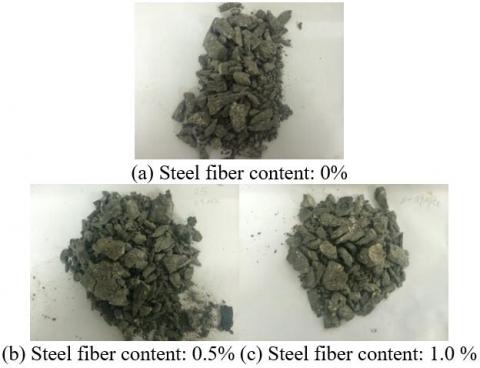
Figure 9. The failure modes of specimens with different steel fiber contents under the air pressure of 0.9MPa
As shown in Figure 9, the air pressure of 0.9 MPa also resulted in high strain rates of SFRHSC specimens, similar to the air pressure of 1.0MPa. Therefore, the failure modes of specimens with different steel fiber contents were similar to those in Figure 8. It is observed that, when the air pressure dropped from 1.0 MPa to 0.9 MPa (i.e. the strain rate declined), the SFRHSC with zero steel fiber was not pulverized, but was still damaged more seriously than any other specimen; with the growth in steel fiber content, the steel fibers held the concrete together. That is why the specimens with a high fiber content were crushed into large concrete blocks.
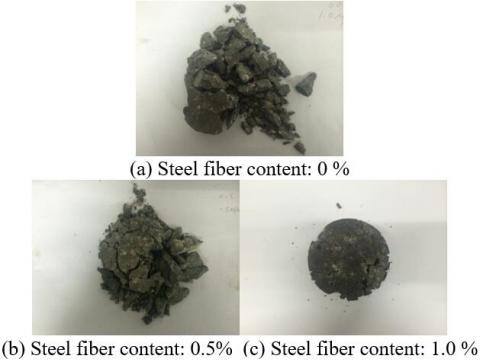
Figure 10. The failure modes of specimens with different steel fiber contents under the air pressure of 0.7 MPa
As shown in Figure 10, the strain rates of the specimens plunged as the air pressure dropped from 1.0 MPa, 0.9 MPa to 0.7 MPa. Whichever the steel fiber content, all specimens saw a great improvement in their failure modes and maintained relatively good integrity. The higher the fiber content, the better the integrity of the concrete. This is because the steel fibers increase the toughness of concrete and enhance the connections between different parts. As a result, the addition of steel fibers helps to pull back the cracked concrete, and suppress the crack propagation. When the fiber content was 1.0%, the specimen only suffered from concrete shedding and cracking on the edges, and could still withstand repeated impact and compression. The results show that, under a low air pressure, the SFRHSC specimen with a high fiber content boasts excellent failure features under dynamic load, and fully displays the advantage of material strength and composition.
The test phenomena in Figures 8-10 were compared to disclose the deformation features of specimens with the same fiber content under different air pressures (i.e. different strain rates). It is observed that, the specimen was damaged more severely with the growth in strain rate; the higher the strainer rate, the smaller the concrete particles and the poorer the specimen integrity. Thus, the strain rate can greatly enhance the failure degree of the specimen.
7.2 Energy absorption of the SFRHSC
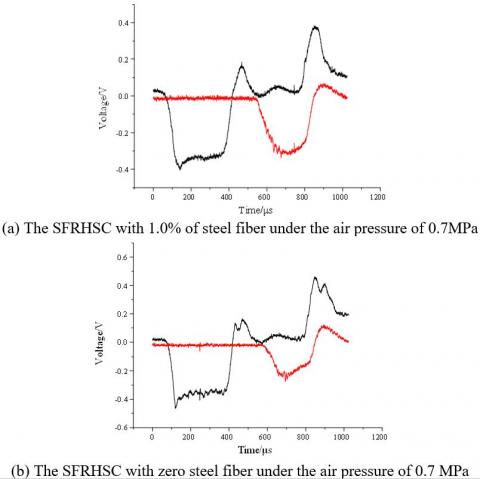
The SFRHSC with 1.0 % of steel fiber was tested under the air pressure of 0.7 MPa. The test results were plotted as the stress waveform in Figure 11a. The initial part of the stress waveform belongs to the incident wave. In the initial phase of stress wave propagation, the area under the curve (AUC) represents the total impact energy of the bullet. After the specimen was damaged, the residual impact energy was transferred to the transmitted bar or reflected to the incident bar in the form of stress wave [19], creating the transmitted wave and the reflected wave. Most of the residual impact energy is represented by the AUC of the transmitted wave. Under impact compression, much energy was transmitted due to the high strength and stiffness of the specimen, which contributes to the large AUC of the transmitted wave. As a result, the specimen was not seriously damaged. This echoes with the test phenomena in Figure 8c.
The SFRHSC with zero steel fiber was also tested under the air pressure of 0.7MPa. The test results in Figure 11b demonstrate that, the transmitted wave had a much smaller AUC than the incident wave. Hence, the specimen absorbed lots of energy and deformed seriously, which are consistent with the phenomena in Figure 8(a).
Figure 11. Stress waveforms under impact compression
7.3 Analysis on dynamic response data
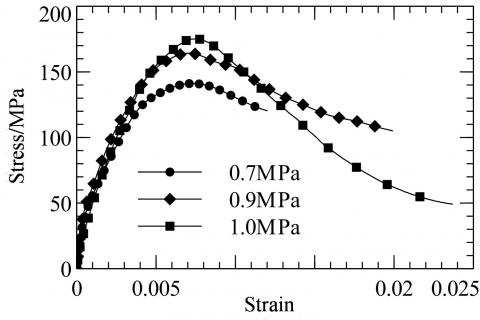
From Figures 12 and 13, it can be seen that the SFRHSC’s stress-strain curve under dynamic conditions was similar to that under static conditions. The initial segments of both curves were rising. The stress reached the peak and then dropped rapidly, indicating that the specimen lost the bearing capacity. Throughout the loading process, no obvious fluctuation but a peak point appeared on each curve. The results show that the waveform dispersion had little impact on the curve development, due to the rapid failure of the SFRHSC and the short action time of the loading pulse.
For the specimens with the same fiber content, the growth in air pressure pushed up the strain rate, which in turn increased the dynamic compressive strength and the peak strain of the specimen. The failure degree of the specimen was greatly enhanced by the strain rate.
Figure 12. Stress-strain curves of the specimen with 0.5 % steel fiber under different air pressures
Figure 13. Stress-strain curves of specimens with different fiber contents under the air pressure of 1.0 MPa
Table 2 lists the dynamic compressive strengths and peak strains of 9 groups of specimens with different fiber contents. Under the air pressure of 0.7 MPa, the specimen with zero steel fiber had a compressive strength of 133.4 MPa, 5.8 % lower than that with 0.5 % of steel fiber, and 22.6 % lower than that with 1.0 % of steel fiber. Under the air pressure of 0.9 MPa, the specimen with zero steel fiber had a compressive strength of 158.5 MPa, 3.6 % lower than that with 0.5 % of steel fiber, and 11.7 % lower than that with 1.0% of steel fiber. Under the air pressure of 1.0 MPa, the specimen with zero steel fiber had a compressive strength of 173.9 MPa, 0.7 % lower than that with 0.5 % of steel fiber, and 4.0% lower than that with 1.0 % of steel fiber.
Table 2. SHPB test data of specimens
|
Steel fiber content/% |
Air pressure/MPa |
Dynamic compressive strength/MPa |
Peak strain |
|
0 |
0.7 |
133.4 |
0.00705 |
|
0 |
0.9 |
158.5 |
0.00723 |
|
0 |
1.0 |
173.9 |
0.00738 |
|
0.5 |
0.7 |
141.2 |
0.00702 |
|
0.5 |
0.9 |
164.3 |
0.00729 |
|
0.5 |
1.0 |
175.2 |
0.00746 |
|
1.0 |
0.7 |
163.6 |
0.00576 |
|
1.0 |
0.9 |
177.1 |
0.00714 |
|
1.0 |
1.0 |
180.9 |
0.00733 |
The above data show that the dynamic mechanics of the specimens can be greatly improved by optimizing the material composition (i.e. adding steel fibers). The improvement was particularly obvious under a low air pressure (0.7 MPa), where the specimen with 1.0 % of steel fiber had the highest dynamic compressive strength (180.9 MPa), 22.6 % higher than that of the specimen with no steel fiber. This reflects the high strength of the SFRHSC under dynamic conditions.
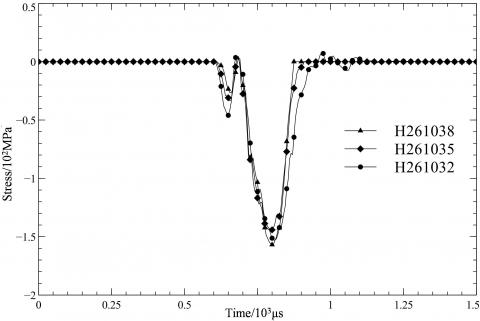
Three nonadjacent units H261038, H261035 and H261032 were selected from the specimen model to verify the hypothesis on stress uniformity (Figure 14). The time-history curves of the three units in the Z-direction, i.e. the direction of impact compression, were plotted as Figure 15. It can be seen that the stress curves of the three units were close to each other throughout the simulation with little deviations. Thus, our numerical simulation satisfies the hypothesis of stress uniformity.
Figure 14. Three non-adjacent units of the specimen
Figure 15. Time-history curves of the stress in the z-direction of the non-adjacent units
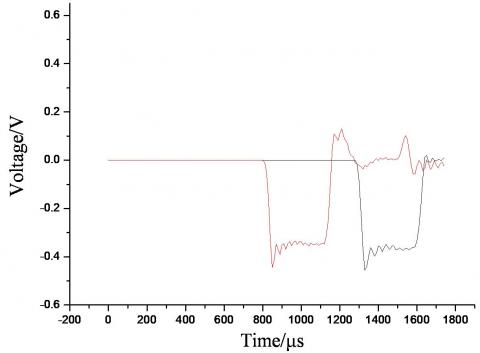
The specimen was removed to perform the blank test and blank simulation. The measured and simulated waveforms are presented in Figures 16 and 17, respectively. It can be seen that the blank test achieved the desired effect, as the stress wave propagated from the incident bar to the transmitted bar without any loss. The measured waveform agrees well with the simulated waveform, showing similar trends. In both figures, the gentle segments of the stress waves oscillated in the same region, and the time-history intervals of the stress waves were both 250 μs. The comparison confirmed the feasibility of the simulation method.
Figures 18 and 19 display the stress waveforms obtained through impact compression test and numerical simulation of the SFRHSC. It can be observed that: During the test, the specimen was damaged under impact compression, and consumed most incident energy, leaving only a few energies to be transmitted; During the simulation, the incident waveform agrees well with that in the test, yet the specimen consumed more energy and the AUC of the transmitted wave was smaller than in the test. Despite a slight deviation, the simulated transmitted waveform is generally consistent with the test transmitted waveform.
Figure 16. Stress waveform of the blank test
Figure 17. Stress waveform of the blank simulation
Figure 18. Stress waveform in the test
Figure 19. Stress waveform in the numerical simulation
As shown in Figure 20, the numerical simulation discovers that the stress wave propagated in 1D along the bars, which verifies the hypothesis of 1D elastic stress wave. Figure 21 is the cloud map of the stress on the SFRHSC at different moments under the air pressure of 1.0 MPa (impact velocity: 15m/s). Before the stress wave reached the specimen, the stress inside the specimen was zero (Figure 21a); Once it arrived at the specimen, the stress was distributed uniformly in the impact direction of the specimen (Figure 21b); During the impact compression, the stress wave started to disperse, as cracks initiated on the specimen and concrete blocks began falling off (Figure 21c); After the ultimate compressive failure, the specimen lost the original form, and the stress stopped propagating and entirely dispersed (Figure 21d). The numerical simulation fully reproduced the test process, and the simulated results agree well with the test data.
Figure 20. Stress wave propagation in the bars
(a) 570 μs
(b) 630 μs
(c) 745 μs
(d) 1270 μs
Figure 21. Stress wave propagation in the SFRHSC
(1) Judging by the test phenomena, the SFRHSC specimen with a fixed steel fiber content was damaged more severely with the growth in strain rate; the higher the strainer rate, the smaller the concrete particles and the poorer the specimen integrity. Thus, the strain rate can greatly enhance the failure degree of the specimen. The failure mode of the SFRHSC improved with addition of steel fibers and the increase in fiber content. The optimal failure features were observed from the specimen with 1.0 % of steel fiber under the air pressure of 0.7 MPa, which can withstand repeated impact compressions.
(2) The test data show that the increase in strain rate pushed up the dynamic compressive strength of the SFRHSC, that is, the failure degree of the specimen was greatly enhanced by the strain rate. The dynamic mechanics of the specimens can be greatly improved by adding steel fibers. The improvement was particularly obvious under a low air pressure, where the specimen with 1.0 % of steel fiber had the highest dynamic compressive strength (180.9 MPa), 22.6 % higher than that of the specimen with no steel fiber. This reflects the high strength of the SFRHSC under dynamic conditions and the combination advantage of steel fiber and high-strength concrete.
(3) The hypothesis of stress uniformity was verified through numerical simulation. The stress waveform of the blank test echoes with that of numerical simulation, confirming the feasibility of the simulation method. In addition, the numerical simulation reproduced the 1D propagation of the stress wave in the bars, which proves the hypothesis of 1D elastic stress wave, and restaged the impact compression process on the SFRHSC, outputting results similar to the test data.
(4) Both the SHPB test and numerical simulation manifest the excellent dynamic mechanics of the SFRHSC under impact compression. This means the SFRHSC has a feasible material composition. Besides, it is also proved that the SFRHSC outperforms the high-strength concrete or ordinary concrete in static strength. These results are of great significance to the research on the dynamic mechanics of novel shelter layer.
This work is supported by the Youth Scientific Research Fund of Army Logistics University of PLA (No.x2050429).
[1] Smith, J., Cusatis, G. (2016). Numerical analysis of projectile penetration and perforation of plain and fiber reinforced concrete slabs. International Journal for Numerical and Analytical Methods in Geomechanics, 41(3): 315-317. https://doi.org/10.1002/nag.2555
[2] Cao, H., Zhang, X., Guo, X.H., Feng, J.J. (2014). Experimental study on anti-penetration performance of steel fiber reinforced polymer-modified concrete. Advanced Materials Research, 1030-1032: 1100-1103. https://doi.org/10.4028/www.scientific.net/amr.1030-1032.1100
[3] Zhou, N., Wang, J., Yang, R. (2013). Study on the anti-penetration performance of two-layer explosively welded plates impacted by a spherical projectile. Combustion, Explosion, and Shock Waves, 49(3): 374-381. https://doi.org/10.1134/s0010508213030155
[4] Jiao, J., Wang, L., Yu, J. (2015). Numerical simulation on anti-penetration performance of shelter plate made of steel fiber reinforced concrete with steel-concrete-steel sandwich structures. International Conference on Mechanics & Mechatronics, 1224-1230. https://doi.org/10.1142/9789814699143_0150
[5] Aly, T., Thayalan, P., Elchalakani, M., Patnaikuni, I. (2010). Theoretical study on concrete filled steel tubes under static and variable repeated loadings. Journal of Constructional Steel Research, 66(1): 111-124. https://doi.org/10.1016/j.jcsr.2009.08.005
[6] Wang, L., Pang, B., Yang, Z., Chi, R.Q. (2010). Experiment investigation for dynamic behavior of hybrid fiber effects on reactive powder concrete. Proceedings of SPIE - The International Society for Optical Engineering, 752239. https://doi.org/10.1117/12.851538
[7] Zheng, L., Chen, Z. (2010). Study on concrete filled square steel tube under lateral impact loading. Advanced Materials Research, 163-167: 941-946. https://doi.org/10.4028/www.scientific.net/amr.163-167.941
[8] Huang, L., Shi, W. (2013). Study on the dynamic performance of steel fiber reinforced concrete in SHPB experiment. Advanced Materials Research, 700: 140-143. https://doi.org/10.4028/www.scientific.net/amr.700.140
[9] Chen, R., Liu, H., Zeng, R. (2013). SHPB dynamic experiment on silica fume concrete. Advanced Materials Research, 631-632: 771-775. https://doi.org/10.4028/www.scientific.net/amr.631-632.771
[10] Shemirani, A., Naghdabadi, R., Ashrafi, M. (2016). Experimental and numerical study on choosing proper pulse shapers for testing concrete specimens by split Hopkinson pressure bar apparatus. Construction and Building Materials, 125: 326-336. https://doi.org/10.1016/j.conbuildmat.2016.08.045
[11] Xia, K., Yao, W. (2015). Dynamic rock tests using split Hopkinson (Kolsky) bar system–A review. Journal of Rock Mechanics and Geotechnical Engineering, 7(1): 27-59. https://doi.org/10.1016/j.jrmge.2014.07.008
[12] Zhong, W., Rusinek, A., Jankowiak, T., Abed, F., Bernier, R., Sutter, G. (2015). Influence of interfacial friction and specimen configuration in Split Hopkinson Pressure Bar system. Tribology International, 90: 1-14. https://doi.org/10.1016/j.triboint.2015.04.002
[13] Song, B., Chen, W. (2004). Loading and unloading split hopkinson pressure bar pulse-shaping techniques for dynamic hysteretic loops. Experimental Mechanics, 44(6): 622-627. https://doi.org/10.1007/bf02428252
[14] Mirone, G. (2015). Development of a shape memory alloy: activated clamping device for split Hopkinson tension bars. Experimental Techniques, 39(2): 3-15. https://doi.org/10.1111/ext.12008
[15] Durand, B., Delvare, F., Bailly, P., Picart, D. (2016). A split Hopkinson pressure bar device to carry out confined friction tests under high pressures. International Journal of Impact Engineering, 88: 54-60. https://doi.org/10.1016/j.ijimpeng.2015.09.002
[16] Barr, A., Clarke, S., Rigby, S., Tyas, A., Warren, J.A. (2016). Design of a split Hopkinson pressure bar with partial lateral confinement. Measurement Science and Technology, 27(12): 125903. https://doi.org/10.1088/0957-0233/27/12/125903
[17] Kusaka, T., Kono, T., Nomura, Y., Wakabayashi, H. (2014). Dynamic compression test of CFRP laminates using SHPB technique. Applied Mechanics & Materials, 566: 122-127. https://doi.org/10.4028/www.scientific.net/amr.566.122
[18] Peroni, M., Peroni, L., Avalle, M. (2006). High strain-rate compression test on metallic foam using a multiple pulse SHPB apparatus. Journal de Physique IV (Proceedings) /Le Journal de Physique IV, 134: 609-616. https://doi.org/10.1051/jp4:2006134094
[19] Chakraborty, T., Mishra, S., Loukus, J., Halonen, B., Bekkala, B. (2016). Characterization of three Himalayan rocks using a split Hopkinson pressure bar. International Journal of Rock Mechanics and Mining Sciences, 85: 112-118. https://doi.org/10.1016/j.ijrmms.2016.03.005