Fouad Abdulameer Salman*![]() | Zuriana Abu Bakar
| Zuriana Abu Bakar![]()
© 2024 The authors. This article is published by IIETA and is licensed under the CC BY 4.0 license (http://creativecommons.org/licenses/by/4.0/).
OPEN ACCESS
Usability and accessibility are crucial factors for users to accept a particular technology. However, users' physical abilities and experiences using new technologies in their environment vary. These individual differences have contributed to the digital divide. This study aims to develop a conceptual framework to explore the correlations between ease of use, ageing, and the adoption of ATM interfaces. The convenience non-probability sampling method was used, with a sample size of 300 older adult participants. A five-point Likert scale questionnaire was employed as the research instrument. The data was analyzed using Spearman's analysis, descriptive analysis, validity and reliability testing, and regression analysis. The results indicate a significant association between ease of use, ageing, and the adoption of ATM interfaces.
usability, elderly people, acceptance technology, ATMs
Older people in the rapidly ageing population are expected to adapt to new technologies and societal needs [1]. However, it is widely recognized that new technology is less easily acclimated to by older people [2, 3]. Moreover, people have numerous challenges in utilizing new technologies that stem from gender, educational background, geographic location, financial constraints, and the complexity of the latest technology [4]. The lack of incentives, digital skills, appropriate training or support, and potential disability are further problems [5, 6]. It is widely believed that the industry is not yet making severe efforts to bring consumer innovations to older adults, such as all-inclusive and easily accessible services for healthy living environments. Furthermore, many products and solutions right now need to meet the needs of older clients, which worsens their dissatisfaction and increases their reliance on others [7-9].
The Automatic Teller Machine (ATM) is one of the technologies built over an efficient telecommunication system which enables financial institutions to do a combination of financial transactions in the public domain. It helps consumers with automated services to do financial transactions anytime while saving bank resources. People can often perform transaction operations on ATMs, including cash withdrawals, deposits, cash distribution, and account balance checks [10]. Additionally, ATM services can open retirement plans, update account information, exchange currencies, obtain information about stocks and securities, and obtain postage stamps [11]. These machines have various structures in various parts of the world. Their nominal contribution to the positive expansion of the currency is negligible and lacks substantial impact. Since ATMs are a popular draw for most non-bank consumers, which are considered a more profitable bank service. Its fundamental construction is the Central Processing Unit, pin pad, secure cryptographic processor, magnetic chip card, vault, and function keys. However, these features are anticipated to be enhanced in line with future growth in ATM usage [12]. ATMs have long been seen as difficult-to-use equipment in the context of senior citizens [13]. Understanding their challenges when utilizing ATMs is a promising area for doing research.
The literature defines older people as people who have reached the age of sixty [14]. It is an inevitable process, commonly measured by chronological age, and, as a convention, a person aged 65 years or older is often referred to as "elderly" [14]. However, older people who complain about having difficulty utilizing modern innovations continue to have challenges in accepting new technology. According to the study [15], 50% of older people still needed to use contemporary technology that could improve ease of living. Education and job experience significantly influence one's capacity and motivation to adopt the latest innovation, which can be an indicator in determining intention or motivation to use any technology [16]. The evaluated multiple "technology generations" based on the history of software user interfaces [17]. They concluded that, rather than the user's age, people's challenges are related to generation and prior performance. When providing services, products, or programs targeted at older people, corporations, governments, and social service partners must consider critical factors such as elders' perceptions of technology and their profile. Older people are viewed as a sensitive group defined by their medium to occasionally low income, lack of financial obligations, and abundance of free time. Four aspects of ageing — perceptual, psychomotor, cognitive, and physical — affect one's capacity to use technology [18] (see Table 1). According to the study [19], older people's access to modern technologies appears strongly dependent on several factors such as income, education, experiences, and attitudes.
Choi [20] stated that there is no space left for those who refuse to adopt new technologies. Not all equipment is being created with user-friendliness according to their circumstances. A lot of older people lack the desire to pick up new skills. It is not that they are incapable of learning; the issue is that people fail to recognize their needs. For example, according to Plaza et al., elderly people are only accustomed to calling and texting because of poor IT expertise and delayed information processing [21]. In contrast, the only option available for them is to embrace technology. However, older people are categorized into three levels [22]. For one, the exact elderly are quickly tired and passionate. Second, the prosaic elderly, the pre-disability and frail body stage, for example, hand grasp, joints, and vision. Third, seniors with disabilities and life-hindering conditions include but are not limited to arthritis, bronchial asthma, and Alzheimer's disease. Consequently, health weakening impacts the intention to use or adopt a new technology. The changes are also present at the physical, emotional and social levels. Hence, concerning sensory changes, visual and hearing acuity are diminished and can affect how the information is perceived.
Table 1. Dimensions of ageing and their effects on interactions
|
No. |
Dimensions of Ageing |
Problems |
|
1 |
Perceptual |
Vision and hearing deteriorate |
|
2 |
Psychomotor |
Sluggishness and inaccuracy in motor control |
|
3 |
Cognitive |
Weakness of memory (forgetfulness), weakness of concentration, and information processing effectively |
|
4 |
Physical |
Reduced muscular strength and dexterity |
Many studies have explored the perceptions and attitudes of older people toward using new technologies [1-5]. An early investigation of the relationship between health and technology usage showed that this relationship effect, especially when age was taken into account. A study by Casey concluded that compared to those in excellent health, poor people use mobile phones and the internet less frequently. Another research [23] indicates that a close distance between virtual buttons of a smartphone is difficult for the old to use and they also cannot distinguish between colors with low contrast on product screens. To overcome these challenges that faced elderly people, designers must pay close attention to these difficulties through assign old people as a centered design and emphasis on ergonomic and universal design as a practicality benchmark.
People with poor wellness use fewer technologies than people in excellent health, and this trend generally increases with declining health conditions [24]. There may be a generational difference in this: Those who are unwell tend to be older and less accustomed to modern technology [24].
The Automatic Teller Machine (ATM) is now a necessity tool for consumers of all ages and is one of the many new technologies that older people must contend with in their everyday lives [25]. According to the study [26], older folks have more difficulty when using ATMs than younger people. However, they have stated that if training is given or supported by guidelines such as videos, they can learn how to operate an ATM effectively. The majority of retiree older adults receive ATM cards from their bank that they can use to withdraw their pensions. Tragically, most find it difficult to operate these devices, and others frequently take advantage of them. A few of them do utilize ATMs [26]. However, this study involved only 62 participants which they worked under control group. Other studies conducted a usability test on individuals older than 65 and older than 45, employing interview techniques and other experimental methods. They used an alarm clock, a sphygmomanometer, a mobile phone, and a wristwatch. Consequently, they summarized that the diminished cognitive capacities of old adults rendered them unable to integrate multiple functions, with poor memory, confusion regarding complicated procedures, and clouded vision. The absence of a comprehensive approach and a different mentality from technology designers results in impractical product features for older adults [27, 28].
Elderly individuals usually need assistance remembering their passwords, interpreting the on-screen instructions, and accessing the card slot with the right keys. They might be incapable of completing the processes required to complete a transaction because of overall constraints in their cognitive and physical capacities [26]. Training on how to use ATMs is necessary, especially for senior citizens, yet the government and the banks need to provide this kind of instruction. The study [29] suggests that in addition to developing a usable and learnable interface for ATM users, there is a need to teach them to perform regular transaction activities. However, because the ATMs are not designed for this kind of training, it is impractical to educate people on how to use them in this way, and there is a chance that the user won't get their card back in the event of an accident [29]. Yet, the elderly need to be more independent, such as knowing how to use new technology such as ATMs. Most current ATM interface features could be more user-friendly for older adults. The complicated product interface with multi-function features makes older people unable to operate electrical products effectively.
3.1 Technology acceptance model
The theory of reasoned action (TRA) is the foundation of the technology acceptance model (TAM) [30]. TRA is based on social psychology and aims to explain why people do intentionally planned behaviours. Academics widely use this model to predict users' behaviour toward new technology because of its simplicity and ease of application. However, the main goal of this study is to determine what characteristics affect older people acceptance of ATMs.
According to the study [30], three constructs in TAM can account for a user's incentive to accept new technology: perceived ease of use, perceived utility, and intention to make use of the latest technology. Perceived ease of use is the authors' concern in this paper, which impacts older people intention to use new technology. The degree to which a user expects to get value from using a technology without experiencing any physical or mental challenges is known as perceived ease of use. In simpler terms, perceived ease of use reveals a user's effort to perform a task/s using a particular technology.
Ease of use is a central usability concept. Usability comprises all user experience (UX) elements relating to the ease with which users can learn, discover content and do more with a design/product. In any interface design, usability is a minimum requirement for success, but good usability alone does not guarantee market success. If an ease-to-use interface is achieved, it can partly tap into emotional design and help users be satisfied with the represented service. Usability is the extent to which specified users can use a product to achieve specified goals with effectiveness, efficiency, and satisfaction in a specified context [31]. Table 2 explains the details of ease of use dimensions.
Table 2. Description of the dimensions of ease of use
|
No.
|
Dimensions of Ease of Use |
Description |
|
1 |
Effectiveness |
The website's competency enables users to accomplish a task with precision and completeness. |
|
2 |
Efficiency |
It represents the content expended about achieving goals while visiting a website. Users perceive efficiency when they can achieve goals with a quick visit without much cognitive effort. |
|
3 |
Satisfaction |
Satisfaction is when users feel comfortable using a particular technology, such as a website, and believe it can meet their requirements and expectations, thus positively impacting user satisfaction. |
Figure 1. The framework of the adoption of ATM interface
The main research question of this study is to explore the correlations between ease of use, ageing, and the adoption of ATM interfaces. Thus, we assume that older adults will accept ATM interfaces as dependents, whereas ease of use and ageing characteristics will be independent, as Figure 1 illustrates. As a result, the authors have generated the following assumes:
Hypothesis One (H1)
H0: "Ease of use dimensions" and "adoption of an ATM interface by elderly people" do not significantly correlate.
Hypothesis Two (H2)
H0: "Ageing dimensions" and "elderly people's adoption of ATM interface" do not significantly correlate.
Hypothesis Three (H3)
H0: "Adoption of ATM interfaces by elderly people" is not dependent on "effectiveness, efficiency and satisfaction".
Hypothesis Four (H4)
H0: "Adoption of ATM interfaces by elderly people" is not dependent on "perceptual, psychomotor, cognitive and physical".
4.1 Questionnaire
A set of questions was created to investigate particular factors that influence older people who use ATMs. Based on closed-ended and open-ended questions, the questionnaire was developed. The survey was conducted via a one-on-one interview in which the authors guaranteed participant confidentiality and explained the poll's goals.
The survey is divided into demographic data and factors influencing older people's interest in using ATMs. In the survey, respondents were asked to give general demographic information such as age, gender, and so on and then fill out the 20-item questionnaire. The scale items were employed from prior studies [32-34]. The items were scored using a five-point Likert scale that went from "Strongly Agree" (5 points) to "Strongly Disagree" (1 point). In addition to the English language, linguists translated the surveys into Arabic so the older Iraqi adult respondents could be understood entirely. Forty older people participated in a pilot study using the Arabic version of the questionnaire, and the findings demonstrated the validity of each item. It's interesting to note that the sample for this study did not include any of the participants from the pilot trial.
4.2 Sample size
The research sample size involved 300 participants aged 50 or older from various regions in Baghdad, Iraq, with 184 males and 116 females. The study used the "convenience non-probability sampling" method [35]. The reason for the choice is that the survey was limited to a select group of people in the best position to contribute the necessary data. The primary benefits of judgment sampling are lower costs, faster processing times, and a greater probability of obtaining the required participants.
"Convenience non-probability sampling" method is useful because it allows the researcher to build communication and confidence and get between lines. It also provides detailed information about the reasons behind the information and enables ongoing clarification without incurring significant data or printing costs. The disadvantage is the possibility of bias being introduced during the selection process [35].
4.3 Materials
The SPSS software was used to analyze the obtained data statistically. The primary data are analyzed statistically: frequencies, proportions, means, and standard deviation. Descriptive statistics are used to help in understanding systematically collected data over concise presentation. Using inferential statistics, the researcher may determine the relationship between two or more dimensions. Using correlation evaluation, the authors evaluate the conceptual framework.
4.4 Reliability analysis
This study uses reliability to evaluate stability indicators and guarantee item consistency. The reliability was assessed using Cronbach's Alpha [36]. Table 3 provides an overview of each dimension.
Table 3. Reliability of the obtained data
|
Dimension |
Cronbach Alpha |
No. of Items |
Interpretation |
|
Effectiveness |
0.76 |
4 |
Acceptable |
|
Efficiency |
0.94 |
4 |
Excellent |
|
Satisfaction |
0.91 |
4 |
Excellent |
|
Perceptual |
0.89 |
4 |
Good |
|
Psychomotor |
0.92 |
4 |
Excellent |
|
Cognitive |
0.87 |
4 |
Good |
|
Physical |
0.93 |
4 |
Excellent |
|
Adoption of ATM Interfaces |
0.96 |
4 |
Excellent |
From Table 3, the dimension "adoption of ATM interfaces by elderly people" has the most incredible score Cronbach alpha. With a Cronbach alpha of 0.96, this is considered "Excellent" [36]. However, "effectiveness," with a Cronbach alpha of 0.76, was the dimension with the lowest. Nonetheless, Cronbach's alpha values for all the dimensions were over 0.7, indicating their reliability.
4.5 Technology acceptance model
The theory of reasoned action (TRA) is the foundation of the technology acceptance model (TAM) [30]. TRA is based on social psychology and aims to explain why people do intentionally planned behaviours. Academics widely use this model to predict users' behaviour toward new technology because of its simplicity and ease of application. However, the main goal of this study is to determine what characteristics affect older persons' acceptance of ATMs.
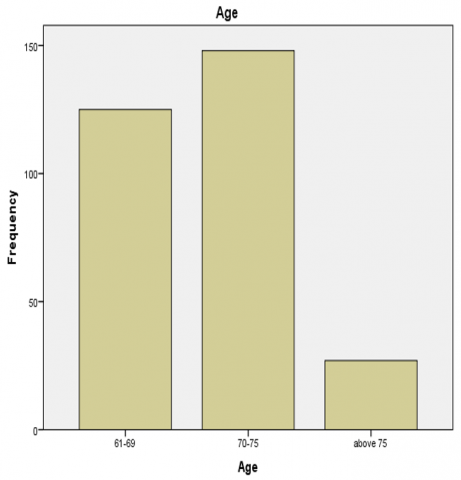
5.1 Respondents profile
A sample of respondents from Baghdad's capital city of Iraq provided feedback for testing the proposed conceptual framework. The study's participants were chosen with older adults in mind. The respondents' demographics are displayed in Table 4 and Table 5. Out of 300 respondents, 46% are female and 54% are male. According to Figure 2 and Figure 3, the age group 70-75 years old had the highest percentage of users (43%), followed by the age group 61-69 years old (49%), and the age group beyond 75 years old (9%).
Table 4. Gender profile of respondents
|
Gender |
Frequency |
Percent |
|
Male |
162 |
54.0 |
|
Female |
138 |
46.0 |
|
Total |
300 |
100.0 |
Table 5. Age groups of the respondents
|
Age |
Frequency |
Percent |
|
61-69 |
125 |
41.7 |
|
70-75 |
148 |
49.3 |
|
Above 75 |
27 |
9.0 |
|
Total |
300 |
100.0 |
Figure 2. Gender profile of respondents
Figure 3. Age groups of the respondents
5.2 Examining the relationship between the dimensions and the adoption of ATM interfaces
Understanding the relationship between the adoption of ATM interfaces and key dimensions such as effectiveness, efficiency, satisfaction, perceptual, psychomotor, cognitive, and physical is a crucial research question. This investigation not only reveals the nature of this association but also provides insights into its strength. To address this, we conducted an examination of Spearman's relationship, a method that quantifies the degree of association by providing linear strength and direction between pairs of dimensions [37]. This method was chosen because of non-parametric, less susceptible to outliers, and does not presuppose a particular distribution. It's important to note that association does not imply causality for the strength of the relationship.
Furthermore, it was shown that a coefficient (r) can have a value from -1 to +1. Additionally, an effect that yields a precise number greater than -1 indicates a positive association, meaning that a rise in each value would inevitably result in a growth in the other. The p-value (sig) result is considered statistically significant if it is less than 0.01. It might be determined that it is not statistically noteworthy if it is more critical than 0.01.
Testing Hypothesis One
The null hypothesis
H0: "Ease of use dimensions" and "adoption of an ATM interface by elderly people" are not significantly associated.
The alternative hypothesis
H1: "Ease of use dimensions" and "adoption of an ATM interface by elderly people" are significantly associated.
where,
H0 = Null hypothesis
H1 = Alternative hypothesis
To determine if there exists an association between "ease of use dimensions" and "adoption of an ATM interface by elderly people", a bivariate analysis was carried out. The outcomes of the analysis are as follows (Table 6).
The value of the 2-tailed test is significant, as seen in Table 6. This is because the p-value is 0.000, which is considered important value. After all, it is below 0.01. Besides that, there's also a positive correlation between "ease of use dimensions" and "adoption of an ATM interface by elderly people," as indicated by Spearman's coefficient (r) of 0.928, 0.977, and 0.875, correspondingly (p) of 0.01. A high correlation is defined as one with a coefficient greater than 0.5 [38]. The null hypothesis (H0) is thus disproved.
Table 6. Associations: Older people's adoption of ATM interfaces and ease of use
|
Spearman's Rho |
Adoption of an ATM Interface by Elderly People |
Effectiveness |
Efficiency |
Satisfaction |
|
|
Adoption of ATM Interface by Elderly People |
Correlation Coefficient |
1.000 |
0.928** |
0.977** |
0.875** |
|
Sig. (2-tailed) |
. |
0.000 |
0.000 |
0.000 |
|
|
N |
300 |
300 |
300 |
300 |
|
|
Effectiveness |
Correlation Coefficient |
0.928** |
1.000 |
0.914** |
0.903** |
|
Sig. (2-tailed) |
0.000 |
. |
0.000 |
0.000 |
|
|
N |
300 |
300 |
300 |
300 |
|
|
Efficiency |
Correlation Coefficient |
0.977** |
0.914** |
1.000 |
0.889** |
|
Sig. (2-tailed) |
0.000 |
0.000 |
. |
0.000 |
|
|
N |
300 |
300 |
300 |
300 |
|
|
Satisfaction |
Correlation Coefficient |
0.875** |
0.903** |
0.889** |
1.000 |
|
Sig. (2-tailed) |
0.000 |
0.000 |
0.000 |
. |
|
|
N |
300 |
300 |
300 |
300 |
|
|
**. Correlation is significant at the 0.01 level (2-tailed). |
|||||
Testing Hypothesis Two
H0: "Aging dimensions" and "elderly people's adoption of ATM interfaces" do not significantly correlate.
H2: "Aging dimensions" and "elderly people's adoption of ATM interfaces" do significantly correlate.
where,
H0 = The null hypothesis
H2 = The alternative hypothesis
To determine if there is a correlation between "ageing dimensions" and "adoption of ATM interfaces by elderly people," a bivariate analysis was carried out. The outcomes of the test are as follows (Table 7).
As shown in Table 7, the value of the 2-tailed test is significant, where the p-value is 0.000, which means less than 0.01. Additionally, Spearman's association coefficient (r) for "ageing dimensions" and "adoption of ATM interfaces by elderly people" is 0.913, 0.919, 0.952, and 0.918, respectively, with a p-value of 0.01. This indicates a positive correlation. Therefore, since a coefficient greater than 0.5 is considered essential, the null hypothesis (H0) is thus disproved.
Table 7. Associations: Older people's adoption of ATM interfaces and ageing
|
Spearman's Rho |
Adoption of an ATM Interface by Elderly People |
Perceptual |
Psychomotor |
Cognitive |
Physical |
|
|
Adoption of ATM Interface by Elderly People |
Correlation Coefficient |
1.000 |
0.913** |
0.919** |
0.952** |
0.918** |
|
Sig. (2-tailed) |
. |
0.000 |
0.000 |
0.000 |
0.000 |
|
|
N |
300 |
300 |
300 |
300 |
300 |
|
|
Perceptual |
Correlation Coefficient |
0.913** |
1.000 |
0.860** |
0.947** |
0.860** |
|
Sig. (2-tailed) |
0.000 |
. |
0.000 |
0.000 |
0.000 |
|
|
N |
300 |
300 |
300 |
300 |
300 |
|
|
Psychomotor |
Correlation Coefficient |
0.919** |
0.860** |
1.000 |
0.955** |
1.000** |
|
Sig. (2-tailed) |
0.000 |
0.000 |
. |
0.000 |
0.000 |
|
|
N |
300 |
300 |
300 |
300 |
300 |
|
|
Cognitive |
Correlation Coefficient |
0.952** |
0.947** |
0.955** |
1.000 |
0.956** |
|
Sig. (2-tailed) |
.000 |
.000 |
.000 |
. |
.000 |
|
|
N |
300 |
300 |
300 |
300 |
300 |
|
|
Physical |
Correlation Coefficient |
0.918** |
0.860** |
1.000** |
0.956** |
1.000 |
|
Sig. (2-tailed) |
.000 |
.000 |
.000 |
.000 |
. |
|
|
N |
300 |
300 |
300 |
300 |
300 |
|
|
**. Correlation is significant at the 0.01 level (2-tailed). |
||||||
5.3 Regression analysis for testing ease of use dimensions
Regression analysis is to test whether "adoption of ATM interfaces by elderly people" is dependent on "effectiveness, efficiency and satisfaction".
H0: "Adoption of ATM interfaces by elderly people" is not dependent on "effectiveness, efficiency and satisfaction".
H3: "Adoption of ATM interfaces by elderly people" dependent on "effectiveness, efficiency and satisfaction".
where,
H0 = The null hypothesis
H3 = The alternative hypothesis
Table 8 shows that there is a strong positive linear association between "effectiveness, efficiency, and satisfaction" and "adoption of ATM interfaces by elderly people" (Multiple R = 0.965).
Additionally, variations in the ease of use dimensions are around 93% of the adoption of ATM interfaces by older persons, according to the coefficient of determination (R Square) of 0.93.
Table 8. Model summary (Regression statistics table)
|
Model |
R |
R Square |
Adjusted R Square |
Std. Error of the Estimate |
|
1 |
0.965a |
0.932 |
0.931 |
0.21363 |
|
a. Predictors: (Constant), Satisfaction, Effectiveness, Efficiency |
||||
The F- statistic shows how much the distributions of data overlap, as shown in Table 9. The F statistic would be considerable if the amount of overlap were low. The framework fits in this instance since the F statistic has a statistically significant value of 0.00, meaning it is significantly less than 5%.
Table 9. ANOVA test
|
Model |
Sum of Squares |
df |
Mean Square |
F |
Sig. |
|
|
1 |
Regression |
184.278 |
3 |
61.426 |
1345.949 |
0.000b |
|
Residual |
13.509 |
296 |
0.046 |
|
|
|
|
Total |
197.787 |
299 |
|
|
|
|
|
a. Dependent Variable: Adoption of ATM Interface by Elderly People |
||||||
|
b. Predictors: (Constant), Satisfaction, Effectiveness, Efficiency |
||||||
The sum of squares is divided into constituent parts in the ANOVA analysis. Regression is the sum of squares with the residual (sum of squares) resulting in the total sum.
Thus,
R Square (R2) = 1 – Residual Sum of Squares/ Total Sum of Squares
= 1 – 13.509/197.787
= 0.93
As a result, it is evident from Table 10 that p is 0.00, which is lower than 0.05. The null hypothesis is thus disproved.
All the Beta values are positive, thus meaning that there is a positive relationship between the independent variables, all indicating significance.
The Model is a Multiple Regression which corresponds to the Multiple Regression Equation Y = β0 + β1X1 = β2X2 + β3X3.
where, Y = (Adoption of ATM interfaces by older people);
X1, X2, X3 = Ease of use dimensions;
β0 = Intercept (Constant);
X1 = Effectiveness;
X2 = Efficiency;
X3 = Satisfaction.
Table 10. Coefficients test
|
Model |
Unstandardized Coefficients |
Standardized Coefficients |
t |
Sig. |
||
|
B |
Std. Error |
Beta |
||||
|
1 |
(Constant) |
0.184 |
0.029 |
|
6.370 |
0.000 |
|
Effectiveness |
0.851 |
0.034 |
0.915 |
25.199 |
0.000 |
|
|
Efficiency |
0.294 |
0.033 |
0.362 |
9.002 |
0.000 |
|
|
Satisfaction |
0.283 |
0.037 |
0.317 |
7.735 |
0.000 |
|
|
a. Dependent Variable: Adoption of ATM Interface by Elderly People |
||||||
5.4 Regression analysis for testing ageing dimensions
Regression analysis is to test whether "adoption of ATM interfaces by elderly people" is dependent on "perceptual, psychomotor, cognitive and physical".
H0: "Adoption of ATM interfaces by elderly people" is not dependent on "perceptual, psychomotor, cognitive and physical".
H4: "Adoption of ATM interfaces by elderly people" depends on "perceptual, psychomotor, cognitive and physical".
where,
H0 = Null hypothesis
H4 = Alternative hypothesis
As shown in Table 11, A solid positive linear correlation between "perceptual, psychomotor, cognitive, and physical factors" and "adoption of ATM interfaces by elderly people" is indicated by the (Multiple R) of 0.930.
An explanation of 86% for using ATM interfaces by older people also identified differences in the ageing dimensions, based on (R Square) of 0.86.
Table 11. Model summary (Regression statistics table)
|
Model |
R |
R Square |
Adjusted R Square |
Std. Error of the Estimate |
|
1 |
0.930a |
0.865 |
0.863 |
0.30105 |
|
a. Predictors: (Constant), Physical, Perceptual, Psychomotor, Cognitive |
||||
Table 12. ANOVA test
|
Model |
Sum of Squares |
df |
Mean Square |
F |
Sig. |
|
|
1 |
Regression |
171.051 |
4 |
42.763 |
471.850 |
0.000b |
|
Residual |
26.735 |
295 |
0.091 |
|
|
|
|
Total |
197.787 |
299 |
|
|
|
|
|
a. Dependent Variable: Adoption of ATM Interface by Elderly People b. Predictors: (Constant), Physical, Perceptual, Psychomotor, Cognitive |
||||||
The F- statistic shows the extent to which the distributions overlap, as seen in Table 12. The F- statistic seems significant if the overlap was minimal, suggesting a fundamental difference in the distribution that was not caused by sampling errors and vice versa. The model fits in this particular case since the F statistic has a critical value of 0.00, considerably less than the 5% significance limit.
The sum of squares is divided into parts in the ANOVA table. The total sum of squares = Regression + error.
Thus,
R Square (R2) = 1 – 26.735/197.787 (From data in the ANOVA table)
= 0.86 (The result matches the R2 value shown in the regression statistics table).
Table 13. Coefficients test
|
Model |
Unstandardized Coefficients |
Standardized Coefficients |
t |
Sig. |
||
|
B |
Std. Error |
Beta |
||||
|
1 |
(Constant) |
0.025 |
0.046 |
|
0.548 |
0.584 |
|
Perceptual |
0.793 |
0.144 |
0.894 |
5.495 |
0.000 |
|
|
Psychomotor |
0.095 |
0.254 |
0.097 |
0.374 |
0.709 |
|
|
Cognitive |
-1.243 |
0.240 |
-1.042 |
-3.934 |
0.000 |
|
|
Physical |
0.994 |
0.278 |
1.028 |
3.574 |
0.000 |
|
|
a. Dependent Variable: Adoption of ATM Interface by Elderly People |
||||||
Table 13 shows the coefficients results that p is 0.00, less than 0.05. Therefore, the null hypothesis is thus rejected.
Since each Beta value is positive, it means that there is a positive correlation between the dimensions, all of which point to importance.
The Model is a Multiple Regression, which corresponds to the Multiple Regression Equation Y = β0 + β1X1 = β2X2 + β3X3.
where, Y = (Adoption of ATM interfaces by older people);
X1, X2, X3 = Ease of use dimensions;
β0 = Intercept (Constant);
X1 = Perceptual;
X2 = Psychomotor;
X3 = Cognitive;
X4 = Physical.
This study offers a conceptual framework that identifies factors influencing elderly people adoption of ATM interfaces. The theoretical framework presents prior research from many contexts, building on a foundation of knowledge regarding older adults. effectiveness, efficiency, satisfaction, perceptual, psychomotor, cognitive, and physical were the seven dimensions that were listed in this regard. Lastly, the correlation between these factors and older persons' use of ATM interfaces was examined using t-tests. The findings show a high correlation between ageing and ease of use regarding older people adopting ATM interfaces.
[1] Grigorovich, A., Kontos, P., Jenkins, A., Kirkland, S. (2022). Moving toward the promise of participatory engagement of older adults in gerotechnology. The Gerontologist, 62(3): 324-331. https://doi.org/10.1093/geront/gnab026
[2] Salman, F.A., Deraman, A.B. (2020). Investigating factors affecting the adoption of smartphone technology by elderly people in Iraq. Review of Computer Engineering Research, 7(2): 47-53. https://doi.org/10.18488/journal.76.2020.72.47.53
[3] Zimmermann, L.C., Rodrigues, K.R.H., Pimentel, M.G.C. (2019). EPARS: Elderly physical activity reminder system using smartphone and wearable sensors. In Adjunct Proceedings of the 2019 ACM International Joint Conference on Pervasive and Ubiquitous Computing and Proceedings of the 2019 ACM International Symposium on Wearable Computers, London, United Kingdom, pp. 1139-1145. https://doi.org/10.1145/3341162.3350845
[4] Khan, A., Khusro, S. (2019). Smart assist: Smartphone-based drug compliance for elderly people and people with special needs. In: Khan, F., Jan, M., Alam, M. (eds) Applications of Intelligent Technologies in Healthcare. Springer, Cham. http://doi.org/10.1007/978-3-319-96139-2_10
[5] Casselden, B. (2023). Not like riding a bike: How public libraries facilitate older people’s digital inclusion during the Covid-19 pandemic. Journal of Librarianship and Information Science, 55(3): 704-718. https://doi.org/10.1177/09610006221101898
[6] Lim, H.A., Lee, J.S.W., Lim, M.H., Teo, L.P.Z., Sin, N.S.W., Lim, R.W., Chua, S.M., Yeo, J.Q., Ngiam, N.H.W., Tey, A.J.Y., Tham, C.Y.X., Ng, K.Y.Y., Low, L.L., Tang, K.W.A. (2022). Bridging connectivity issues in digital access and literacy: Reflections on empowering vulnerable older adults in Singapore. JMIR Aging, 5(2): e34764. https://doi.org/10.2196/34764
[7] Cristiano, A., Musteata, S., De Silvestri, S., Bellandi, V., Ceravolo, P., Cesari, M., Azzolino, D., Sanna, A., Trojaniello, D. (2022). Older adults’ and clinicians’ perspectives on a smart health platform for the aging population: Design and evaluation study. JMIR Aging, 5(1): e29623. https://doi.org/10.2196/29623
[8] Klimova, B., Valis, M. (2018). Smartphone applications can serve as effective cognitive training tools in healthy aging. Frontiers in Aging Neuroscience, 9: 436. https://doi.org/10.3389%2Ffnagi.2017.00436
[9] Ostrowski, A.K., Breazeal, C., Park, H.W. (2022). How do older adults engage as robot co-designers? Rapid prototyping supported by lived experiences with technology. In: Goldschmidt, G., Tarazi, E. (eds) Expanding the Frontiers of Design: Critical Perspectives. Routledge, London. http://doi.org/10.1201/b22630-24
[10] Adeoti, J.O. (2011). Automated teller machine (ATM) frauds in Nigeria: The way out. Journal of Social Sciences, 27(1): 53-58. http://doi.org/10.1080/09718923.2011.11892905
[11] Wu, M.C., Huang, S.W., Lin, W.C., Yvette, E., Lin, W., Hsieh, Y.C., Hung, C.P. (2011). Financial transaction system, automated teller machine (ATM), and method for operating an ATM. United States Patent Application 20110016047. https://www.freepatentsonline.com/y2011/0016047.html.
[12] Lozoya, S.V.M., Guirado, M.A.Z., González, A.Z., López, A.B.M. (2022). Use of technologies and self-efficacy in older adults. IEEE Revista Iberoamericana de Tecnologias del Aprendizaje, 17(2): 125-130. https://doi.org/10.1109/RITA.2022.3166870
[13] Roupa, Z., Nikas, M., Gerasimou, E., Zafeiri, V., Giasyrani, L., Kazitori, E., Sotiropoulou, P. (2010). The use of technology by the elderly. Health Science Journal, 4(2): 118-126. https://www.researchgate.net/publication/266448717.
[14] Beshyah, S.A., Hafidh, K., Abdulrahman, H., Hammami, S.O. (2022). Perceptions of geriatric medicine and care of the elderly: An exploratory survey of physicians from the Middle East and Africa. Ibnosina Journal of Medicine and Biomedical Sciences, 14(1): 12-21. http://doi.org/10.1055/s-0042-1748777
[15] Selwyn, N. (2004). The information aged: A qualitative study of older adults’ use of information and communications technology. Journal of Aging Studies, 18(4): 369-384. https://doi.org/10.1016/j.jaging.2004.06.008
[16] Valtonen, T., López-Pernas, S., Saqr, M., Vartiainen, H., Sointu, E.T., Tedre, M. (2022). The nature and building blocks of educational technology research. Computers in Human Behavior, 128: 107123. https://doi.org/10.1016/j.chb.2021.107123
[17] Docampo Rama, M. (2001). Technology generations handling complex user interfaces. Ph.D. dissertation. Industrial Engineering and Innovation Sciences, Eindhoven University of Technology. Eindhoven, Netherlands. https://doi.org/10.6100/IR545793
[18] Murr, D., Feichtinger, P., Larkin, P., O’Connor, D., Höner, O. (2018). Psychological talent predictors in youth soccer: A systematic review of the prognostic relevance of psychomotor, perceptual-cognitive and personality-related factors. PloS One, 13(10): e0205337. https://doi.org/10.1371/journal.pone.0205337
[19] Mitzner, T.L., Savla, J., Boot, W.R., Sharit, J., Charness, N., Czaja, S.J., Rogers, W.A. (2019). Technology adoption by older adults: Findings from the PRISM trial. The Gerontologist, 59(1): 34-44. https://doi.org/10.1093/geront/gny113
[20] Choi, A.R. (2020). Factors affecting the life satisfaction of middle and old people in the knowledge information society: Focusing on the awareness and attitude of future knowledge and information technology. Journal of Digital Convergence, 18(12): 11-19. https://doi.org/10.14400/JDC.2020.18.12.011
[21] Plaza, I., Martín, L., Martin, S., Medrano, C. (2011). Mobile applications in an aging society: Status and trends. Journal of Systems and Software, 84(11): 1977-1988. https://doi.org/10.1016/j.jss.2011.05.035
[22] Cunningham, C., O’Sullivan, R., Caserotti, P., Tully, M.A. (2020). Consequences of physical inactivity in older adults: A systematic review of reviews and meta-analyses. Scandinavian Journal of Medicine & Science in Sports, 30(5): 816-827. https://doi.org/10.1111/sms.13616
[23] Kaltenbrunner, M., Bovermann, T., Bencina, R., Costanza, E. (2005). TUIO: A protocol for table-top tangible user interfaces. In Proceedings of the 6th International Workshop on Gesture in Human-Computer Interaction and Simulation, Vannes, France, pp. 1-5. http://216.92.115.131/static/writings/tuio_gw2005.pdf.
[24] Hauk, N., Hüffmeier, J., Krumm, S. (2018). Ready to be a silver surfer? A meta-analysis on the relationship between chronological age and technology acceptance. Computers in Human Behavior, 84: 304-319. https://doi.org/10.1016/j.chb.2018.01.020
[25] Zaim, E., Miesenberger, K. (2018). TokenAccess: Improving accessibility of automatic teller machines (ATMs) by transferring the interface and interaction to personal accessible devices. In Proceedings of 16th International Conference on Computers Helping People with Special Needs, Linz, Austria, pp. 335-342. https://doi.org/10.1007/978-3-319-94277-3_53
[26] Huang, H., Yang, M., Yang, C., Lv, T. (2019). User performance effects with graphical icons and training for elderly novice users: A case study on automatic teller machines. Applied Ergonomics, 78: 62-69. https://doi.org/10.1016/j.apergo.2019.02.006
[27] Fisk, A.D. (1999). Human factors and the older adult: Professional diversity brings success. Ergonomics in Design: The Quarterly of Human Factors Applications, 7(1). https://www.researchgate.net/publication/253963320.
[28] Kunaratana-Angkul, Y., Wu, K.C., Shin-Renn, Y. (2020). Usability in the app interface designing for the elderly with low-vision in Taiwan and Thailand. In 2020 IEEE 2nd Eurasia Conference on Biomedical Engineering, Healthcare and Sustainability (ECBIOS), Tainan, Taiwan, pp. 64-67. https://doi.org/10.1109/ECBIOS50299.2020.9203640
[29] Omari, O.J., Omariba, B.Z. (2013). Investigating ATM system accessibility for people with visual impairments. IOSR Journal of Computer Engineering (IOSR-JCE), 15(5): 13-18. http://ir-library.kabianga.ac.ke/handle/123456789/601.
[30] Davis, F.D., Bagozzi, R.P., Warshaw, P.R. (1989). User acceptance of computer technology: A comparison of two theoretical models. Management Science, 35(8): 982-1003. https://doi.org/10.1287/mnsc.35.8.982
[31] Bevan, N., Carter, J., Harker, S. (2015). ISO 9241-11 revised: What have we learnt about usability since 1998? In Proceedings of 17th International Conference on Human-Computer Interaction, Los Angeles, CA, USA, pp. 143-151. https://doi.org/10.1007/978-3-319-20901-2_13
[32] Rogers, W.A., Cabrera, E.F., Walker, N., Gilbert, D.K., Fisk, A.D. (1996). A survey of automatic teller machine usage across the adult life span. Human Factors: The Journal of the Human Factors and Ergonomics Society, 38(1): 156-166. https://doi.org/10.1518/001872096778940723
[33] Keränen, N.S., Kangas, M., Immonen, M., Similä, H., Enwald, H., Korpelainen, R., Jämsä, T. (2017). Use of information and communication technologies among older people with and without frailty: A population-based survey. Journal of Medical Internet Research, 19(2): e29. https://doi.org/10.2196/jmir.5507
[34] Rasche, P., Mertens, A., Brandl, C., Liu, S., Buecking, B., Bliemel, C., Horst, K., Weber, C.D., Lichte, P., Knobe, M. (2018). Satisfying product features of a fall prevention smartphone app and potential users’ willingness to pay: Web-based survey among older adults. JMIR mHealth and uHealth, 6(3): e75. https://doi.org/10.2196/mhealth.9467
[35] Etikan, I., Musa, S.A., Alkassim, R.S. (2015). Comparison of convenience sampling and purposive sampling. American Journal of Theoretical and Applied Statistics, 5(1): 1-4. https://doi.org/10.11648/j.ajtas.20160501.11
[36] Brown, J.D. (2002). The Cronbach alpha reliability estimate. Shiken: JALT Testing & Evaluation SIG Newsletter, 6(1): 17-19. http://jalt.org/test/bro_13.htm.
[37] Puth, M.T., Neuhäuser, M., Ruxton, G.D. (2015). Effective use of Spearman’s and Kendall’s correlation coefficients for association between two measured traits. Animal Behaviour, 102: 77-84. https://doi.org/10.1016/j.anbehav.2015.01.010
[38] Brase, C.H., Brase, C.P. (2016). Understandable Statistics. Cengage Learning, Boston. https://repositorio.uvm.edu.ve/handle/123456789/100.