Emine Cengil* | Ahmet Çınar | Muhammed Yıldırım
© 2022 IIETA. This article is published by IIETA and is licensed under the CC BY 4.0 license (http://creativecommons.org/licenses/by/4.0/).
OPEN ACCESS
Traumatic brain injuries and collisions from falls and electric shocks are among the leading causes of construction deaths. Helmets play an important role in protecting working people from accidents. However, wearing a hard hat in real life is often not strictly enforced among those who try. Therefore, it is important to check this and ensure that a helmet is worn. Today, the use of artificial intelligence-based object recognition systems has become widespread due to the advantages it provides. In this article, a one-step object detection approach based on deep learning is proposed to detect helmet use and control helmet wearing status. The model is based on the YOLOv5 architecture. In the feature extraction step of the method, ShuffleNetv2, which is a lightweight model for a fast detector, is used. The presented model has been examined on the Hard Hat Workers dataset. The architecture provided a recall value of 0.942 precision 0.91 in the corresponding dataset. The obtained results showed that the recommended model is suitable for use on construction sites to check whether a helmet is fitted.
hardhat detection, object detection, convolutional neural network, construction safety, computer vision
The construction sector has an important place in terms of the added value and employment opportunities it provides to the economy. Occupational accidents in the construction industry are a major problem worldwide [1]. According to the statistics of the Social Security Institution, the construction sector is among the top three sectors in Turkey where the number of occupational accidents is high. In addition, it ranks first among all sectors in terms of loss of life. According to 2016 SSI data, 195 thousand 990 of the 1 million 749 thousand 240 workplaces in Turkey cover the construction sector. 13.7% of workers in all sectors are employed in the construction sector. 15.6% of occupational accidents have been experienced in the construction sector, and in terms of fatal occupational accidents, the sector ranks first among all fields of activity with a rate of 35.3% [2].
Construction deaths are always due to a combination of different factors. Most accidents occur due to unsafe behavior and conditions. Among the most common types of accidents occurring in the construction industry in Turkey, material fall and material splash are in the second and third place [3]. Due to injuries and fatalities caused by occupational accidents, there is a crucial demand for on-site safety processes and regulations to improve construction site safety. Safety precautions, such as hard hats, can help to manage risks effectively. However, even if the employees have been trained before, they do not fully comply with the construction site safety rules [1]. The building sector is one of the least digitalized in the world. As a result, current safety investigation practices rely heavily on inspectors' manual recording and evaluation. Automated systems are beneficial to make safety inspections safer and easier.
1.1 Related works
There are many studies, especially using deep learning techniques, to increase construction site safety.
Wu et al. [4] propose an SSD-based method for automatically monitoring construction workers wearing helmets and identifying the appropriate colors. The system shows that it can achieve 83.89% mAP. Fang et al. [5] proposes a Faster RCNN-based system to identify personnel who do not wear helmets. A four-class detection problem that checks the presence of helmets and suits is performed with the modified yolov3 [6]. Kim et al. [7] used a model based on the Faster RCNN technique that learned whether construction workers were wearing helmets or not.
Using the Faster R-CNN algorithm, provides an image detection model about the safety conditions of the employees [8]. The MIT Places Database is used as a three-class training dataset containing helmet, vest, and boots in the experiments. The results showed an average accuracy of 70%. Filatov et al. [9] SqueezeDet and MobileNets propose a unified system of neural networks. The method achieved an F1 score of 0.75. Casuat et al. [10] used Yolov3 to detect people wearing helmets. It has been reported that the model achieved an average accuracy of 79,246 in the tested dataset. Wang et al. [11] presented a convolutional neural network to determine if employees were wearing helmets. The presented method concentrates on locating a person's head and deciding whether to wear a helmet or not. The MobileNet model is used as the detector's backbone structure, allowing it to operate in real time. To improve the extraction of features, a top-down module is used. Finally, it is detected in multi-scale features using a block-based estimation module. The results of the experiment in the dataset used demonstrate that the proposed method can detect people with / without hardhats with an average precision of 87.4% / 89.4% at 62 frames per second.
1.2 Motivation
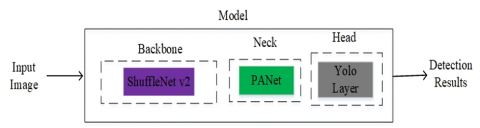
Some of the studies conducted in previous years suggested methods such as RCNN, faster RCNN [5, 7, 8] that can be highly accurate, but not so fast for real-time use. In addition, there are approaches using the SSD [4] and Yolo [6, 10, 12] families, which are widely used in real-time applications. In object detection, YOLO algorithms with very high accuracy and speed have been used in multiple detection tasks [13, 14]. In the study, a model is proposed in which the known Yolov5 architecture is modified. The draft of the suggested pipeline is depicted in Figure 1.
Figure 1. Draft of the suggested pipeline
1.3 Contributions of paper
The contributions of the study can be listed as follows:
• An efficient and fast one-step detection approach based on the YOLOv5 architecture is suggested.
• The architecture in which ShuffleNetv2 is used as a feature extractor achieves high accuracy rates.
• The use of the method in construction and in some factories can ensure that workers' injuries and deaths are minimized by controlling whether the workers are wearing helmets.
1.4 Organization of paper
The organization of the study is as follows. Section 2 shows the network structures and datasets used in the applied method. The third section gives the pipeline of the proposed architecture. Section 4 shows the experimental results of the approach. Section 5 presents the discussion and conclusion parts.
In order to understand the applied methodology, the algorithms used and the data sets should be explained. In this section, the network structures used in creating the method and the dataset used for training and validation are presented.
2.1 ShuffleNetv2
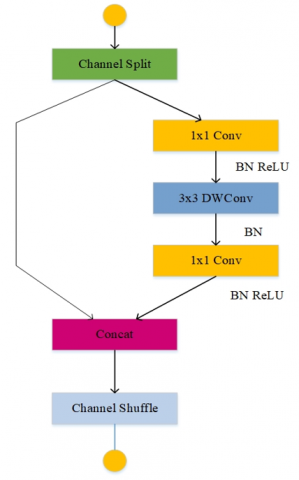
ShuffleNetv2 [15] is a computationally efficient convolution structure developed specifically for mobile devices with very limited computational power. The designers of the model paid attention to four features to create an efficient architecture. These; the use of balanced convolution, awareness of the cost of group convolution, reducing the degree of fragmentation and reducing element-wise operations. Recent developments in lightweight neural network architectures often rely on the FLOP metric and these features are ignored. However, ShuffleNetv2 has lower complexity and fewer parameters compared to other ESA architectures. For these reasons, SuffleNetv2 was used as the feature extraction network in the study.
Figure 2 depicted a display model block used in the ShuffleNetv2 architecture. It makes use of a simple operator known as channel split. Speed-optimized metrics instead of indirect metrics like FLOPs. At the beginning of each unit, the input of the feature channels is divided into two branches. After convolution, two branches are combined as shown in the figure. Thus, the number of channels remains the same. To allow information communication between the two branches, the same "channel shuffle" operation as in ShuffleNet [16] is used.
Figure 2. ShuffleNetv2 block diagram [15]
ShuffleNetv2 is recommended based on practical guidelines, providing high accuracy at high speed. According to the results of the experiments in the study [15], an effective network design should use balanced convolutions, be mindful of the expense of using group convolutions, minimize fragmentation, and reduce element-wise operations. Beyond theoretical FLOPs, these desirable features are dependent on platform features. They must be considered for practical architecture design [16].
2.2 Path Aggregation Network (PANet)
Feature pyramids are mostly made using the neck. Feature pyramids aid in the generalization of models when it comes to object scaling. It enables for the definition of the same object in many sizes and scales [17]. Feature pyramids are quite beneficial in assisting models in performing effectively on unknown data.
Figure 3. Some sample images taken from the dataset [21]
The developers of Yolov4 [18] consider PANet to be the most suitable feature fusion network for Yolo. PANet is also used as feature fusion in Yolov5. PANet helps with object scaling of the model by using it to obtain feature pyramids. It uses an enhanced bottom-up approach and a new feature pyramid network (FPN) structure. Low-level characteristics spread faster as a result of this.
The feature grid and adaptive feature pool that connect all feature levels are utilized to convey important information straight from each feature level to the subnet below. In the lowest layers, PANet increases the usage of precise localization signals. This will definitely increase the object's position accuracy. Therefore, the Neck block of the architecture uses PANet, which was used in Yolov4 and Yolov5.
2.3 YOLO
The final detection part is performed by the head of the model. The head used in YOLOv3 [19] and YOLOv4 is also used in YOLOv5 [20]. It applies anchor boxes to features and creates output vectors, including class probabilities and bounding boxes. It creates feature maps of three different dimensions to arrive at multi-scale predictions of the model: small, medium and large.
2.4 Data set
Hard Hat Workers dataset [21], which is a public dataset, was used in the study. The dataset is an object detection dataset
of those working in work areas that require hard hats. Annotations also include examples of "person" and "head" where an individual could be present without a hard hat. The dataset, which includes a total of three classes, consists of 7041 images. 75% of these images were used for training, 20% for validation and, 5% for testing. Some of the images belonging to the dataset are as in Figure 3.
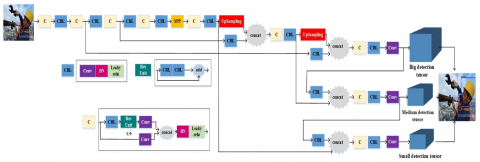
The proposed model consists of three stages, as in other deep learning-based object finders. First, a lightweight and efficient model, ShuffleNetv2, was used in the feature extraction step. ShuffleNetv2 is a computationally efficient convolution structure specifically designed for mobile devices with limited computing power. ShuffleNetv2 was used as the backbone in the study. Since an accident is a momentary thing, it is necessary to be under control at all times. Therefore, it is important that the algorithm gets fast and accurate results at the same time. Therefore, a path collection network has been applied to increase the data flow in the neck block. PANet uses a new feature pyramid network structure with a better bottom-up approach to increase low-level feature diffusion. Simultaneously, the adaptive feature pool, which connects the feature grid and all feature levels, is employed to ensure that important information from one feature level is directly communicated to the subnet below. PANet improves the usage of precise localization signals in the lower layers, which can improve the object's position accuracy significantly. Finally, the Yolo layer is used for the head part estimation. This layer creates feature maps in three different sizes (small, medium, large). Thus, the objects in the received image are largely detected. Figure 4 gives a graphical summary of the proposed method.
Figure 4. Graphical abstract of suggested method
The suggested method is tested with a dataset of 7035 images to determine if a helmet is worn. Of the images in the dataset presented in Yolo format, 5,269 are used for training, 1,415 for validation, and 351 for testing.
For training, the proposed object finding model is based on the yolov5 model. In the feature extraction step, a helmet finder is created using Shufflenetv2, a computationally efficient convolution architecture. Model tutorial hardware is based on Intel(R) Core(TM) i7-7500U CPU @ 2.90GHz, 16GB RAM and NVIDIA GeForce GTX 950M GPU.
4.1 Evaluate the performance of the models
Object detectors purpose to detect with high accuracy the position of objects of a particular category in an image or video. They do this by determining the positions of objects using bounding boxes [22]. The assessment criteria used in object detection measure how near the detected bounding boxes are to the genuine bounding boxes. This measurement is done separately for each item class, assessing the overlap between the expected and precise reference fields. The performance of an object detection model is evaluated using a variety of measuring criteria. The suggested method's performance was evaluated using the recall, precision, and average precision (AP) measures.
4.1.1 Intersection over Union (IoU)
Let the detected area be defined by a predicted bounding box BBp and the ground truth be a target object to detect described by the bounding box BBgt. Without taking into account a confidence level, a perfect match is defined as the area and placement of the projected and precise reference boxes being identical. IoU, a metric based on the Jaccard Index, a coefficient of similarity for two data sets, is used to evaluate these two requirements. The IoU is equal to the area of junction between the estimated bounding box BBp and the ground truth bounding box BBgt divided by the junction area in the context of object detection. It is calculated as in Eq. (1).
$I o U=\frac{\operatorname{area}\left(B B_{g t} \cap B B_p\right)}{\operatorname{area}\left(B B_{g t} \cup B B_p\right)}$ (1)
By defining an IOU threshold, it can be limited in how detections are considered true or false. IOU values are generally represented as percentages, with the most common thresholds being 50% and 75% [23].
4.1.2 Precision and recall
The capacity of a model to recognize just relevant things is known as precision. The percentage of positive forecasts that were correct. The ability of a model to detect all relevant states is known as recall. It is the percentage of correct positive estimates among all provided baseline facts [24]. Precision and Recall are as in Eqns. (2) and (3), respectively [25].
$P=\frac{T P}{T P+F P}$ (2)
$R=\frac{T P}{T P+F N}$ (3)
4.1.3 Average precision
The average precision for a recall value between 0 and 1 is calculated. If the sensitivity of an object detector remains high as the recall rises, it may be deemed good. That is, sensitivity and recall will be high when the confidence threshold changes. As a result, a large area under the curve (AUC) usually indicates good precision and recall. The accuracy recall graph is frequently a zigzag-like curve in practice, making the AUC challenging to estimate accurately. The precision recall curve is performed before the AUC computation to avoid this. This is accomplished using the 11-point interpolation method. The form of the precision recall curve is described by averaging the maximum precision values across 11 equally spaced recall sets. It is calculated as in Eq. (4) [26].
$A P=\frac{1}{11} \sum_{R \in\{0,0.1 \ldots, 1\}} P_{\text {interp }}(R)$,
where, $P_{\text {interp }}(R)=\begin{gathered}\max \\ \tilde{R}: \tilde{R} \geq R\end{gathered} P(\tilde{R})$ (4)
4.1.4 Mean Average Precision (mAP)
The average AP over various IoU thresholds is called mAP. Average AP over all classes [27]. The formula of mAP is as in (5).
$m A P=\frac{1}{K} \sum_{a=1}^K A P_a$ (5)
4.2 Experimental results
The proposed method is tested with a dataset of 7035 images to determine whether a helmet is worn. Of the images in the dataset presented in Yolo format, 5,269 were used for training, 1,415 for validation, and 351 for testing.
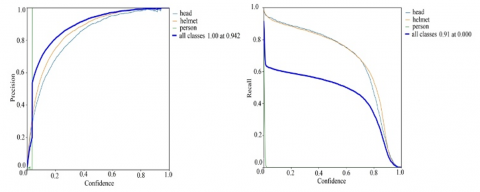
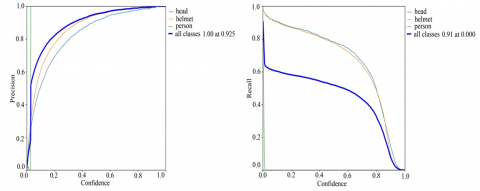
The method was trained and validated using a total of 6684 images for helmet detection. Only 10 epochs were run. After the training process, the model was analyzed with test data. A robust object detector should detect all real objects while only identifying objects of interest. According to Eqns. (2) and (3), lower FP values mean higher sensitivity, while lower FN provides higher recall. When the confidence threshold is dropped, a particular object detector may be deemed good if the precision stays high as recall increases. The precision curve and recall curve of the proposed model are shown in Figure 5. Precision and recall values are given as 0.942 and 0.91, respectively.
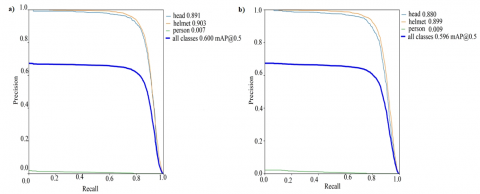
MobileNetv3 [28] is another architecture that can be used as a feature extraction network to create a lightweight architecture in the proposed pipeline due to its size and complexity characteristics. MobileNetv3 was included as the backbone and tested under the same conditions. The precision and recall curves of the model are shown in Figure 6. The model, in which images from the relevant dataset were used for training and validation, provided 0.925 precision and 0.91 recall values. Accordingly, the two modified models provide the same recall values, while ShuffleNetv2 provides slightly better precision.
The precision recall curves of the methods are shown in Figure 7 the dataset is divided into three categories: head, helmet, and person. The proposed method yielded 0.891 AP for the head class and 0.903 AP for the helmet. Although the performance values are very close to each other, ShuffleNetv2 showed better detection performance.
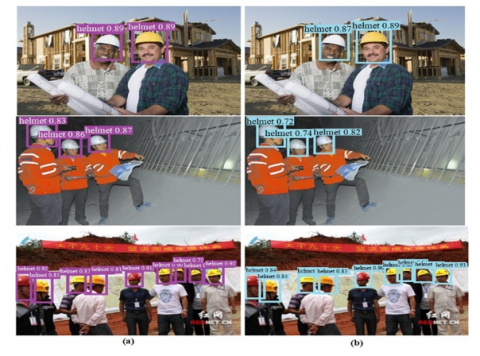
Models were tested with images from the relevant dataset. 351 images were used for the test. Figure 8 shows some accurate detection results for models to which the same test data was applied. Overall, the models showed similar detection results in most of the images.
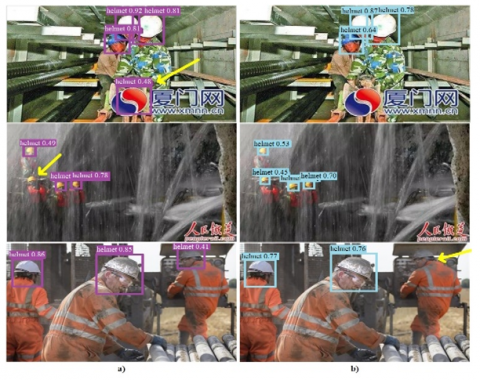
In some images, one model found all the relevant head and helmet objects in the image, while the other model did not find or incorrectly found all the objects. Some of the mentioned images are exemplified in Figure 9. In the figure, the first column shows a) the results of the ShuffleNetv2 network, the second column b) the results of the model that MobileNetv3 uses as the backbone. In the figure, in the image a) in the first line, an object without a helmet was found as a helmet. Objects in the same image were found to be correct by the other method b). The image in the second line was not found by the model using a helmet, ShuffleNetv2, but was found by the other model.
Figure 5. Precision curve and recall curve of the model
Figure 6. Precision curve and recall curve of model with MobileNetv3 as backbone
Figure 7. Precision-Recall curve of models with a) ShuffleNetv2, b) mobileNet v3 as backbone
Likewise, the model in which ShuffleNetv2 was used in the images in the 3rd line correctly identified the relevant objects in the image, while the other model could not find the helmet object. The missing parts are indicated by the yellow arrow. As a result, the models showed close performance in detecting accuracy in the relevant dataset. In terms of speed, the model using ShuffleNetv2 as the backbone completed the test process in 32.101 seconds. On the other hand, MobileNetv3 completed the test process in 30,908 seconds under the same conditions. Models have low size and complexity. Therefore, the training and testing processes were fast.
Figure 8. Some true detection results on the test data with a) ShuffleNet v2, and b) MobileNet v3 as backbone
Figure 9. Some failure detection results on the test data with a) ShuffleNetv2, and b) MobileNetv3 as backbone
Despite numerous safety inspections conducted over the years to maintain safe working conditions, construction remains one of the most dangerous industries, accounting for the percent of overall worker deaths. Common causes of construction site injuries include falls, slips, and trips. Worker injuries and deaths are largely due to the lack of use of personal protective equipment. Although this is controlled by security guards and inspectors, people's control is insufficient when there are large areas of work and large numbers of workers. For this reason, it should be constantly checked whether the helmet is worn or not.
Our work is similar to other research based on deep learning frameworks. In object-finding tasks, one-stage object detectors are less accurate than multi-stages [29]. On the other hand, single-stage detectors produce faster results than two-stage object detectors. The latest version of the YOLO family, the Yolov5 is fast with the advantage of being single-stage. It also achieves more accurate results thanks to the improvements made to previous versions. Therefore, the Yolov5 model was used in the study to control whether a hard hat is worn in order to provide a safe construction environment. The method was subjected to training, validation and testing processes and the results were reported. Our study achieved high accuracies in the Hardhat workers dataset.
The evaluations of some of the studies based on single and two-stage object detectors on the subject are as in Table 1. Different datasets and performance measures were used in the studies. Parameters such as the number of classes and the difficulty level of the image differ. Therefore, it is not possible to make an exact comparison. However, our study has been tested with accepted object finding evaluation criteria. The results obtained are of high accuracy. For these reasons, we believe that the use of the method will be beneficial in construction sites and other places where it is necessary to wear a helmet for safety.
The importance of job security is an undeniable fact. The use of helmets alone is not enough, especially in construction. The training performance of the applied model is directly related to the dataset. According to our research, there is no comprehensive dataset on occupational safety protective equipment. In future studies, we recommended that larger and more comprehensive datasets (including classes such as helmets, safety glasses, masks, gloves, shoes and boots) should be created and studied with these datasets.
Table 1. Comparison of some studies on helmet detection and the proposed method
|
Ref./ Year |
Data set/Class |
Method |
Performance values (%) |
|
[4]/2019 |
GDUT-HWD/5 |
SSD |
83.89 mAP |
|
[7]/2020 |
287 images/2 |
Faster RCNN |
82 AP |
|
[8]/2020 |
MIT Place /4 |
Faster RCNN |
70 Accuracy |
|
[9]/2020 |
Hardhat Wearing/2 |
SqueezeDet+MobileNet |
75 F1 score |
|
[10]/2020 |
Collected from public datasets /1 |
Yolov3 |
79.2 mAP |
|
[11]/2020 |
Hardhat Wearing /2 |
End to end CNN |
87.4 AP (with hardhat) 89.4 AP (without hardhat) |
|
[30]/2020 |
Pictor-v3/ 3 |
YOLO and CNN classifiers |
63.1 mAP |
|
[31]/2021 |
Hardhat Wearing Detection/5 |
Darknet53& improved BiFPN |
87.04 mAP |
|
[32]/2021 |
6,000 images collected from internet /2 |
Improved YOLOv5 |
92.24 Precision 96.27 Recall |
|
[33]/2021 |
6,045 images collected from internet /2 |
YOLOv5s, YOLOv5m YOLOv5l, YOLOv5x |
93.6 mAP, 94.3 mAP 94.4 mAP, 94.7 mAP |
|
Proposed method |
Hard Hat Workers/3 |
ShuffleNetv2+PANet+ YOLO |
94.2 Precision 91 Recall |
[1] Uzdil, O., Güllüoğlu, A.N. (2020). Türkiye İnşaat Sektöründe 2016 ve 2017 Yıllarında Meydana Gelen İş Kazalarının İstatistiksel Olarak Karşılaştırılması. International Journal of Advances in Engineering and Pure Sciences, 32(2): 137-144. https://doi.org/10.7240/jeps.555736
[2] Aile, T.C., Çalışma ve Sosyal Hizmetler Bakanlığı. (2019). İnşaat Sektöründe İş Sağlığı ve Güvenliği. http://www.guvenliinsaat.gov.tr/genelbilgi.html.
[3] Müngen, U. (2011). İnşaat Sektörümüzdeki Başlıca İş Kazası Tipleri. TMH, İnşaat Mühendisleri Odası, 496(5): 32-39.
[4] Wu, J., Cai, N., Chen, W., Wang, H., Wang, G. (2019). Automatic detection of hardhats worn by construction personnel: A deep learning approach and benchmark dataset. Automation in Construction, 106: 102894. https://doi.org/10.1016/j.autcon.2019.102894
[5] Fang, Q., Li, H., Luo, X., Ding, L., Luo, H., Rose, T.M., An, W. (2018). Detecting non-hardhat-use by a deep learning method from far-field surveillance videos. Automation in Construction, 85: 1-9. https://doi.org/10.1016/j.autcon.2017.09.018
[6] Wang, X., Niu, D., Luo, P., Zhu, C., Ding, L., Huang, K. (2020). A safety helmet and protective clothing detection method based on improved-Yolo V 3. In 2020 Chinese Automation Congress (CAC), pp. 5437-5441. https://doi.org/10.1109/CAC51589.2020.9327187
[7] Kim, D., Kong, J., Lim, J., Sho, B. (2020). A study on data collection and object detection using faster R-CNN for application to construction site safety. Journal of the Korean Society of Hazard Mitigation, 20(1): 119-126. https://doi.org/10.9798/KOSHAM.2020.20.1.119
[8] Saudi, M., Hakim, A., Ahmad, A., Saudi, M., Shakir, A. (2020). Image detection model for construction worker safety conditions using faster R-CNN. International Journal of Advanced Computer Science and Applications. https://doi.org/10.14569/IJACSA.2020.0110632
[9] Filatov, N., Maltseva, N., Bakhshiev, A. (2020). Development of hard hat wearing monitoring system using deep neural networks with high inference speed. In 2020 International Russian Automation Conference (RusAutoCon), pp. 459-463. https://doi.org/10.1109/RusAutoCon49822.2020.9208155
[10] Casuat, C.D., Merencilla, N.E., Reyes, R.C., Sevilla, R.V., Pascion, C.G. (2020). Deep-hart: An inference deep learning approach of hard hat detection for work safety and surveillance. 2020 IEEE 7th International Conference on Engineering Technologies and Applied Sciences (ICETAS). https://doi.org/10.1109/ICETAS51660.2020.9484208
[11] Wang, L., Xie, L., Yang, P., Deng, Q., Du, S., Xu, L. (2020). Hardhat-wearing detection based on a lightweight convolutional neural network with multi-scale features and a top-down module. Sensors, 20(7): 1868. https://doi.org/10.3390/s20071868
[12] Jagadeeswari, C., Nagamani. G, Sneha, B., NagaSatish, G. (2020). Hard hat detection using deep learning techniques. International Journal of Advanced Science and Technology, 29(11): 1292-1298. http://sersc.org/journals/index.php/IJAST/article/view/20830.
[13] Cengil, E., Çınar, A. (2021). Poisonous mushroom detection using YOLOV5. Turkish Journal of Science and Technology, 16(1): 119-127.
[14] Chen, Y., Zhang, C., Qiao, T., Xiong, J., Liu, B. (2021). Ship detection in optical sensing images based on YOLOv5. In Twelfth International Conference on Graphics and Image Processing (ICGIP 2020) (Vol. 11720, p. 117200E). International Society for Optics and Photonics. https://doi.org/10.1117/12.2589395
[15] Ma, N., Zhang, X., Zheng, H.T., Sun, J. (2018). Shufflenet v2: Practical guidelines for efficient CNN architecture design. In Proceedings of the European Conference on Computer Vision (ECCV), pp. 116-131. https://doi.org/10.48550/arXiv.1807.11164
[16] Zhang, X., Zhou, X., Lin, M., Sun, J. (2018). Shufflenet: An extremely efficient convolutional neural network for mobile devices. In Proceedings of the IEEE Conference on Computer Vision and Pattern Recognition, pp. 6848-6856. https://doi.org/10.48550/arXiv.1707.01083
[17] Lin, T.Y., Dollár, P., Girshick, R., He, K., Hariharan, B., Belongie, S. (2017). Feature pyramid networks for object detection. In Proceedings of the IEEE Conference on Computer Vision and Pattern Recognition, pp. 2117-2125. https://doi.org/10.48550/arXiv.1612.03144
[18] Bochkovskiy, A., Wang, C.Y., Liao, H.Y.M. (2020). Yolov4: Optimal speed and accuracy of object detection. arXiv preprint arXiv:2004.10934. https://doi.org/10.48550/arXiv.2004.10934
[19] Redmon, J., Farhadi, A. (2018). Yolov3: An incremental improvement. arXiv preprint arXiv:1804.02767. https://doi.org/10.48550/arXiv.1804.02767
[20] ultralytics. yolov5. Available online: https://github.com/ultralytics/yolov5, accessed on 18 May 2020.
[21] Hard Hat Workers Dataset. https://public.roboflow.com/object-detection/hard-hat-workers, accessed on 18 May 2022.
[22] Zhao, Z.Q., Zheng, P., Xu, S.T., Wu, X. (2019). Object detection with deep learning: A review. IEEE Transactions on Neural Networks and Learning Systems, 30(11): 3212-3232. https://doi.org/10.48550/arXiv.1807.05511
[23] Padilla, R., Passos, W.L., Dias, T.L.B., Netto, S.L., da Silva, E.A.B. (2021). A comparative analysis of object detection metrics with a companion open-source Toolkit. Electronics 2021, 10: 279. https://doi.org/10.3390/electronics10030279
[24] Powers, D.M. (2020). Evaluation: from precision, recall and F-measure to ROC, informedness, markedness and correlation. arXiv preprint arXiv:2010.16061. https://doi.org/10.48550/arXiv.2010.16061
[25] HamidiSepehr, A., Mirnezami, S.V., Ward, J.K. (2020). Comparison of object detection methods for corn damage assessment using deep learning. Transactions of the ASABE, 63(6): 1969-1980. https://doi.org/10.13031/trans.13791
[26] Padilla, R., Netto, S.L., da Silva, E.A. (2020). A survey on performance metrics for object-detection algorithms. In 2020 International Conference on Systems, Signals and Image Processing (IWSSIP), pp. 237-242. https://doi.org/10.1109/IWSSIP48289.2020.9145130
[27] Li, Y., Velipasalar, S. (2020). Weighted average precision: Adversarial example detection in the visual perception of autonomous Vehicles. arXiv preprint arXiv:2002.03751. https://doi.org/10.1109/IWSSIP48289.2020.9145130
[28] Howard, A., Sandler, M., Chu, G., et al. (2019). Searching for mobilenetv3. In Proceedings of the IEEE/CVF International Conference on Computer Vision, pp. 1314-1324. https://doi.org/10.48550/arXiv.1905.02244
[29] Jiao, L., Zhang, F., Liu, F., Yang, S., Li, L., Feng, Z., Qu, R. (2019). A survey of deep learning-based object detection. IEEE Access, 7: 128837-128868. https://doi.org/10.1109/ACCESS.2019.2939201
[30] Nath, N.D., Behzadan, A.H., Paal, S.G. (2020). Deep learning for site safety: Real-time detection of personal protective equipment. Automation in Construction, 112: 103085. https://doi.org/10.1016/j.autcon.2020.103085
[31] Zhang, C., Tian, Z., Song, J., Zheng, Y., Xu, B. (2021). Construction worker hardhat-wearing detection based on an improved BiFPN. In 2020 25th International Conference on Pattern Recognition (ICPR), pp. 8600-8607. https://doi.org/10.1109/ICPR48806.2021.9412103
[32] Tan, S., Lu, G., Jiang, Z., Huang, L. (2021). Improved YOLOv5 network model and application in safety helmet detection. In 2021 IEEE International Conference on Intelligence and Safety for Robotics (ISR), pp. 330-333. https://doi.org/10.1109/ISR50024.2021.9419561
[33] Zhou, F., Zhao, H., Nie, Z. (2021). Safety Helmet Detection Based on YOLOv5. In 2021 IEEE International Conference on Power Electronics, Computer Applications (ICPECA), pp. 6-11. https://doi.org/10.1109/ICPECA51329.2021.9362711