Aida Fadaeian | Akram Esvand Rahmani* | Reza Javid
© 2021 IIETA. This article is published by IIETA and is licensed under the CC BY 4.0 license (http://creativecommons.org/licenses/by/4.0/).
OPEN ACCESS
Skin cancer is the most common cancer, accounting for 75% of all skin cancers worldwide. Malignant melanoma is the most invasive type of skin cancer, which is deadly. Some techniques have been investigated to diagnose skin diseases using skin tissue classification and diagnosis models and skin recognition approaches using colors based on image retrieval methods. In this regard, image processing techniques and classification methods are intelligent. The purpose of this method, diagnosing melanoma skin cancer using image processing. In the proposed method, after collecting the dataset, the boundary to separate the skin lesion from the background was specified. Then in the next step, the analysis was performed using Empirical wavelet transform (EWT). Then the color, texture, and shape features were extracted. In the next step, the feature was selected by Gray Wolf meta-heuristic algorithm using ranking models and the disease was classified into two categories, namely normal and abnormal. The database used in this study contains 594 dermatoscopic images with a resolution of 512 × 768 pixels, 476 images with normal spots, and 88 images with abnormal spots caused by melanoma. The evaluation results revealed that the proposed method had an accuracy of 97.25, indicating its significant performance compared to other methods. The contribution of the results of the proposed method can be very useful and valuable in the future for early detection of skin cancer.
malignant melanoma, shape features, texture, Gray Wolf meta-heuristic algorithm, dermatoscopic images
In recent years, skin cancer has become one of the most dangerous forms of cancer in humans. Skin cancer is the most common type of cancer, accounting for at least 40% of cancers worldwide. This type of cancer is prevalent among individuals with fair skin. The most common type is non-melanoma skin cancer, affecting at least 2-3 million persons per year. However, this is an approximate estimate since exact statistics are not available. In non-melanoma skin cancers, about 80% of cases are basal cell carcinomas, and 20% of cases are squamous cell carcinomas. Basal cell carcinoma and squamous cell carcinoma rarely lead to death. In the United States, less than 0.1% of cancer deaths are caused by this particular type of cancer. Melanoma was reported in 232,000 persons worldwide in 2012, resulting in 55,000 deaths. The highest rates of melanoma in the world are found in Australia and New Zealand. The three most common types of skin cancer have become more common in the last twenty to forty years, especially in regions where white people reside [1].
Malignant melanoma is a dangerous and deadly type of skin cancer. The definite treatment of this disease is possible when a specialist doctor can diagnose it correctly and promptly. In this case, this disease can be definitely treated with a simple incision. This method, which is an invasive method and brings the patient pain and suffering, requires sampling the wound surface [2].
Although many studies have been conducted with melanoma images to diagnose skin disease, the results of which are not satisfactory or accurate enough. Accordingly, after collecting the data set in the proposed method, the data was preprocessed by the median filter. Then, in the next step, the images of the thresholding method were classified.
Because the accurate ocular diagnosis of lesions, especially in the early stages of the disease, is challenging and impossible in some cases, the timely initiation of the treatment process has a direct impact on reducing deaths from skin cancer, so processing techniques Helping to improve the boundary is always one of the topics of recent research. The problem in this research is to present a new method for diagnosing skin lesions and classifying them.
In the next step, after analyzing the images, the experimental violet conversion was performed at three levels. Then the color, texture, and shape features were extracted. Finally, the feature selection procedure was performed using the Gray Wolf meta-heuristic algorithm, and the type of disease was classified into two categories, normal and abnormal [3].
Accordingly, after collecting the data set in the proposed method, the data was preprocessed by the intermediate filter. In the next step, the images of the threshold method were classified. Then the images were analyzed using the Empirical wavelet transform (EWT) at three levels. Then the color, texture, and shape features were extracted. Finally, feature selection procedure was performed using the Gray Wolf meta-heuristic algorithm, and the disease was classified into two categories, namely normal and abnormal.
The organization of the article is discussed in the second section. In the third part, the proposed method and the fourth part of the relevant experiments and finally the last part, the conclusion will be presented.
In 2007, Celebes et al. [4] developed a system to detect skin cancer by using dermoscopic imaging. In this study, a method was used based on the JSEG algorithm to identify lesion boundaries. Then two categories of the features, including color and texture, were extracted from the lesion using GLCM, and finally, an SVM classification was used to diagnose malignancies. This system was applied to databases containing 655 dermoscopic images, and the results revealed that the superior system had an accuracy of 90%.
In 2010, another algorithm [5] was proposed for the diagnosis of melanoma skin tumors. In this study, violet conversion was used to enhance imaging in preprocessing microscopy. A helical algorithm was used to segment the lesions, and then the features, including irregularity, asymmetry, color dispersion, and color dependence, were extracted based on the ABCD rules. The MDA_FKT conversion was used to reduce the feature dimensions, and the classification was performed using the Bayesian method. The proposed system's identification can be adjusted with a solemn style between false positive and false negative, and the results show that the false-negative rate of 1.89% is achievable at the total accuracy rate of 82.55%.
In 2013, another algorithm [6] was introduced, in which the fast intermediate filtering was used as preprocessing. Then, using the thresholding method and maximum entropy, the lesion was separated from the image using the GLCM method, and features such as contrast, correlation, and asymmetry were extracted from the image. Finally, a precursor neural network performed the classification operation. The results indicated that this algorithm had an accuracy of 88%.
In 2013, another study [7] was conducted to examine skin cancer diagnosis by both national and local methods. This research pursued two objectives: determining the best diagnostic method (global or local) and determining the best color or texture features used in the designed experiments of three different classifications of Knn, Svm, and Adaboost. Moreover, different combinations of the features were examined, and significant results were obtained. The results showed that a simple Knn classifier could achieve acceptable results, and that the color features had a better performance compared to the textile features. Furthermore, a small number of features are often sufficiently accurate for the classification and guarantee an increase in the generality of the system, compared to a large number of features. The results also showed that global and local results can be achieved from both detection methods, with the difference that the local method requires more time.
In another study in 2013 [7] the role of shape features in the classification of images in dermoscopy was investigated. The proposed algorithm consists of three steps. The image is first manually sliced by a dermatologist and automated (endowment threshold). Then four types of shape features were extracted from the binary image of the previous step. These features were then applied to an Adaboost band, and skin lesions were divided into benign and malignant. The results revealed that the SS descriptor had the best performance regardless of the type of segmentation. Moreover, with automatic sizing, the best performance was achieved by the simultaneous use of SS and MI descriptors. However, when using manual segmentation, the best performance is achieved if the SS, MI, and SR features are used simultaneously, which leads to a sensitivity of 92% and a specificity of 78% [8].
The benefits of using tissue features in diagnosing squamous cell carcinoma and HPV virus by CT imaging were examined, and the CT samples were taken from 40 patients with squamous cell carcinoma from 2009 to 2013 [9]. Furthermore, the relationship and the difference between this cancer and this virus were examined.
Kawahara et al. [10] used the hybrid neural network's pre-trained system, which is a robust network, and a method requiring no conventional segmentation was presented. The AlexNet system was used to extract the features and tested on 1300 samples, including ten different skin lesions, with an accuracy of 75%.
Deep convolutional neural networks were used to classify skin cancers rapidly [11]. The AlexNet model, which has fewer training parameters and higher accuracy, was used to extract the features, and the classification used the ECOC SVM model. This study on 3753 dermoscopic images included four types of cancer, with 82% accuracy in choosing the right type of cancer.
Wang et al. [12] designed a superficial hybrid neural network for the in-depth identification of actinic keratosis lesions. This network was based on the IOS platform. In this study, the dermoscopic images of seven skin diseases were used. This network provided a better result than other neural network models and had an accuracy rate of 92%.
In the proposed method, after collecting data and information, the data preprocessing step is performed. Pre-processing and image quality enhancement will be performed to eliminate noise and artifacts that are added to the original image while recording data. These noises include hair, bubbles, the effect of fat on the skin, motion artifacts during recording, and other factors that the middle filter is used to remove. Then the image resizing operation is performed for better performance and data uniformity. The next step involves segmenting the images. Segmentation is one of the most important steps in image processing, because if segmentation is appropriate, the next steps will be performed with higher accuracy and efficiency [13].
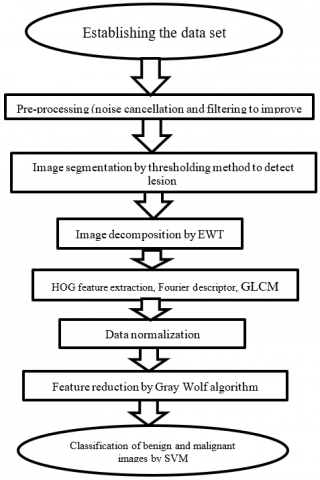
Therefore, there are several methods for segmentation of medical images, which in the proposed method of thresholding to Due to the uniform pink background and the high contrast between the background and the foreground. The next step is to extract the appropriate and efficient features from different parts of the image. For this reason, in order to better extract the linear and non-linear statistical features, after segmentation by thresholding method, the experimental wavelet is divided into four layers, i.e. one approximation layer and three partial layers in three levels. Are extracted from the approximation layer. These features include shape and texture features including directional histogram algorithm and Fourier transform and gray surface correlation matrix and color features [14]. In the last step, the Gray Wolf Optimization (GWO) algorithm is used to select the distinctive features. Finally, the optimal properties are divided into normal and abnormal categories by SVM. The flowchart of the proposed method is shown in Figure 1.
Figure 1. Proposed method
3.1 Data set
One thousand melanoma images and one thousand melanocytic mole images were selected from the collection of dermoscopic images (Human against the machine with 10000 training images, HAM10000). Figure 2 presents four images as examples of melanoma and melanocytic mole images. First, 900 images were randomly selected from each case as training data, and the remaining 100 images were considered as test data [15].
Figure 2. Four images as an example of melanoma images
3.2 Pre-processing (noise cancellation by median filter)
It is usually necessary to perform a high level of noise reduction in the image before performing the higher-level processing steps. Median filtering is a nonlinear digital filtering method often used to eliminate noise from images or signals. Image noise is usually the background for other changes and identifications on the images. The filtering operation is performed so that it regards the neighborhood around the pixel and considers the median of the numbers in that neighborhood as the conversion of that pixel. Therefore, in this step, a median filter with a 5 × 5 neighborhood is used, which is applied to the image related to the green channel, eliminates the noise inside the relevant image, and finally improves the image quality.
3.3 Image segmentation by thresholding method to detect lesion
Otsu thresholding is categorized as the subgroup of clustering-based thresholding methods. This method segments images based on the optimal threshold t to divide the image into two separate classes (black and white). The optimal threshold is to find the value of t, which creates the maximum uniformity in the intensity function in both classes and minimizes the variance of the intensity distribution function in pixels between the two classes [15].
$\sigma_{\mathrm{w}}^{2}(\mathrm{t})=\omega_{1}(\mathrm{t}) \cdot \sigma_{1}^{2}(\mathrm{t})+\omega_{2}(\mathrm{t}) \cdot \sigma_{2}^{2}(\mathrm{t})$ (1)
$\begin{aligned} \sigma_{\mathrm{b}}^{2}(\mathrm{t})=\sigma^{2}(\mathrm{t})-\sigma_{\mathrm{w}}^{2}(\mathrm{t}) \\=& \omega_{1}(\mathrm{t}) \cdot \omega_{2}(\mathrm{t})\left[\mu_{1}(\mathrm{t})-\mu_{2}(\mathrm{t})\right]^{2} \end{aligned}$ (2)
The probability of the occurrence of class one for the desired threshold t, (w1 (t), is calculated in Eq. (3):
$\omega_{1}=\sum_{0}^{t} p(i)$ (3)
The mean value for the class one is calculated by Eq. (4):
$\mu_{1}(\mathrm{t})=\left[\sum_{0}^{\mathrm{t}} \mathrm{p}(\mathrm{i}) \cdot \mathrm{x}(\mathrm{i})\right] / \omega_{1}$ (4)
where, (x (i) is the value at the center of the main histogram. It can also calculate the values (ω2 (t) and (μ2 (t). Now, after obtaining the initial boundary, we examine the thresholding method. Suppose we have an intensity histogram corresponding to the image f (x, y), which consists of light objects on a dark background so that the intensity levels of the pixels of the elements and the background can be considered in two separate categories. Evidently, the threshold value t must be selected to separate the two categories to separate the background objects. Accordingly, any pixel (x, y) with f (x, y)>T is called an object pixel, and other points are called background pixels. In other words, the threshold image, g (x, y), is expressed in Eq. (5).
$g(x, y)=\left\{\begin{array}{l}a \text { if } f(x, y)>T \\ b \text { if } f(x, y) \leq T\end{array}\right.$ (5)
Thresholding is one of the most convenient image segmentation methods. By applying a thresholding method to a grayscale image, a binary image is obtained, which delineates the objects' boundaries in the image with appropriate accuracy. In the proposed method, the Otsu thresholding method was used to detect the lesion around the skin to distinguish light background and darker background. If the value f (x, y) is greater than the threshold value, which is the same as the brightness or intensity value, it is one; otherwise, it is 0 in the coordinates f (x, y).
3.4 Decomposition Empirical Wavelets Transform (EWT)
In the EMD (Empirical Mode Decomposition) method, an algorithm helps to reach the IMF of the signal; this algorithm is indeed a method for identifying the frequency components of nonlinear and non-stationary signals. However, this nonlinear algorithm's main drawback is that it has no closed mathematical relation, so we cannot predict or even estimate the output and behavior of this algorithm. Besides, EMD is a method based on sequential and iterative calculations that usually take a long time. Sometimes we want to roughly predict the shape of our output before doing the calculations [16]. However, the EMD method does not allow us to do so under these circumstances. EWT is a new method building suitable bank filters (similar to DWT) to extract signal-forming modes. This method leads us to a new violet converter, called the Imperial Violet Transform. The most crucial difference between this conversion and EMD is that it has a closed relationship, which allows us to estimate the behavior and even the overall shape of the conversion output. Now we want to examine how this conversion behaves, as shown in Figure 3.
Figure 3. Empirical wavelet transform method
At EWT, we want the signal to be split into its constituent IMFs using transient filters designed using Meyer's mother violet. For this purpose, we must determine the bandwidth range of the filters correctly. But how? The Fourier transform and the EMD algorithm behave similarly, so the best option to determine the bandwidth range of filters is to use the frequency spectrum obtained from the Fourier transform. The spectrum is divided so that the maximum points or peaks in the frequency spectrum represent the main components of the signal. This means that these components must be present within the filter range.
The question now is which area between the two peaks should be selected for the division. For this purpose, the lowest local maximums between two consecutive maximums are selected as the boundaries between the intervals. In the next step, having the ranges between the intervals, the two main parameters in violet conversion, namely scaling Function and Function Wavelet, are formed. As mentioned, these two functions had been rewritten according to the Violet Meyer function [17].
Having the scaling Function and Function Wavelet relationships, we can extract the Approximate coefficients and Detail coefficients of the Violet function, calculated as follows:
$\mathrm{W}\left(\mathrm{I}_{\mathrm{i}}\right)(0, mathrm{p})=\mathfrak{F}_{\omega}^{-1}\left(\mathfrak{V}_{\mathrm{p}}\left(\mathrm{f}_{\mathrm{i}}\right)\overline{(\omega) \mathfrak{F}_{\mathrm{P}}\left(\phi_{1}\right)(\omega)}\right)$ (6)
The Details-layers of the image Ii(p) is defined by Eq. (7):
$\mathrm{W}\left(\mathrm{I}_{\mathrm{i}}\right)(\mathrm{m}, \mathrm{p})=\mathfrak{F}_{\mathrm{p}}^{-1}\left(\mathfrak{F}_{\mathrm{p}}\left(\mathrm{I}_{\mathrm{i}}\right)(\omega) \overline{\mathfrak{F}_{\mathrm{P}}\left(\varphi_{\mathrm{m}}\right)(\omega)}\right)$ (7)
Finally, the inverse of a two-dimensional EWT is defined by Eq. (8):
$\mathrm{I}_{\mathrm{i}}(\mathrm{p})=\mathrm{W}\left(\mathrm{I}_{\mathrm{i}}\right)(0, \mathrm{p}) \diamond\left(\phi_{1}\right)(\mathrm{p})+\sum_{\mathrm{m}=1}^{\mathrm{M}-1} \mathrm{~W}\left(\mathrm{I}_{\mathrm{i}}\right)(\mathrm{m}, \mathrm{p}){\diamond} \varphi_{\mathrm{m}}(\mathrm{p})$ (8)
$\diamond$ Operation is convolution.
3.5 Feature extraction
In this section, statistical features, including shape, texture (Hog, Fourier transform, and GLCM), and color, were extracted from DWT's surface decomposed in the previous section.
3.5.1 ABCD shape features
Feature extraction is based on ABCD skin and motion law ABCD stands for asymmetry, boundary structure, color change, and diameter, used in the proposed method to extract the morphological features of skin lesions.
(1) Boundary structure
The boundary structure can be analyzed by calculating the compact index, fractal dimensions, and edge fracture. Also, the compact index is used to measure the most popular shape of obstacles that estimate two-dimensional objects alike. However, along the boundary, this measurement is highly sensitive to noise. The CI value is determined using Eq. (9).
$C I=\frac{P_{L}^{2}}{4 \pi A_{L}}$ (9)
(2) Fractal dimensions
The fractal dimension is an integer. For line, record, and cube, the values are 1, 2, and 3, respectively; however, in the case of fractal dimensions, it may have a fractional value. By using the box-counting method, fractal dimensions can be calculated. In the proposed method, the image is divided into boxes.
(3) Fracture of the edge
The sudden fracture of the edge is nothing but irregular borders. The lesion with irregular borders is highly different in the radial distance. Regular estimation of lesion fences is calculated by analyzing the radial distance difference of the distribution:
$C_{r}=\frac{\frac{1}{P_{L}} \sum p \in C\left(d_{2}\left(p, G_{L}\right)-m_{d}\right)^{2}}{m_{d}^{2}}$ (10)
where, md is the average distance, and d2 is the center point and the fence of the lesion.
3.5.2 HOG tissue features
The HOG algorithm was invented in 2005 by Naveen Dalal. The HOG algorithm is a method to extract local features in images, and it can be used in applications such as face recognition, pedestrian detection, etc. In the HOG algorithm, the input image is first divided into cells, and the gradient is calculated on the pixels of these cells according to the size (sqrt (x ^ 2 + y). ^ 2). In the gradients' direction, a histogram is formed for each cell, and these histograms are joined together. The result is a descriptor consisting of Gradient direction histograms. Since this descriptor focuses on gradient information, or more precisely, on edges, this algorithm is used to extract segmented features. Because it extracts the slope and direction features at the edges, 4*4 blocks are used in the proposed method to obtain them in more details.
3.5.3 GLCM features
In this section, feature extraction is performed using the Gray Surface Event Matrix (GLCM). The features included entropy, contrast, correlation, and energy. Before explaining this step, the gray surface matrix is first described. Gray surface matrix is a N × N matrix with a distance and a direction. This matrix is tabular, often combining different levels of pixel gray in an image. For example, if we have a matrix in which the number of light intensity levels is set from zero to N-1, the largest number inside the matrix is the number of rows and columns of the matrix as the gray surface of that number simultaneously. If the highest level of brightness in the corresponding image is, for example, the value of eight pixels, the gray surface matrix becomes an 8 * 8 matrix. The direction and distance defined in this matrix should be considered, and the gray surface matrix should be quantified based on these parameters [18].
According to what mentioned, the gray surface correlation matrix can be used to extract tissue features. Accordingly, in this stage, the texture features of contrast, entropy, energy, and uniformity simultaneously with the gray surface correlation matrix are extracted from inside the image segmented in the previous step. The features extracted from the matrix also include energy, contrast, uniformity, and entropy. These features are derived from Eqns. (11), (12), (13), and (14). These features are extracted for classification, which is obtained by segmenting the retinal structure and tissue analysis. These features include the texture features of contrast, entropy, and energy [19].
Contrast $=\sum_{i=0}^{N-1} \sum_{i=0}^{N-1}(i-j)^{2} p_{i j}$ (11)
pij is an element of the gray event matrix. A uniformity that measures the proximity of the element distribution in GLCM compared to the GLCM diameter is mathematically represented by Eq. (12):
Homogeneit $=\sum_{i=0}^{N-1} \sum_{i=0}^{N-1} \frac{P_{i j}}{(1+|i-j|)}$ (12)
Entropy is a measure of the distribution randomness of the values of the gray surfaces of an image pixel, calculated by Eq. (13):
Entropy $=-\sum_{i}^{L} p\left(z_{i}\right) \log _{2} p\left(z_{i}\right)$ (13)
The resulting energy of the image, which is the sum of the square elements in the GLCM matrix, is expressed as Eq. (14).
Energy $=\sum_{i=0}^{N-1} \sum_{j=0}^{N-1} P_{i j}{ }^{2} \mathrm{Ref}$ (14)
pij is an element of the gray event matrix.
3.5.4 Data normalization
To normalize features, feature normalization is usually used to achieve higher accuracy by using the same class features. To this end, Eq. (15) is used.
$\hat{x}=\frac{x_{i}-x_{\min }}{x_{\max }-x_{\min }}$ (15)
where, $x_{i}$ is the attribute's current value, and $x_{\min }$ and $x_{\max }$ are the minimum and maximum attribute values, respectively. The $\hat{x}$ values are the same as the normalized features.
3.5.5 Feature selection by Gray Wolf Optimization (GWO)
Mirjalili et al. Created this algorithm in 2014. Inspired by the behavior of gray wolves, this algorithm repeats the pattern of wolf hunting and searching. Wolves live in a group called a group. They maintain a rigid hierarchy that is reflected in this algorithm. Gray wolves are divided into four groups called alpha (α), beta (β), delta (δ), and omega (ω). Alpha is at the top of the hierarchy and is responsible for decision making. The group obeys the wolves' decisions. Beta is the second level of wolf involved in helping the alpha group in decision-making and other activities. In the absence of alpha, alpha group’s responsibility is effectively handled by the beta group. Delta wolves are in the third level of the hierarchy, which includes hunters, observers, and guards. In case of any danger, they spread the warning throughout the package. Omega wolves are at the bottom. They act as stimulants and are allowed to eat only after three closed rows [20].
In this study, feature reduction was performed by GWO, the fit function of which is shown in Eq. (16).
$\theta=V-P$ (16)
In the above equation, P is the reciprocal monopoly between the selected features. On the other hand, V is the reciprocal monopoly between the selected attributes and the labels of the respective classes.
3.6 Classification of SVM
The kernel method, of which the support vector machine is one, consists of two parts: (a) one-part mapping the input data into the vector space called the feature space, and (b) another part called the learning algorithm discovering linear patterns in the concerned feature. Input data is written in a larger dimension using core functions so that the similarity measurement criterion can be determined based on internal parameters. The linear classifier is described only based on the internal parameters of the data used in this method.
The tests were performed on the data set by MATLAB 2019 software, 4G RAM, and a seven-core CPU. In the following, several criteria (namely accuracy, sensitivity, and specificity) are introduced to measure the proposed algorithm's performance in classifying images. Then the proposed method is compared with other methods.
4.1 Preprocessing and segmentation results
In this section, the preprocessing and segmentation results of the proposed method are shown in Figure 4.
Figure 4. Pre-processing and segmentation
As shown in Figure 4, after applying the median filter on the image and applying the edge filter on the image, a binary image is obtained in the next step, which has led to a perfect segmentation of the image. However, this process takes place on all available data on melanoma.
4.2 Decomposition by EWT results
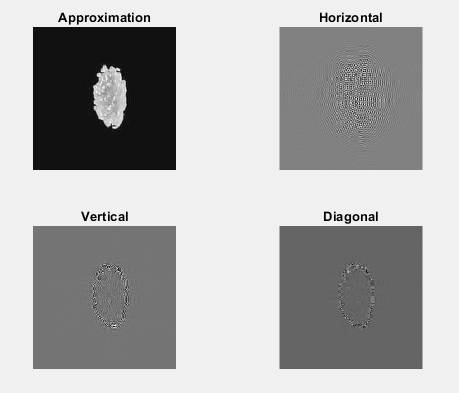
In this section, the results of segmented image analysis by EWT are presented. Decomposition by EWT is performed by four coefficients of approximation, horizontal component, vertical and diagonal. This makes it possible to extract better features at the degraded partial levels, which significantly affects the classification performance. It should be noted that the third level carried out the decomposition. Figure 5 shows such a breakdown.
In Figure 5, in the proposed method, the layers decomposed by the Mir filter bank and the Littlewood-Paley conversion are presented.
Also, shown in Figure 6, uniform convergence is achieved after repeating the function 160 times. This leads to the selection of optimal features.
Figure 5. Decomposed image by EWT
Figure 6. Fit function of proposed method
4.3 Results of the proposed method classifications
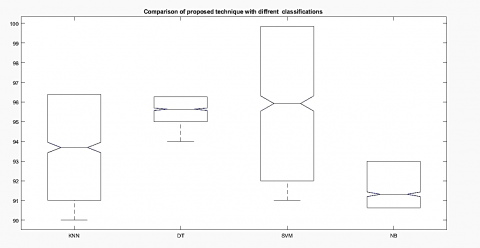
In this section, the proposed method is compared with different classifications, as illustrated in Figure 7.
The proposed method achieves the best performance by using the SVM classifier. The same decision tree is in the second place in the classification process in terms of speed. The KNN method is in the third place, and New Business is ranked last since it usually provides better results for multi-class classification, which has a lower performance compared to the other categories. Table 1 compares other criteria for different categories.
Figure 7. Performance of different classifications using the proposed method
Table 1. Compares other criteria for different categories
|
Technique |
Melanoma Dataset |
|
|
|
|
Proposed method with all the features |
Classifier |
Accuracy |
Sensitivity |
Specificity |
|
Decision Tree |
96/32% |
98/20% |
95/40% |
|
|
SVM` |
96/50% |
98/39% |
96/47% |
|
|
KNN |
93/90% |
94/10% |
93/09% |
|
|
Naïve Bayes |
90/47% |
91/85% |
89/70% |
|
|
Proposed method with dimensional reduction |
Decision Tree |
97/01% |
98/22% |
96/25% |
|
SVM` |
97/25% |
98/66% |
97/86% |
|
|
KNN |
94/10% |
95/27% |
93/58% |
|
|
Naïve Bayes |
91/20% |
92/78% |
92/75% |
|
4.4 Results of the proposed method classifications
In this section, the proposed method is compared with other methods [21-25], as shown in Figure 8.
Figure 8. Compare the proposed method with other methods
As presented in Figure 8, the proposed method has an outstanding performance compared to other methods. This is while the closest method to the proposed method is the method [23], which is also considered as the average accuracy.
In the present study, a new method using cancerous skin images to classify images was proposed to identify skin lesions and develop a highly functional imaging system. In this method, image analysis was used by EWT, which had an efficient effect on the feature extraction problem by the analyzed layers. In the next step, with the help of combining shape and texture features, the images' features were extracted. Then, after reducing the dimensions, Melanoma images were classified accurately. In future work, the EWT method can be tested with other parameters and Wavelet transformations.
[1] Chaturvedi, S., Gupta, K. (2019). Skin Lesion analyser: An efficient seven-way multi-class skin cancer classification using mobilenet. Advances in Intelligent Systems and Computing, pp. 1-11. https://doi.org/10.1007/978-981-15-3383-9_15
[2] Hekler, A., Utikal, J.S., Enk, A.H., Hauschild, A., Weichenthal, M., Maron, R.C. (2019). Superior skin cancer classification by the combination of human and artificial intelligence. European Journal of Cancer, 120: 114-121. https://doi.org/10.1016/j.ejca.2019.07.019
[3] Manjunath, R., Calvin, J.F., Sreekumar, K. (2020). Accuracy assessment & classification of keratosis skin lesion images using feature extraction & classification Algorithms-LBP, LDP& HOG. Journal of Innovative Technology and Exploring Engineering (IJITEE), 9: 397-403. https://doi.org/10.35940/ijitee.F3737.049620
[4] Celebi, M.E., Kingravi, H.A., Uddin, B., Iyatomi, H., Aslandogan, Y.A., Stoecker, W.V., Moss, R.H. (2007). A methodological approach to the classification of dermoscopy images. Computerized Medical imaging and graphics, 31(6): 362-373. https://doi.org/10.1016/j.compmedimag.2007.01.003.
[5] Parolin, A., Herzer, E., Jung, C.R. (2010). Semi-automated diagnosis of melanoma through the analysis of dermatological images. In 2010 23rd SIBGRAPI Conference on Graphics, Patterns and Images, pp. 71-78. https://doi.org/10.1109/SIBGRAPI.2010.18
[6] Jaleel, J.A., Salim, S., Aswin, R.B. (2013). Computer aided detection of skin cancer. In 2013 International Conference on Circuits, Power and Computing Technologies (ICCPCT), pp. 1137-1142. https://doi.org/10.1109/ICCPCT.2013.6528879
[7] Ahmed, H.M., Al-azawi, R.J., Abdulhameed, A.A. (2018). Evaluation methodology between globalization and localization features approaches for skin cancer lesions classification. In Journal of Physics: Conference Series, 1003(1): 012029. https://doi.org/10.1088/1742-6596/1003/1/012029
[8] Barata, C., Ruela, M., Francisco, M., Mendonça, T., Marques, J.S. (2013). Two systems for the detection of melanomas in dermoscopy images using texture and color features. IEEE systems Journal, 8(3): 965-979. https://doi.org/10.1109/JSYST.2013.2271540
[9] Buch, K., Fujita, A., Li, B., Kawashima, Y., Qureshi, M.M., Sakai, O. (2015). Using texture analysis to determine human papillomavirus status of oropharyngeal squamous cell carcinomas on CT. American Journal of Neuroradiology, 36(7): 1343-1348. https://doi.org/10.3174/ajnr. A4285
[10] Kawahara, J., BenTaieb, A., Hamarneh, G. (2016). Deep features to classify skin lesions. In 2016 IEEE 13th international symposium on biomedical imaging (ISBI), pp. 1397-1400. https://doi.org/10.1109/ISBI.2016.7493528
[11] Dorj, U.O., Lee, K.K., Choi, J.Y., Lee, M. (2018). The skin cancer classification using deep convolutional neural network. Multimedia Tools and Applications, 77(8): 9909-9924. https://doi.org/10.2196/11936
[12] Wang, L., Chen, A., Zhang, Y., Wang, X., Zhang, Y., Shen, Q., Xue, Y. (2020). AK-DL: A shallow neural network model for diagnosing actinic keratosis with better performance than deep neural networks. Diagnostics, 10(4): 217. https://doi.org/10.3390/diagnostics10040217
[13] Harangi, B. (2018). Skin lesion classification with ensembles of deep convolutional neural networks. Journal of Biomedical Informatics, pp. 25-32. https://doi.org/10.1016/j.jbi.2018.08.006
[14] Herment, A., Kachenoura, N., Lefort, M., Bensalah, M., Dogui, A., Frouin, F. (2010). Automated segmentation of the aorta from phase contrast MR images: Validation against expert tracing in healthy volunteers and in patients with a dilated aorta. Journal of Magnetic Resonance Imaging: An Official Journal of the International Society for Magnetic Resonance in Medicine, 31(4): 881-888. https://doi.org/10.35940/ijitee.F3737.049620
[15] Chiem, A., Al-Jumaily, A., Khushaba, R.N. (2007). A novel hybrid system for skin lesion detection. In 2007 3rd International Conference on Intelligent Sensors, Sensor Networks and Information, pp. 567-572. https://doi.org/10.1109/ISSNIP.2007.4496905
[16] Gilles, J. (2013). Empirical wavelet transform. IEEE Transactions on Signal Processing, 61(16): pp.3999-4010, https://doi.org/10.1109/TSP.2013.2265222
[17] Gilles, J., Tran, G., Osher, S. (2014). 2D empirical transforms. Wavelets, ridgelets, and curvelets revisited. SIAM Journal on Imaging Sciences, 7(1): 157-186. https://doi.org/10.1137/130923774
[18] Herment, A., Kachenoura, N., Lefort, M., Bensalah, M., Dogui, A., Frouin, F. (2010). Automated segmentation of the aorta from phase contrast MR images: validation against expert tracing in healthy volunteers and in patients with a dilated aorta. Journal of Magnetic Resonance Imaging: An Official Journal of the International Society for Magnetic Resonance in Medicine, 31(4): 881-888. https://doi.org/10.1002/jmri.22124
[19] Sujji, G.E., Lakshmi, Y.V.S., Jiji, G.W. (2013). MRI brain image segmentation based on thresholding. International Journal of Advanced Computer Research, 3(1): 97-101. https://doi.org/10.1109/I-SMAC.2017.8058355
[20] Emary, E., Yamany, W., Hassanien, A.E., Snasel, V. (2015). Multi-objective gray-wolf optimization for attribute reduction. Procedia Computer Science, 65: 623-632. https://doi.org/10.1016/j.procs.2015.09.006
[21] Chaturvedi, S.S., Gupta, K., Prasad, P.S. (2020). Skin lesion analyser: An efficient seven-way multi-class skin cancer classification using MobileNet. In International Conference on Advanced Machine Learning Technologies and Applications, pp. 165-176. https://doi.org/10.1007/978-981-15-3383-9_15
[22] Hekler, A., Utikal, J.S., Enk, A.H., Hauschild, A., Weichenthal, M., Maron, R.C. (2019). Superior skin cancer classification by the combination of human and artificial intelligence. European Journal of Cancer, 120: 114-121. https://doi.org/10.1016/j.ejca.2019.07.019
[23] Rao, M., Fernandez, C.J., Sreekumar, K. (2020). Accuracy Assessment & Classification of Keratosis Skin Lesion Images using Feature Extraction & Classification Algorithms-LBP, LDP& HOG, Journal of Innovative Technology and Exploring Engineering (IJITEE), https://doi.org/10.35940/ijitee.F3737.049620
[24] Xie, Y., Zhang, J., Xia, Y., Shen, C. (2020). A mutual bootstrapping model for automated skin lesion segmentation and classification. IEEE Transactions on Medical Imaging, 39(7): 2482-2493. https://doi.org/10.1109/TMI.2020.2972964
[25] Al-Masni, M.A., Kim, D.H., Kim, T.S. (2020). Multiple skin lesions diagnostics via integrated deep convolutional networks for segmentation and classification. Computer methods and programs in biomedicine, 190: 105351. https://doi.org/10.1016/j.cmpb.2020.105351