Ellya Helmud*![]() | Catur Edi Widodo
| Catur Edi Widodo![]() | Oky Dwi Nurhayati
| Oky Dwi Nurhayati![]()
© 2026 The authors. This article is published by IIETA and is licensed under the CC BY 4.0 license (http://creativecommons.org/licenses/by/4.0/).
OPEN ACCESS
Fish species classification plays a vital role in ecosystem management and sustainable fisheries. However, intra-species variation and inconsistent lighting often hinder accurate identification. This research presents a deep learning approach for accurate fish classification using a balanced dataset of 9,000 images across nine distinct species. The proposed method integrates EfficientNetB0 and InceptionV3 backbones through a multi-scale feature fusion and model averaging strategy. The training process consists of an initial backbone freezing phase and a subsequent deep fine-tuning stage. This latter stage utilizes Cosine Decay with Warm Restarts and a custom SnapshotModelCheckpoint to optimize performance. Experimental results indicate that the best single model achieves 99.89% test accuracy. Moreover, an ensemble strategy using soft voting from three snapshot models reaches 100% accuracy and an F1-score of 1.00 on the test set of 900 images. Although the results reflect the controlled data acquisition conditions, the research highlights the effectiveness of multi-scale integration and ensemble diversity in resolving fine-grained morphological ambiguities, offering a robust and scalable solution for automated fish species identification.
deep ensemble learning, multi-scale feature integration, model average strategy, soft voting, deep fine-tuning, Cosine Decay with Warm Restarts, classification accuracy
Accurate fish species identification forms a critical foundation for numerous scientific and practical applications, spanning the fields of ecology, marine conservation, and the fishing industry [1]. Within marine biology, precise classification is essential for monitoring biodiversity, tracking populations, and supporting conservation efforts for endangered species [2]. For the fisheries sector, accurate identification facilitates sustainable fish stock management, prevents the capture of protected species, and enhances the efficiency and transparency of the supply chain. Traditionally, the process of fish species identification often relies on human taxonomic expertise or manual morphometric methods. These approaches, while valid, tend to be time-consuming, prone to human error, and require a high level of expertise with limited availability of specialists.
With the advancement of computer vision and deep learning technologies, significant potential has emerged to automate this identification process with substantially higher accuracy and efficiency [3]. Convolutional Neural Networks (CNNs) have proven remarkably effective in various image classification tasks, capable of automatically extracting hierarchical features from visual data, ranging from low-level details (edges, textures) to high-level semantic representations (object shapes, patterns) [4, 5]. This capability makes CNNs ideal for complex image analysis, such as fish imagery. Pre-trained CNN models, such as InceptionV3 and EfficientNetB0, which have been trained on large-scale datasets like ImageNet, have demonstrated exceptional capabilities in transfer learning. This allows them to leverage general knowledge acquired from recognizing thousands of object categories and adapt it effectively to more specific classification tasks, even with a relatively limited amount of data [6].
Despite the proven strengths of CNNs, fish species classification through imagery still faces inherent challenges that limit the performance of a single model. Firstly, intra-species variation (individual differences within a single species), such as variations in shape, color, or pattern due to age, sex, or environment, can confuse the model [7]. Secondly, high visual similarity between different species (inter-species variation) often leads to misclassification because the model struggles to distinguish subtle details that are characteristic of specific species. Environmental factors like inconsistent lighting conditions (e.g., glare or shadows), diverse fish poses (front, side, oblique), and partial occlusion (fish being obstructed by other objects) further complicate the identification task. Single CNN-based classification systems, while powerful, may still be vulnerable to these fluctuations and often cannot achieve the level of accuracy required for critical applications [8].
Ensemble learning approaches effectively overcome the limitations of single models by enhancing robustness and accuracy [9, 10]. These methods combine predictions from multiple models to produce more stable and accurate final decisions. Furthermore, multi-scale feature integration enriches image representation by combining features from various architectural levels. This integration allows the model to capture fine taxonomic details while maintaining the global context of the object. In this study, the fusion of EfficientNetB0 and InceptionV3 is particularly effective for extracting features at different abstraction levels [11, 12]. EfficientNet provides high parameter efficiency through uniform scaling, while InceptionV3 captures multi-scale features using diverse filter sizes. This research develops an innovative framework to achieve highly accurate fish species classification by leveraging these advanced solutions.
This research generally discusses the capability of CNNs in performing automatic hierarchical feature extraction and image recognition [9]. CNN models are trained to extract complex features from image data through convolutional, pooling, and fully connected layers. CNNs have proven to be highly effective in identifying relevant patterns and visual features for image recognition tasks, surpassing traditional feature extraction methods. As a general overview, this study does not present specific case studies or implementation challenges in particular domains (e.g., species classification), nor does it address specific weaknesses that might arise in practical applications, such as subtle inter-species variations or non-ideal image acquisition conditions.
This research proposes a novel image enhancement method and a hybrid feature fusion approach that integrates handcrafted features with CNN-derived features to improve face recognition systems. Extensive image pre-processing is applied before features are extracted and fed into the CNN [10]. The combination of image enhancement techniques, hybrid features, and CNNs shows a significant improvement in the accuracy of face recognition systems, especially when facing challenges of lighting and pose variations. Although effective for face recognition, the generalization of this hybrid feature approach to animal species classification (e.g., fish) may require significant adjustments, as the features relevant for species identification might differ from human facial features [11]. Additionally, the complexity of determining optimal hybrid features can be a challenge in itself.
This research focuses on the classification of highly similar fish species from the Characidae family using various traditional machine learning algorithms, including Support Vector Machine (SVM), K-Nearest Neighbours (K-NN), Random Forest, and Naive-Bayes [12]. Visual feature extraction (likely handcrafted or traditional) was performed before classification. Traditional machine learning models were able to classify highly similar fish species with varying degrees of accuracy, demonstrating that discriminatory features can be found even in species with subtle morphological differences. The performance of traditional machine learning methods is often limited by the quality and relevance of the extracted handcrafted features. The manual feature extraction process can be time-consuming and may not capture all the crucial nuances required for highly accurate discrimination, especially with large and complex datasets. Furthermore, these models may be less capable of extracting more complex hierarchical features compared with CNNs.
This research investigates the use of ensemble methods (combining multiple models) to improve the robustness of deep learning image classification in marine environments, with a focus on coral classification. They tested how ensemble models can enhance calibration and uncertainty quantification. Ensemble methods proved to be more stable in calibration across dataset shifts and provided stronger uncertainty quantification, which is crucial for applications in uncontrolled marine environments [13]. The application of ensemble methods can increase computational complexity and inference time, which might be a constraint for real-time applications. Additionally, although improving robustness, these methods might not directly address issues of data scarcity or extreme intra-class variability if the base models used in the ensemble are not sufficiently strong [14].
This study developed an automatic estuarine fish species classification system using deep learning techniques, with an in-depth exploration of the Vision Transformer (ViT) architecture. They also compared ViT with various popular pre-trained CNN models, such as VGG16, VGG19, DenseNet121, ResNet50V2, InceptionV3, Inception-ResNetV2, and Xception. Extensive data augmentation was applied to the dataset to improve performance. This research achieved an accuracy of up to 100% on the estuarine fish dataset with the use of data augmentation and demonstrated the remarkable potential of ViT and pre-trained CNN models for aquatic species classification tasks. Although achieving high accuracy, 100% accuracy often indicates that the dataset used might be relatively small or less varied, which can lead to overfitting if the model is applied to broader real-world scenarios. The reliance on data augmentation also suggests that the original dataset size might be limited. ViT, although powerful, requires very large datasets for training from scratch, and the use of pre-training on generic datasets may not always be optimal for specific domains like fish images.
Table 1. Comparative summary of related studies in fish species classification
|
Study |
Method |
Dataset |
Performance |
Research Gap Addressed by This Work |
|
Gao et al. [9] |
Optimized ResNet50 |
General Marine Fish |
Hierarchical feature extraction |
Focused on a single-model backbone; limited handling of inter-species visual ambiguity. |
|
Oloyede et al. [10] |
Traditional machine learning: Support Vector Machine (SVM), K-Nearest Neighbours (K-NN) |
Characidae Family |
Morphometric analysis |
Relies on manual feature engineering; lacks robustness for large-scale or complex datasets. |
|
Akgül et al. [11] |
Hybrid Transfer Learning |
Fish Freshness (Eyes/Gills) |
Freshness assessment |
Specific to quality control; does not address multi-species classification from whole-body imagery. |
|
This study |
Deep Ensemble & Multi-Scale Fusion |
9 Species (9,000 images) |
100% accuracy (soft voting) |
Integrates multi-scale features to resolve morphological ambiguities that single models fail to capture. |
This research compares two advanced CNN architectures, Inception, ResNet and Xception, for the task of marine fish object detection. The focus is on the effectiveness and computational efficiency of both models in identifying and localizing fish within images. Both models showed strong performance in marine fish object detection, with differences in the trade-off between accuracy and inference speed. Although effective for detection, this study does not explicitly address the aspect of species classification in depth or the challenge of discriminating between highly similar fish species [6]. The focus on object detection may overlook subtle feature details crucial for accurate species identification. Furthermore, model performance can be significantly influenced by the quality and variation of the detection dataset used. For a detailed summary of all the aforementioned studies, please refer to Table 1.
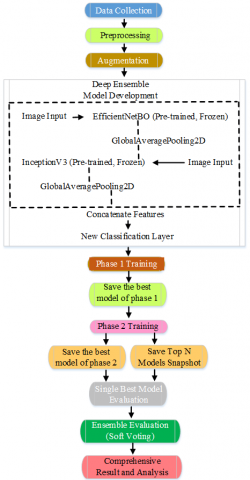
The methodology employs a deep ensemble learning approach for fish species classification. There are two main pillars in this method: multi-scale feature integration and a model averaging strategy. Figure 1 illustrates the entire workflow of the research stages to be conducted.
Figure 1. Research stages
3.1 Data collection and pre-processing
The data source for this research is a fish image dataset accessible via the Kaggle dataset (www.kaggle.com/datasets/lotfiezzeddini/fish-dataset). This dataset is proportionally distributed into three sets: 7,200 images for training (80%), 900 images for validation (10%), and 900 images for testing (10%). The nine fish species classes covered are: Black Sea Sprat, Gilt-Head Bream, Horse Mackerel, Red Mullet, Red Sea Bream, Sea Bass, Shrimp, Striped Red Mullet, and Trout. Each image was resized to a standard dimension (160 × 160 pixels), its pixel values were normalized to a range suitable for deep learning, and the fish species labels were converted into the one-hot encoding format. While the dataset is limited to nine species with a fixed and balanced split (100 samples per class in the test set), it remains highly representative for evaluating the proposed ensemble framework. These specific species were selected because they present significant morphological challenges, such as the high visual similarity between Red Sea Bream and Gilt-Head Bream, which often leads to misclassification in standard models. The balanced nature of the dataset ensures that the model evaluation is not biased toward a majority class, allowing for a clear assessment of the multi-scale feature integration's performance. However, it is acknowledged that the controlled and balanced environment of this dataset represents a simplified version of real-world fisheries, where class imbalance and environmental noise are more prevalent. This dataset thus serves as a critical baseline to validate the effectiveness of the fusion architecture before its application to more complex, large-scale maritime data.
3.2 Data augmentation
In the development of deep learning models, generalization capability is a crucial aspect to ensure robust performance on unseen data. To mitigate overfitting due to limited dataset size, a series of data augmentation techniques is applied, artificially expanding the diversity of the training dataset [15]. These specific transformations, including flipping, rotation, scaling, contrast adjustment, and translation, were selected based on preliminary sensitivity experiments. These tests indicated that geometric variations and lighting inconsistencies were the primary factors contributing to initial misclassification. Specifically:
By applying these transformations randomly, the model effectively increases its discriminative capability. This approach ensures superior generalization when confronted with real-world variations such as differences in object pose or scale.
3.3 Deep ensemble model development (Fusion)
Methodology's main pillar is an ensemble model architecture that combines the strengths of two prominent CNN architectures: EfficientNetB0 and InceptionV3. Both models are loaded with weights pre-trained on the ImageNet dataset (transfer learning) and are initially frozen. Augmented images are passed through both backbones to extract rich features [16]. A key part is multi-scale feature integration, where distinct features from EfficientNetB0 and InceptionV3 are combined (concatenated) into a single feature representation. This combined representation is then fed into a new classification "head" consisting of dense and dropout layers that will learn how to classify fish species [17].
EfficientNetB0 and InceptionV3 Backbone Feature Extraction:
$F_{\text {EffNet}}=M_{\text {EffNet}}\left(I_{\text {input}}\right)$ (1)
$F_{\text {Inception}}=M_{\text {inception}}\left(I_{\text {input}}\right)$ (2)
Multi-scale feature integration (Concatenation Fusion):
$F_{\text {Combined}}=\left[F_{\text {EffNet}} \| F_{\text {Inception}}\right] \in R^{D_{E f f}+D_{\text {inc}}}$ (3)
New Classification Layer (Classification Head):
$Z=L_{\text {Classification}}\left(F_{\text {combined}}\right)$ (4)
The predicted probability $\gamma \in R^N$ is calculated using the softmax function:
$\gamma_j=\frac{e^{Z_j}}{\sum_{k=1}^N e^{Z_k}}$ (5)
3.4 Two-phase training process
The model training process is executed in two optimized phases to ensure stable convergence and effective transfer learning:
Phase 1 (Backbone Freezing): Initially, the weights of the EfficientNetB0 and InceptionV3 backbones are frozen, and only new classification layers are trained. This strategy was adopted to prevent the destruction of well-learned features from ImageNet during the early stages of training when the classification head is still randomly initialized [18]. The Adam optimizer was selected for this phase due to its adaptive learning rate properties, which facilitate rapid initial convergence.
Phase 2 (Deep Fine-tuning): After the classification head is stabilized, the top layers of the backbones are "thawed" to fine-tune specific features for the fish dataset. This phase utilizes a Cosine Decay with Warm Restarts scheme. This specific learning rate schedule was chosen over a standard linear decay because its cyclical nature allows the model to "jump" out of a local minimum. This behavior is essential for our SnapshotModelCheckpoint strategy, as it enables the systematic recording of diverse, high-performing model states from multiple convergence cycles, which are later used to maximize the diversity and accuracy of the model averaging ensemble [19].
Function Loss (Categorical Crossentropy):
$L\left(\gamma_{o h}, \gamma\right)=-\sum_{J=1}^N Y_{o h . j} \log \left(\gamma_j\right)$ (6)
Optimization (Adam Optimizer):
$W_{\text {new}}=$ Wold - learning$_{\text {rate}} \cdot \nabla \mathrm{WL}$ (7)
Cosine Decay with Warm Restarts:
$\propto(e)=\propto_{\min}+\frac{1}{2}\left(\propto_{\max}-\propto_{\min}\right)\left(+\cos \left(\frac{\pi\left(e\left(\bmod T_{\text {sycle}}\right)\right)}{T_{\text {sycle }}}\right)\right.$ (8)
3.5 Comprehensive evaluation
After the multi-phase training process, the model's performance was thoroughly evaluated [20]. First, the best single model from Phase 2 was evaluated on the unseen test set to obtain its baseline accuracy and loss metrics. Second, to leverage the model averaging strategy, predictions from the three best snapshot models recorded during training were combined using a soft voting technique (probability averaging). The performance of this ensemble was then evaluated using the same metrics [21]. The evaluation results are presented through a classification report, confusion matrix, and Receiver Operating Characteristic (ROC) curve to provide a comprehensive overview of the model's classification capabilities [22, 23].
Accuracy (Overall Accuracy):
Accuracy $=\frac{\text { Number of Correct Predictions }}{\text { Total Sample in the test set }}$ (9)
Precision, Recall, and F1-score:
Precision$_c=\frac{T P_c}{T P_c+F P_c}$ (10)
Recall$_c=\frac{T P_c}{T P_c+F N c}$ (11)
$F 1-$ Score$_c=2 \cdot \frac{\text { Precision}_c \cdot \text { Recall}_c}{\text { Precision}_c+\text { Recall}_c}$ (12)
Ensemble Strategy (Soft Voting):
$\gamma_k\left(x_{\text {test}}\right)=M_k\left(x_{\text {test}}\right)$ (13)
The average ensemble probability is calculated as:
$y_{\text {ensemble}}\left(x_{\text {test}}\right)=\frac{1}{K} \sum_{k=1}^k \gamma_k\left(x_{\text {test}}\right)$ (14)
The final prediction class of the ensemble is:
$C_{\text {pred_ensemble }}\left(X_{\text {test}}\right)=\left(\operatorname{argmax}\left(y^{\operatorname{ensemble}\left(X_{\text {test}}\right)}\right)\right.$ (15)
The results of a study conducted for fish species classification using the deep ensemble learning approach with multi-scale feature integration and model averaging strategy [24]. Model performance was comprehensively evaluated on an unseen test set.
4.1 Performance of single classification model
Following the optimized two-phase training process, the single best fusion model demonstrated robust classification performance. This architecture, resulting from the deep fine-tuning of combined EfficientNetB0 and InceptionV3 backbones, achieved a test accuracy of 99.89% with a corresponding loss value of 0.0799. The performance metrics and training progress are illustrated in Figure 2. The high accuracy and minimal loss indicate that the multi-scale feature integration effectively captured discriminative patterns across the nine species [25]. The model showed a high degree of confidence in its predictions, suggesting that the concatenation of features from diverse backbones successfully provided a comprehensive representation of the fish imagery, even when faced with inherent challenges such as varying lighting and intra-species differences.

Figure 2. Performance of a single classification model
4.2 Single model performance analysis through confusion matrix
Following the optimized two-phase training process, the single best fusion model demonstrated robust classification performance [26]. This architecture, resulting from the deep fine-tuning of combined EfficientNetB0 and InceptionV3 backbones, achieved a test accuracy of 99.89% with a corresponding loss value of 0.0799. The high accuracy and minimal loss indicate that the multi-scale feature integration effectively captured discriminative patterns across the nine species. The model showed a high degree of confidence in its predictions, suggesting that the concatenation of features from diverse backbones successfully provided a comprehensive representation of the fish imagery, even when faced with inherent challenges such as varying lighting and intra-species differences.
To further investigate the model's predictive behavior, a confusion matrix was utilized to map the relationships between true and predicted labels Figure 3. The analysis reveals consistent identification across most categories, with 100 out of 100 samples correctly classified for eight species: Black Sea Sprat, Horse Mackerel, Red Mullet, Sea Bass, Shrimp, Striped Red Mullet, and Trout. This consistency suggests that the model effectively isolated the unique structural characteristics of these species, such as the distinct silhouette of the Horse Mackerel and the unique texture and segments of the Shrimp.
However, the confusion matrix also identifies a specific research gap regarding inter-species visual ambiguity. A single error was recorded in the "Red Sea Bream" category, where one sample was misclassified as "Gilt-Head Bream". This specific misclassification is significant as both species belong to the Sparidae family and share highly similar morphological traits, including oval-shaped bodies and silvery-pinkish scale textures. This error likely occurred because the single model focused predominantly on the shared global features of the Sparidae family, failing to prioritize subtle discriminative markers such as the specific dark spot on the gill cover or the characteristic golden hue between the eyes that distinguishes the Gilt-Head Bream from the Red Sea Bream. This finding underscores the limitations of a single-model approach when dealing with extreme inter-species similarity. Consequently, this minor performance bottleneck serves as the primary technical justification for the implementation of the ensemble strategy through soft voting. By integrating multiple snapshot states, the system can leverage a wider diversity of learned features, allowing the fine-grained details that were overlooked in this instance to be correctly represented in the final aggregated decision.

Figure 3. Single best confusion matrix model
4.3 Analysis of a single model's discriminative ability through the Receiver Operating Characteristic curve
As shown in Figure 4, it is evident that there are nine individual ROC curves, each representing one of the nine distinct fish species classes. Additionally, there is one micro-average ROC curve illustrating the model's aggregated performance across all classes. The most striking observation is that all ROC curves, both for individual classes and the micro-average curve, appear to stretch along the left and top boundaries of the graph, effectively touching the point (0,1). This position of the curves indicates that the model possesses near-perfect discriminative capability. The Area Under the Curve (AUC) value for every ROC curve, including the micro-average curve, is recorded as 1.00. An AUC value of 1.00 is an indicator of ideal performance, meaning the model can perfectly differentiate between positive and negative samples for each class at every possible threshold. This suggests that the model maintains high recall and precision across the sensitivity-specificity spectrum. Despite the previous confusion matrix showing a single minor error, this collective AUC value highlights the model's strength in separating class probabilities, even for challenging cases. Overall, the ROC curve provides strong visual evidence of the single model's exceptionally high classification capability, demonstrating that the model is effective in identifying and distinguishing fish species from one another.

Figure 4. Analysis of a single model's discriminative ability through the Receiver Operating Characteristic (ROC) curve
4.4 Ensemble model performance analysis through classification reports
Figure 5 presents the classification report for the ensemble system using the soft voting strategy. The report indicates that precision, recall, and F1-score consistently reached 1.00 across all nine fish species. With a support of 100 samples per class, the macro and weighted averages also confirm an overall accuracy of 1.00 on the test set of 900 images. These metrics demonstrate that the ensemble approach successfully eliminated the false positives and false negatives previously encountered in the single-model stage. By aggregating predictions from multiple snapshot models, the system achieved higher discriminative stability, confirming the effectiveness of the model averaging strategy in resolving visual ambiguities within this dataset.

Figure 5. Ensemble classification report (soft voting)
4.5 Confusion matrix of ensemble (soft voting)
Figure 6 displays the confusion matrix for the ensemble system using the soft voting strategy. The matrix shows that all 100 samples for each of the nine species were correctly identified, resulting in 100% test accuracy with no off-diagonal errors. This result confirms that the ensemble approach successfully corrected the specific misclassification between Red Sea Bream and Gilt-Head Bream previously observed in the single-model analysis. By aggregating diverse feature representations from multiple snapshot models, the system achieved a more stable decision-making process, effectively resolving the subtle morphological ambiguities that individual models failed to capture. This performance validates the increased robustness afforded by the ensemble strategy for reliable fish species identification".

Figure 6. Confusion matrix ensemble (soft voting)
4.6 Receiver Operating Characteristic curve ensemble (soft voting)
Figure 7 displays the ROC curve for the ensemble system optimized with a soft voting strategy. As with typical ROC curves, this graph visualizes the model's ability to distinguish between positive and negative classes across various classification thresholds. The X-axis represents the False Positive Rate (FPR), while the Y-axis represents the True Positive Rate (TPR) or Recall. A key observation from Figure 7 is that all ROC curves, both for each fish species class and the aggregated micro-average curve, lie along the left and top boundaries of the graph, precisely passing through the point (0,1). This curve position indicates that the ensemble system possesses near-perfect discriminative capability. Consistent with the performance shown in the preceding classification report and confusion matrix for the ensemble, the AUC value for every ROC curve in Figure 4, including the micro-average curve, is recorded as 1.00. An AUC value of 1.00 signifies an ideal and flawless classification performance. This means the ensemble system achieves near-perfect separation between positive samples and negative ones at every possible threshold, indicating no overlap in the predicted probability distributions between classes.

Figure 7. Receiver Operating Characteristic (ROC) curve ensemble (soft voting)
Significance and confirmation of results: This ROC curve indicates strong performance of the proposed ensemble model (100% accuracy and 1.00 F1-score). It demonstrates that the soft voting strategy not only successfully corrected the single error observed in the individual model's performance but also enhanced the overall capability of the model to distinguish between classes with high confidence. The reliability and precision showcased by this ensemble ROC curve underscore the synergistic power of the deep ensemble learning approach in yielding a highly robust and accurate fish species classification system.
4.7 Training and validation accuracy
The sub-plot on the left in Figure 8 illustrates the dynamics of the model’s accuracy during training. The blue line represents training accuracy, while the orange line indicates validation accuracy. From this graph, it is evident that training accuracy shows a consistent and stable increase from the initial epochs until it reaches a very high value, approaching 1.00 (or 100%). This increase signifies that the model successfully learned relevant features and patterns from the training data effectively [27]. In line with training accuracy, validation accuracy also exhibits a strong upward trend, closely following the training accuracy curve. Although there might be minor fluctuations, validation accuracy also successfully reached a very high level. The convergence of these two accuracy curves, without a significantly widening gap, is a crucial indicator that the model did not suffer from severe overfitting. This demonstrates that the model not only memorized the training data but also successfully generalized the knowledge it acquired to previously unseen data (validation data) with high efficiency.

Figure 8. Training and validation accuracy
4.7.1 Training and validation loss
The sub-plot on the right in Figure 8 presents the evolution of the model's loss values during training. The blue line represents training loss, while the orange line indicates validation loss [28]. At the beginning of training, the loss values for both curves decreased drastically, which is an initial sign of the model learning rapidly. This decline then continued steadily and converged towards very low values in the latter epochs of training. The consistent decrease in loss and convergence to low values, for both training and validation data, is strong evidence that the model successfully minimized its loss function. This confirms that the model was able to make increasingly accurate and confident predictions as training progressed, while also maintaining its generalization capability. The lack of divergence between the training and validation loss curves also indicates that the model did not overly memorize the training data and remained capable of performing well on new data [29].
4.7.2 Conclusion of training history
Overall, this training history graph confirms a stable, efficient, and successful training process. The synchronous and consistent pattern of increasing accuracy and decreasing loss on both data sets (training and validation) is a strong indicator of the model's optimal learning capability and its ability to generalize results to new data effectively. This constitutes an important foundation supporting the outstanding performance of the single model and ensemble system discussed previously in this research.
The primary contribution of this research is the development of a robust fusion architecture that stabilizes classification performance in controlled environments. However, several critical limitations must be acknowledged. First, the high accuracy achieved is reflective of a balanced and curated dataset, which may not fully represent the complexities of "in-the-wild" maritime environments where water turbidity, overlapping objects (occlusion), and extreme class imbalances are prevalent. Second, the use of a multi-model ensemble inherently increases computational complexity and inference time compared to single-model systems. This poses a potential challenge for deployment on resource-constrained edge devices, such as underwater drones or real-time monitoring sensors. Future research should prioritize validating this framework against noisier, large-scale datasets and exploring model compression techniques, such as knowledge distillation, to optimize the balance between high-precision performance and computational efficiency. Overall, this research provides a reliable foundation for automated identification systems in marine conservation and sustainable fisheries management.
Based on the findings and limitations identified in this study, the following areas are proposed for future exploration:
While the current system demonstrated high accuracy on a curated dataset, future research should prioritize testing on larger, "in-the-wild" datasets. This includes images with extreme lighting variations, turbid water conditions, and complex backgrounds to further evaluate the model’s generalization and robustness in real-world maritime environments.
The ensemble architecture inherently introduces higher computational overhead. Future studies should focus on model optimization techniques—such as quantization, pruning, or knowledge distillation—to reduce model size and inference latency. This is crucial for deploying the system on resource-constrained edge devices like smart underwater cameras or autonomous monitoring sensors.
Beyond soft voting, more sophisticated strategies like weighted ensembles or stacking could be explored to balance the trade-off between accuracy and computational cost. Additionally, integrating the classification framework with object detection and localization (e.g., YOLO or Faster R-CNN) would enable the system to identify and count multiple fish in complex video streams.
To transition from a "black-box" model to a transparent system, applying XAI techniques such as Grad-CAM or LIME is recommended. This would provide ecological insights by visualizing the specific morphological features (e.g., fin shape, eye color, or scale patterns) that the model prioritizes during classification.
Future work should address real-world scenarios where certain species are rare. Implementing specialized techniques, such as cost-sensitive loss functions or synthetic data generation (SMOTE), will be essential to maintain high performance in the presence of extreme class imbalances.
[1] Wijaya, D.R., Syarwan, N.F., Nugraha, M.A., Ananda, D., Fahrudin, T., Handayani, R. (2023). Seafood quality detection using electronic nose and machine learning algorithms with hyperparameter optimization. IEEE Access, 11: 62484-62495. https://doi.org/10.1109/ACCESS.2023.3286980
[2] Yasin, E.T., Ozkan, I.A., Koklu, M. (2023). Detection of fish freshness using artificial intelligence methods. European Food Research and Technology, 249(8): 1979-1990. https://doi.org/10.1007/s00217-023-04271-4
[3] Tyagi, V. (2018). Understanding Digital Image Processing. New York: CRC Press. https://doi.org/10.1201/9781315123905
[4] Liu, Y.H. (2018). Feature extraction and image recognition with convolutional neural networks. Journal of Physics: Conference Series, 1087: 062032. https://doi.org/10.1088/1742-6596/1087/6/062032
[5] Kılıçarslan, S., Çiçekliyurt, M.M.H., Kılıçarslan, S. (2024). Fish freshness detection through artificial intelligence approaches: A comprehensive study. Turkish Journal of Agriculture-Food Science and Technology, 12(2): 290-295. https://doi.org/10.24925/turjaf.v12i2.290-295.6670
[6] Hindarto, D. (2023). Battle models: Inception ResNet vs. extreme inception for marine fish object detection. Sinkron: Jurnal dan Penelitian Teknik Informatika, 7(4): 2819-2826. https://doi.org/10.33395/sinkron.v8i4.13130
[7] Dhillon, A., Verma, G.K. (2020). Convolutional neural network: A review of models, methodologies and applications to object detection. Progress in Artificial Intelligence, 9(2): 85-112. https://doi.org/10.1007/s13748-019-00203-0
[8] Janakidevi, M., Prasad, T.V.K.P., Udayaraju, P. (2021). An improved Deep Convolutional Neural Network (DCNN) for finding the fish freshness. Annals of the Romanian Society for Cell Biology, 25(7): 1341-1349. http://annalsofrscb.ro/index.php/journal/article/view/10452.
[9] Gao, G., Sun, Z., Mu, G., Yin, H., Ren, Y. (2024). Research on marine fish classification and recognition based on an optimized ResNet50 model. Marine and Coastal Fisheries, 16(6): e10317. https://doi.org/10.1002/mcf2.10317
[10] Oloyede, M.O., Hancke, G.P., Myburgh, H.C. (2018). Improving face recognition systems using a new image enhancement technique, hybrid features and the convolutional neural network. IEEE Access, 6: 75181-75191. https://doi.org/10.1109/ACCESS.2018.2883748
[11] Akgül, İ., Kaya, V., Zencir Tanır, Ö. (2023). A novel hybrid system for automatic detection of fish quality from eye and gill color characteristics using transfer learning technique. PloS One, 18(4): e0284804. https://doi.org/10.1371/journal.pone.0284804
[12] Silva, L.M.C., Flores, F.C., Delariva, R.L., Felipe, G.Z., Da Costa, Y.M. (2024). Classification of highly similar fish species using machine learning. In 2024 31st International Conference on Systems, Signals and Image Processing (IWSSIP), Graz, Austria, pp. 1-8. https://doi.org/10.1109/IWSSIP62407.2024.10634024
[13] Wyatt, M., Radford, B., Callow, N., Bennamoun, M., Hickey, S. (2022). Using ensemble methods to improve the robustness of deep learning for image classification in marine environments. Methods in Ecology and Evolution, 13(6): 1317-1328. https://doi.org/10.1111/2041-210X.13841
[14] Tejaswini, H., Pai, M.M., Pai, R.M. (2024). Automatic estuarine fish species classification system based on deep learning techniques. IEEE Access, 12: 140412-140438. https://doi.org/10.1109/ACCESS.2024.3468438
[15] Ben Tamou, A., Benzinou, A., Nasreddine, K. (2022). Targeted data augmentation and hierarchical classification with deep learning for fish species identification in underwater images. Journal of Imaging, 8(8): 214. https://doi.org/10.3390/jimaging8080214
[16] Kumar, T., Brennan, R., Mileo, A., Bendechache, M. (2024). Image data augmentation approaches: A comprehensive survey and future directions. IEEE Access, 12: 187536-187571. https://doi.org/10.1109/ACCESS.2024.3470122
[17] Markey, F.B., Ruezinsky, W., Tyagi, S., Batish, M. (2014). Fusion FISH imaging: Single-molecule detection of gene fusion transcripts in situ. PloS One, 9(3): e93488. https://doi.org/10.1371/journal.pone.0093488
[18] Vrbančič, G., Podgorelec, V. (2020). Transfer learning with adaptive fine-tuning. IEEE Access, 8: 196197-196211. https://doi.org/10.1109/ACCESS.2020.3034343
[19] Yildiz, M.B., Yasin, E.T., Koklu, M. (2024). Fisheye freshness detection using common deep learning algorithms and machine learning methods with a developed mobile application. European Food Research and Technology, 250(7): 1919-1932. https://doi.org/10.1007/s00217-024-04493-0
[20] Wang, G., Muhammad, A., Liu, C., Du, L., Li, D. (2021). Automatic recognition of fish behavior with a fusion of RGB and optical flow data based on deep learning. Animals, 11(10): 2774. https://doi.org/10.3390/ani11102774
[21] Xie, Y., Xiang, J., Li, X., Yang, C. (2024). An intelligent fishery detection method based on cross-domain image feature fusion. Fishes, 9(9): 338. https://doi.org/10.3390/fishes9090338.
[22] Zhang, Z., Sun, Y., Sang, S., Jia, L., Ou, C. (2022). Emerging approach for fish freshness evaluation: Principle, application and challenges. Foods, 11(13): 1897. https://doi.org/10.3390/foods11131897
[23] Markoulidakis, I., Markoulidakis, G. (2024). Probabilistic confusion matrix: A novel method for machine learning algorithm generalized performance analysis. Technologies, 12(7): 113. https://doi.org/10.3390/technologies12070113
[24] Choompol, A., Gonwirat, S., Wichapa, N., Sriburum, A., et al. (2025). Evaluating optimal deep learning models for freshness assessment of silver barb through technique for order preference by similarity to ideal solution with linear programming. Computers, 14(3): 105. https://doi.org/10.3390/computers14030105
[25] Sari, I.P., Warsito, B., Nurhayati, O.D. (2025). Automated classification of parasitic worm eggs based on transfer learning and fine-tuned CNN models. International Journal of Advanced Computer Science & Applications, 16(5): 105-111. https://doi.org/10.14569/ijacsa.2025.0160511
[26] García, M.R., Ferez-Rubio, J.A., Vilas, C. (2022). Assessment and prediction of fish freshness using mathematical modelling: A review. Foods, 11(15): 2312. https://doi.org/10.3390/foods11152312
[27] Ruder, S. (2017). An overview of multi-task learning in deep neural networks. arXiv preprint arXiv:1706.05098. https://doi.org/10.48550/arXiv.1706.05098
[28] Samineni, L., Peddi, A., Kasukurthi, A., Rao, M.C.S., Niharika, G., Chereddy, S.V. (2023). Evaluation of AI techniques for detecting deceptive reviews in cyberspace: A study of pre- and post-COVID-19 trends. In 2023 2nd International Conference on Electronics and Renewable Systems (ICEARS), Tuticorin, India, pp. 961-967. https://doi.org/10.1109/ICEARS56392.2023.10085689
[29] De Graeve, M., Birse, N., Hong, Y., Elliott, C.T., Hemeryck, L.Y., Vanhaecke, L. (2023). Multivariate versus machine learning-based classification of rapid evaporative Ionisation mass spectrometry spectra towards industry based large-scale fish speciation. Food Chemistry, 404(Part B): 134632. https://doi.org/10.1016/j.foodchem.2022.134632