Noval Fattah Alfaiz![]() | Zainal Arifin*
| Zainal Arifin*![]() | Budi Kristiawan
| Budi Kristiawan![]()
© 2025 The authors. This article is published by IIETA and is licensed under the CC BY 4.0 license (http://creativecommons.org/licenses/by/4.0/).
OPEN ACCESS
The advancement of hybrid photovoltaic thermal-phase change material (PVT-PCM) systems has attracted considerable scholarly interest owing to their augmented dependability and operational efficiency. This research endeavor scrutinizes the efficacy of non-active thermal regulation methodologies for solar energy collectors, with a particular focus on employing paraffin-based phase change materials. These materials are distinguished by their inherent capacity to absorb and sequester thermal energy in the form of latent heat as they undergo phase transitions. The research was conducted experimentally, focusing on evaluating three different heatsink geometries: a basic model, a square model, and a hexagonal model integrated with PCM. Our results show that the hexagonal cooling model performs the best, capable of maintaining the solar panel's operating temperature at 56.2℃. Additionally, this model achieved the highest power output of approximately 38.11 W with an electrical efficiency of 12.82%. Overall, the hexagonal design produced the highest total daily power output of 256.63 Wh. The improvement in PVT-PCM system performance correlated with the increased heat transfer rate in the hexagonal model. This research emphasizes the significance of PCM heatsink design in optimizing the efficiency and thermal regulation of PVT-PCM systems, providing valuable insights for developing more effective and practical passive cooling solutions.
PVT, PCM, passive cooling, heatsink geometry, PCM fin geometry, energy efficiency
Phase Change Material (PCM) has surfaced as a noteworthy strategy for augmenting the thermal regulation of solar photovoltaic (PV) installations, principally to mitigate the detrimental effects of elevated operational temperatures [1]. The performance efficacy of PV systems is substantially contingent upon thermal conditions, wherein augmented thermal states can precipitate a decline in electrical generation—typically in the vicinity of 0.4% to 0.5% for each degree Celsius increment in temperature [2]. This temperature-induced efficiency drop is a critical concern, prompting researchers to explore innovative cooling strategies, among which the integration of PCM offers substantial promise [3]. The application of PCM in PV panels maintains optimal temperatures, increases electrical efficiency, extends operational life, and significantly improves the stability of solar panel power output [4].
The fundamental principle of PCM is predicated upon their capacity to sequester and liberate thermal energy during transformations between distinct physical states, most commonly transitioning between solid and liquid phases [5]. By stabilizing the temperature around PV panels, PCM can mitigate overheating, thus enhancing energy conversion efficiency. Evidence suggests that when PCM are incorporated into PV systems, they can significantly lower operating temperatures, which not only leads to higher maximum power output (Pmax) but also increases the overall electrical efficiency (ηel) of the solar panels [6]. PCM can be classified into organic, inorganic, and eutectic types, with paraffin-based PCM being the most extensively studied [7]. A significant investigation indicated that diverse categories of PCMs, including organic compounds and paraffin waxes, demonstrate considerable efficacy in attenuating PV panel temperatures [8].
Recent experiments have demonstrated that utilizing PCM in cooling strategies for PV modules can lead to notable improvements in power output, particularly under intense solar radiation conditions [9]. For instance, a study indicated that a PV system incorporating OM35 PCM yielded superior energy performance compared to other materials due to its optimal melting point, which aligns well with typical ambient temperatures [10]. The effectiveness of PCM can be enhanced through a combination with complementary thermal dissipation techniques, such as hydro-cooling subsystems, providing a holistic thermal management approach that maximizes panel efficiency across various climatic conditions [11]. The integrated thermal management solution utilizes a synergistic active-passive approach to achieve peak efficacy. Circulatory pumps, maintained at a consistent discharge rate of 3 Liters/min, derive their energy from supplementary PV arrays, thereby guaranteeing reduced operational expenditures and ecological footprint [12]. This economically prudent strategy presents considerable potential for the progression of solar energy frameworks, fostering both financial feasibility and ecological stewardship in PV power generation. Furthermore, the selection of PCMs ought to be predicated upon achieving optimal performance characteristics tailored to a particular geographical context [13].
Moreover, ongoing research is being conducted into advanced PCM types, including bio-based eutectic formulations. The study highlights their potential for sustainable and effective thermal management in PV applications [14]. In China, studies and optimizations of the thermal performance of PV-PCM systems on the rooftops of smart buildings. The empirical results suggest that ambient atmospheric conditions exert a considerable effect on the ideal phase transition temperature of the PCM, and augmenting the thickness of the phase change layer substantially influences the internal thermal environment [15]. Parallel research on PCM containers was also conducted, such as adding heatsinks to increase the heat absorption rate by PCM [16]. Adding fins to the container can improve panel performance more effectively, as the development of container geometry can produce a better cooling effect [17]. As demand for clean energy sources increases, the use of innovative and environmentally friendly materials, such as PCMs, represents a viable pathway toward enhancing the operational efficiency of solar energy generation systems [18].
Incorporating PCM as a form of passive thermal regulation demonstrably enhances the thermal stability and electrical generation efficiency of PV arrays. This contemporary research undertakes a detailed examination of how varied heatsink configurations—specifically, planar, square, and hexagonal designs—influence both the thermal characteristics and electrical output of integrated PV-PCM systems. Through the application of Analysis of Variance (ANOVA), this investigation rigorously assesses the statistical importance of selected design parameters and the intensity of solar irradiation on the overall performance metrics of the system. Consequently, this research furnishes empirical data intended to inform the evolution of more effective and robust PV-PCM architectures. This scholarly work advances the current understanding by elucidating a direct relationship between the geometric attributes of the heatsink and the resultant system efficiency, thereby furnishing actionable intelligence for subsequent design enhancements.
2.1 Design of experiment
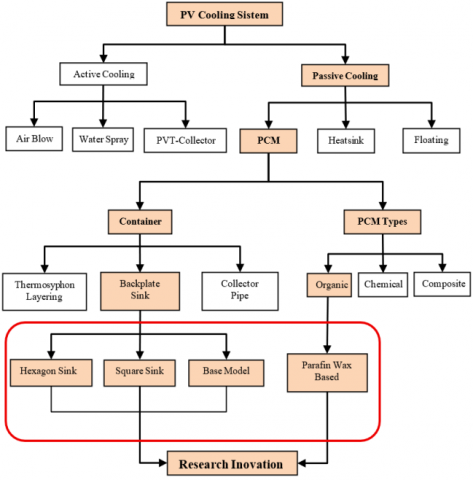
This investigation is methodically structured to ascertain the efficacy of PV installations augmented with PCM. The research trajectory is depicted in the flowchart presented in Figure 1, with a discernible emphasis on a particular area of inquiry. Broadly construed, two principal determinants can influence the operational efficiency of the PCM thermal regulation system applied to the panel: the design of the containment vessel and the specific classification of PCM employed [19]. The area of the circle is the focus of research that explores various heat sink designs for PCM containers explicitly.
Figure 1. Research framework
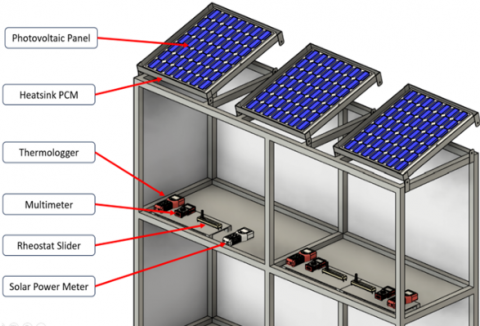
The experimental setup configuration is shown in Figure 2 and is designed to investigate the performance of PV panels on a real testing scale. Three-panel units were used to create homogeneous conditions in each variation. PCM heatsinks were placed at the bottom of the solar panels. The equipment setup includes instrumentation such as a thermologger for precise temperature acquisition, a multimeter for measuring electrical potential and current flow, solar irradiance meters for monitoring incident radiation, and rheostat sliders to adjust electrical resistance. Each apparatus is engineered for a comparative assessment under rigorously managed operational circumstances. Paraffin has been selected as the PCM material due to its advantageous thermal absorption spectrum and its extensive utility as a thermal dissipation agent for solar PV arrays [20].
Figure 2. Experimental setup
This investigation's methodological framework delineates the assessment of the system's kinetic behavior across a spectrum of environmental and operational parameters. The resultant quantitative measurements underwent rigorous statistical scrutiny employing a bivariate ANOVA methodology [21]. ANOVA is used to quantitatively evaluate the significance of each parameter by reviewing thermal and electrical performance aspects. This analysis will not only confirm the hypotheses that have been made but also identify critical variables and their interactions, thereby providing a deep scientific understanding of the overall potential [22]. The threshold of statistical significance pertaining to disparities among the experimental cohorts is elucidated within the accompanying significance matrix. Predatory to the empirical phase, the establishment of the null hypothesis and the alpha level is a prerequisite [23]. Within the context of this research, α = 0.05 was adopted as the criterion for evaluating observed effects.
2.2 Experiment component
PV panels are used to convert sunlight into electrical energy with a capacity of 50 Wp (Watt-peak). These panels are polycrystalline type manufactured by Yingli. These panels have the characteristics and specifications listed in Table 1. All details regarding the characteristics and additional technical specifications of these panels, such as physical dimensions, maximum operating voltage (Vmp), maximum operating current (Imp), open circuit voltage (Voc), and short circuit current (Isc), are recorded in detail in Table 1, which is an essential reference for the analysis and interpretation of experimental results.
Table 1. Specifications of Yingli Solar Cell 50 Wp
|
Specification |
Details |
|
Module Name |
YL050P-17b 1/3 |
|
Power Output (Pmax) |
50 W |
|
Voltage at Pmax (Vop) |
18.5 V |
|
Current at Pmax (Iop) |
2.71 A |
|
Open Circuit Voltage (Voc) |
22.9 V |
|
Short Circuit Current (Isc) |
2.87 A |
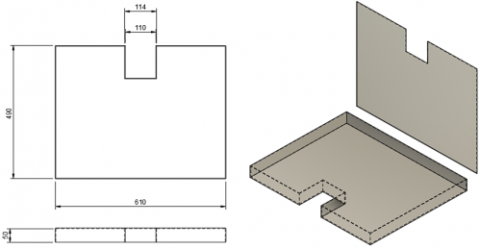
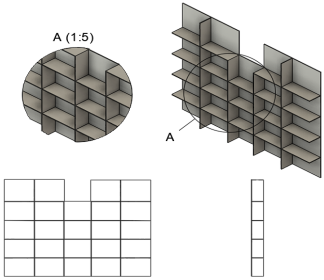
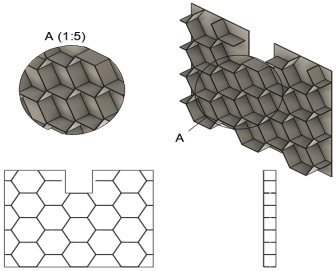
This research investigates the influence of fin integration on the architectural configuration of container heat sinks, testing three main types of heatsink models: the base model, the square model, and the hexagon model. The judicious selection among these heat sink configurations critically affects the augmentation of the interfacial zone between the PCM and the heatsink enclosure, which is an essential factor in heat transfer optimization [24]. Each heatsink model is designed with specific geometric characteristics, along with a cross-sectional area ratio. The basic model has a ratio of 0.3968 m², the square model 0.7171 m², and the hexagon model 0.8069 m². This difference in cross-sectional area ratio directly affects the heat absorption and release capacity of the PCM. Detailed illustrations of each evaluated heatsink container model are presented in Figure 3, which provides a visualization of the fin configuration and internal structure.
Figure 3. Design of containers
Table 2. Paraffin thermal characteristics
|
Specification |
Details |
|
Melting point |
52℃ |
|
Latent heat |
134.9 kJ/kg |
|
Thermal conductivity |
0.214 W/m.K |
|
Specific heat |
0.245 kJ/kg.K |
|
Density |
798 kg/m3 |
PCM represents a class of substances capable of accumulating energy through latent heat. This energy storage mechanism is intrinsically linked to the material's phase transition, wherein thermal energy is either liberated or absorbed due to variations in enthalpy during the change of state. Given that the phase transition process itself influences the material's temperature, thermal energy storage within PCMs occurs under isothermal conditions [25]. The energy density achievable through latent heat storage notably surpasses that of sensible heat storage. Consequently, to maximize heat absorption and optimize electrical output, it is crucial for the PCM’s melting point to be elevated [26]. In this research, paraffin wax was selected as the PCM for the thermal management of the PV module. A summary of the properties of the employed PCM is presented in Table 2.
The measuring instruments used in this study consisted of three main instruments that functioned to collect accurate and reliable data. The intensity of solar irradiance was quantified utilizing a Solar Power Meter (SPM), thereby delineating the quantum of solar emanations incident upon the PV array. Thermologger functioned as a temperature recorder, utilizing a thermocouple sensor that recorded and displayed temperature changes in real-time. The primary function of this device is to observe temperature fluctuations that occur during the experiment. Then, a multimeter was employed for the precise measurement of electrical variables, including electromotive force, electrical current, and electrical resistance. This instrument facilitates the assessment of alterations in the electro-performance characteristics of PV modules throughout the experimental regimen. The precise technical enumerations of these three instruments are comprehensively detailed in Table 3. These devices are used to evaluate the performance of PCM-based cooling systems, assessing both electrical and thermal aspects. The results of the study are significantly influenced by the accuracy of these devices, which is crucial for obtaining comprehensive data to support valid conclusions.
Table 3. Measurement devices specifications
|
Devices |
Specification |
Details |
|
Solar Power Meter |
Spectral response |
400 to 1100 nm |
|
Measuring unit |
W/m2 or Btu / (ft2. h) |
|
|
Range |
2000 W/m2, 634 Btu/ (ft2. h) |
|
|
Accuracy |
± 10 W/m2, ± 3 Btu/ (ft2. h) |
|
|
Operating temp |
0 to 50℃ |
|
|
Thermologger |
Sensor type |
Type J/K/T/E/R/S thermocouple |
|
Measuring unit |
Celsius (℃) and Kelvin (K) |
|
|
Range |
Type K: -100 to 1300℃ Type J: -100 to 1200℃ |
|
|
Resolution |
1 degree to 0.1 degree |
|
|
Accuracy |
± 1 Celsius (℃) or Kelvin (K) |
|
|
Sampling time |
1 to 3600 seconds |
|
|
Multimeter |
Category |
CAT II 600 V |
|
Operating temperature |
0 to 60℃ (humidity < 85%) |
|
|
Storage temperature |
-10 to 50℃ (humidity < 85%) |
|
|
Range |
0-600 V, 0-10 A and 0-200 W |
|
|
Accuracy |
± 0.2 scale reading |
2.3 Theoretical fundamentals
The electrical efficacy of a PV module is quantifiable as the cumulative electricity generated over a defined testing interval. The power output is systematically evaluated and ascertained by multiplying the measured current (I) and voltage (Volt) outputs, as delineated in Eq. (1) and Eq. (2), respectively [27]:
$P_{o p}=I_{o p} \cdot V_{o p}$ (1)
$E_{\text {elect}}=\int_{\tau_2}^{\tau_2}\left(I_{o p} \cdot V_{o p}\right) d \tau$ (2)
Electrical efficiency is quantitatively delineated as the quotient derived from the electrical energy output and the cumulative solar energy flux incident upon the PV module's surface area during the observational period [28], as shown in Eq. (3) and Eq. (4) respectively:
$\eta_{\text {elect }}={ }^{P_{o p}} /_{\dot{E}_{\text {sun}}}$ (3)
$\dot{E}_{\text {sun}}=I_{\text {rad}} \cdot A_{\text {panel}} \cdot \alpha_g$ (4)
The thermal energy source was obtained from solar radiation $\dot{E}_{\text {sun }}$ as mentioned in Eq. (4). Heat dissemination from the PV module to the PCM will occur via conduction, facilitated by direct physical interaction between the heatsink enclosure and the PCM [29], as shown in Eq. (5):
$\dot{Q}_{\text {cond}}=-k A \frac{d T}{d x}$ (5)
The contact surface between the heat sink and PCM consists of two different layers. When two materials in contact have different properties and characteristics, the thermal resistance between the layers is compared [30]. The thermal resistance is determined by cumulatively summing the resistances of individual strata, a calculation depicted in Eq. (6):
$R_{t o t}=\frac{L_1}{k_1 A}+\frac{L_1}{k_1 A}$ (6)
Based on changes in thermal resistance, heat transfer is evaluated using Eq. (7):
$\dot{Q}_{\text {cond}}=\Delta T / R_{\text {total}}$ (7)
The subsequent formula quantifies the thermal energy utilization of a photovoltaic thermal (PVT) system, considering the heat absorbed and subsequently stored by the PCM. This thermal utility serves as a metric for assessing the PCM's efficacy as a thermal energy reservoir (TES) [31], which can be formulated in Eq. (8):
$\eta_{\text {th}}=\dot{E}_{P C M} / \dot{E}_{\text {sun}}$ (8)
where, $\dot{E}_{P C M}$ is the thermal power that the PCM can absorb and $\dot{E}_{\text {sun}}$ is the effective solar radiation entering the system. The thermal energy from PCM can be determined using the relation [32]:
$\dot{E}_{P C M}= \left\{\begin{array}{l}\frac{m_{\mathrm{pcm} \cdot} C_p \cdot\left(T_{\mathrm{pcm}, t}-T_{\mathrm{pcm}, t o}\right)}{t-t_o}, \quad t < t_1\\ \frac{m_{\mathrm{pcm}} \cdot C_p \cdot\left(T_{\mathrm{pcm}, t_1}-T_{\mathrm{pcm}, t o}\right)}{t-t_o}+\frac{m_{\mathrm{pcm}} \cdot h}{t-t_i}, t_1 \leq t \leq t_2\end{array}\right.$ (9)
Performance evaluations of solar PVT systems are typically based on three key metrics: thermal efficiency, electrical efficiency, and overall efficiency. These performance indicators are mathematically defined by Eq. (3) and Eq. (8). The comprehensive efficiency of solar PV systems is derived by applying a power conversion factor, a necessary adjustment due to the substantial quantity of electrical energy involved [33].
$\eta_{\text {total}}=\eta_{\text {elect}}+\eta_{\text {th}}$ (10)
The results related to temperature, power, electrical efficiency, and thermal efficiency of each model are presented and discussed in this section.
3.1 Influence of cooling system on temperature
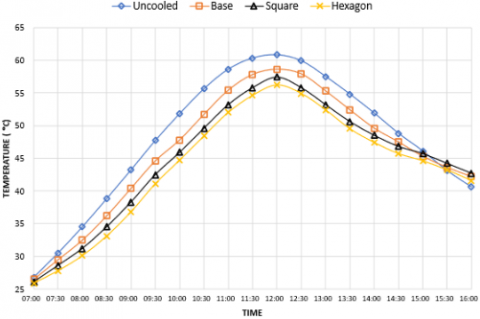
Several PCM-based heatsink configurations were analyzed to maintain optimal operational temperatures for solar panels (PV) under four experimental conditions: uncooled panels and panels equipped with PCM heatsinks in Base, Square, and hexagon models. Continuous temperature readings were documented commencing at 7:00 a.m. and concluding at 4:00 p.m. The diurnal temperature fluctuations observed during the experimental phase are depicted in Figure 4. It was consistently observed that the panel lacking any cooling mechanism exhibited the highest thermal readings, with peak temperatures approaching 60.8℃ during the interval from 11:30 a.m. to 12:00 p.m. Integrating a PCM cooling system into all tested models successfully reduced the operational temperature of the panels. The base model showed a significant decrease, peaking at around 58.6℃. The square model further optimized thermal performance, with a peak temperature of around 57.4℃. Meanwhile, the hexagon model proved to be the most effective, maintaining a peak temperature in the range of 56.2℃.
Figure 4. Relationship of temperature and time
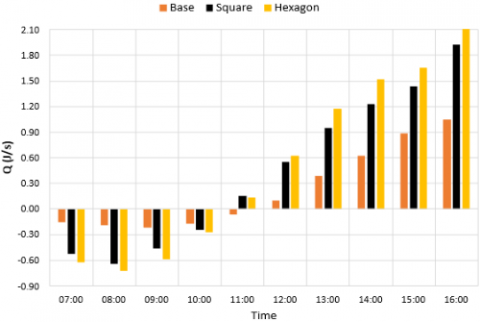
The temperature difference between these configurations is most pronounced at high solar radiation intensities. As a result, the hexagonal configuration facilitates enhanced heat dissipation and thermal regulation, thereby promoting greater electrical performance and sustained operational integrity of PV modules. The enhanced thermal conductivity could be attributed to an augmented contact surface area between the heat dissipation element and the PCM. The hexagonal model has a contact surface area of 0.8069 m², representing a 50.8% increase compared to the base model, which has a contact surface area of 0.3968 m². This difference causes a variation in the heat transfer rate, as indicated by Eq. (5). Figure 5 shows the heat transfer rate $(\dot{Q})$ profile of various PCM-based cooling system configurations during testing. This data reflects the dynamics of heat energy absorption and release by PCM in response to fluctuations in solar irradiation and operational temperature. The lower curve $(-\dot{Q})$ represents the phase in which the PCM absorbs heat from the heatsink system or during initial heating. In contrast, the upper curve $(+\dot{Q})$ shows the mechanism of thermal energy accumulation by the PCM, followed by the dissipation of sensible heat after a change in the PCM properties or during cooling.
Figure 5. Comparison of $\dot{Q}$ from heatsink to PCM
Figure 5 distinctly illustrates the pattern of heat flow rates across the three employed cooling methodologies. In the early hours (around 7:00 a.m. to 11:00 a.m.), all models show negative Q values, indicating that the PCM actively absorbs heat from the environment and solar panels. At 7:00 a.m., the hexagon model exhibited the highest heat absorption, with a value of approximately -0.62 J/s, followed by the square model with a value of roughly -0.51 J/s, and the base model with a value of approximately -0.18 J/s. This demonstrates the effectiveness of Hexagon in quickly absorbing residual heat in the morning. After 11:00 a.m., all models switched to positive Q values, indicating a phase where PCM began to store heat or release it to the environment wisely, and the panel temperature increased. The hexagon model consistently showed the highest positive heat transfer rate, peaking at around 2.19 J/s at 4:00 p.m. This demonstrates superior heat storage and/or heat release capabilities compared to other models, allowing the panel to maintain a more stable temperature at its peak. This difference demonstrates that the Hexagon design is most optimal in managing the thermal load on solar panels, resulting in a positive impact on temperature reduction.
3.2 The electrical power generated
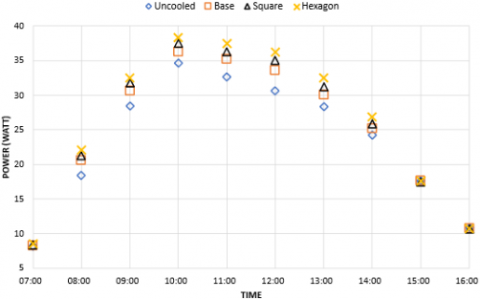
The decrease in panel operating temperature caused by PCM cooling can enhance PV energy conversion, leading to increased electrical power [34]. Figure 6 shows the electrical energy generated by the panel per hour. This graph generally illustrates the diurnal variations in power output, which are indicative of both the solar irradiance levels and, more crucially, the efficiency of the thermal management system in regulating the PV operational temperature.
Figure 6. Power generated from a solar panel
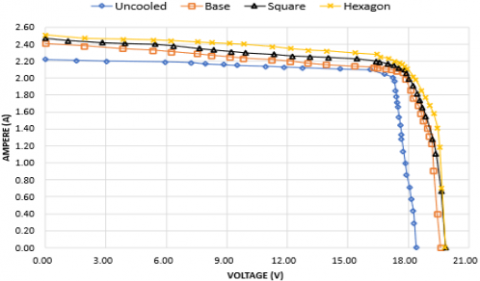
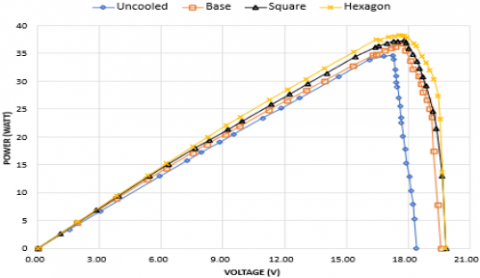
Figure 6 shows that all panels equipped with PCM cooling systems consistently generate higher electrical power than panels without cooling. The cooling system's optimal performance is particularly evident in the hexagon model, achieving a peak power generation of roughly 38.11 W at 10:00 a.m., followed by the square model with 37.42 W and the base model with 36.78 W. In comparison, panels without a cooling system were only able to reach a peak power of approximately 35.16 W during the same period. For comparative analysis, the enhancements in solar panel efficiency are depicted through characteristic I-V and P-V curves (Figures 7 and 8). This distinction corroborates the inverse relationship observed between reduced panel operating temperatures, facilitated by PCM cooling, and augmented electrical power generation. The hexagon model, previously established as superior in thermal energy management, also exhibited the most favourable electrical power production outcomes. This suggests that the hexagon model's capacity for dissipating surplus heat and sustaining an appropriate operating temperature directly correlates with improved electrical conversion efficiency.
Figure 7. I-V curve performance
Figure 8. P-V curves performance
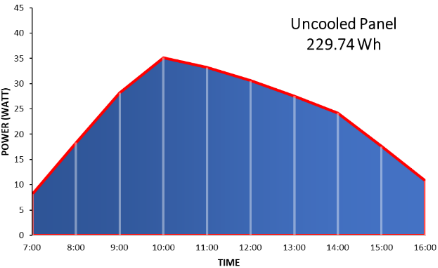
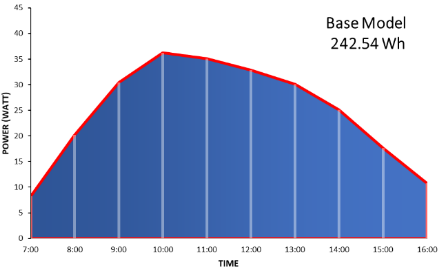
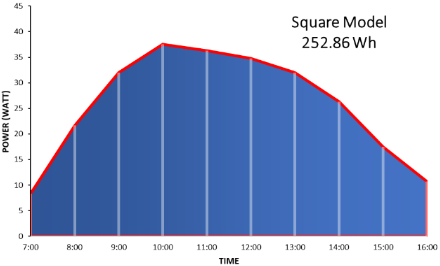
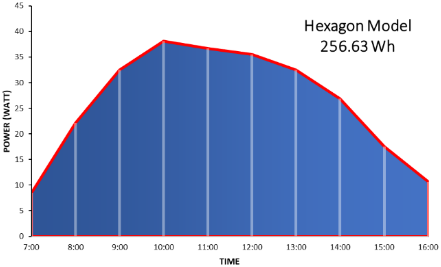
Figure 9. Total daily power generated (a) uncooled panel (b) base model (c) square model (d) hexagonal model
Daily power production is presented in Figure 9, which provides a quantitative overview of the relative effectiveness of each system. Each graph shows the power profile generated throughout the day. Energy generation escalates during the morning hours, reaches its maximum at midday, and subsequently declines in the afternoon. A comparison of each area reveals that all configurations with PCM cooling systems yield a significant increase in total daily power production compared to Uncooled Panels, which are only capable of producing a total power of approximately 229.74 Wh. Meanwhile, the base model generates approximately 242.54 Wh, the square model at 252.86 Wh, and the hexagon model generates the highest value of roughly 256.63 Wh.
This increase in power is not only reflected in the cumulative total but also in the higher trend of power production throughout the day for configurations with PCM, especially during peak radiation conditions. The power curve for the hexagon model, for example, tends to be at the top of the graph, indicating that the hexagonal PCM design effectively keeps the panel temperature lower, which in turn increases conversion efficiency and, integrally, electrical power production. This trendline analysis demonstrates that the use of PCM, particularly with hexagonal designs, plays a crucial role in enhancing solar panel performance.
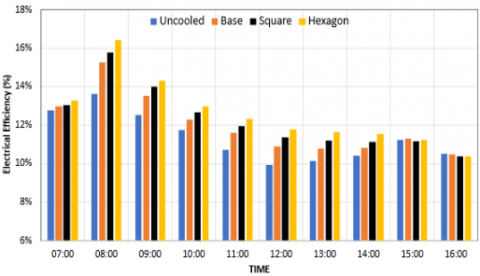
3.3 PV efficiency
The performance of solar panels can be assessed based on their efficiency. The efficiency generated is directly correlated with the increment in energy output [35]. The determination of PV module efficiency is achieved via Eq. (3), with the resultant computations illustrated in Figure 10. The reference module exhibits a comparatively lower efficiency, attributed to the elevated operational temperatures recorded throughout the experimental duration. A common phenomenon observed is a decrease in efficiency as the panel temperature increases, especially during peak hours of solar radiation when the panel temperature tends to rise. Models with PCM cooling can maintain the panel temperature at an optimal level, resulting in high efficiency. At maximum power output, the hexagon model achieves an efficiency of approximately 12.82%, followed by the box model at 12.64%, and the base model at 12.21%. In contrast, panels without cooling can only achieve an efficiency of around 11.62%.
Figure 10. Electrical efficiency generated
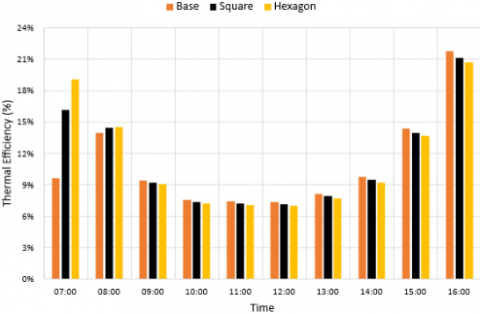
There appears to be a tendency for the electrical efficiency of all configurations to gradually decline over time, especially after reaching its peak in the morning. This decline is predominantly attributable to heightened atmospheric and panel operational temperatures, which attain their maximum levels during daylight hours. This phenomenon confirms that the use of PCM is very effective in mitigating the adverse effects of temperature increases on the electrical efficiency of solar panels, with the hexagonal design showing greater advantages in maintaining optimal performance. An evaluation of the system's thermal performance was also undertaken utilizing Eq. (8). A comparative representation of the thermal efficiencies for each system is presented in Figure 11.
Figure 11. Thermal efficiency generated
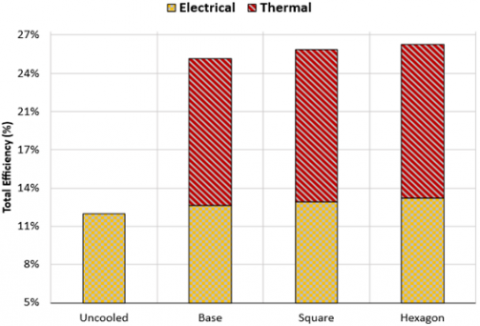
In terms of thermal efficiency, all configurations generally show dynamic trends throughout the day. Initially, the hexagon model shows higher thermal efficiency in the morning at 07:00 (around 19%), compared to the base model (around 9.8%) and the square model (around 16.5%). Nonetheless, a marginal reduction in performance is evident across all configurations between roughly 9:00 a.m. and 11:00 a.m., attributable to the PCM reaching its thermal saturation limit concerning heat assimilation. As the day progressed towards the afternoon, there was a significant recovery and increase in thermal efficiency. This pronounced escalation, particularly conspicuous from 2:00 p.m. to 4:00 p.m., was understood as the dissipation of latent heat previously stored by the PCM as ambient temperatures started to decline, consequently augmenting thermal efficacy. At 4:00 p.m., the basic model reached a peak thermal efficiency of approximately 21.7%, followed by the square model at approximately 21.0%, and the hexagon model at approximately 20.3%. This shows that although the hexagon model performs very well in the early hours, the base model and square model demonstrate stronger thermal recovery and more sustainable heat dissipation capabilities at the end of the day. A comparison of the overall daily performance of the systems is shown in the thermal efficiency displayed in Figure 12. The total daily efficiency values for the panel without cooling, the base model, the square model, and the hexagonal model are 11.35%, 23.92%, 24.58%, and 25.11%, respectively.
Statistical analysis in PVT systems was conducted using the ANOVA method to evaluate the effect of the variables studied (Base, Square, and Hexagon). Table 4 shows the ANOVA results evaluating electrical efficiency. The intensity of solar irradiation exerts a highly substantial influence on electrical efficiency, demonstrated by an F-value of 45.0450 and a notably low P-value of 5.89 × 10⁻¹⁴. This substantiates that heightened solar irradiation significantly promotes enhanced electrical efficiency. Furthermore, the classification of the model also impacts electrical efficiency, with an F-value of 17.6860 and a P-value of 1.5 × 10⁻⁶, indicating considerable statistical significance. This implies that variations in model designs, encompassing Base, Square, and Hexagonal structures, contribute to the improvement of the electrical output of PVT systems.
Figure 12. Total daily efficiency generated
Table 4. Evaluation of electrical efficiency with ANOVA
|
Source of Variation |
SS |
df |
MS |
F-Statistic |
P-Value |
F Crit |
|
Type of PCMs |
0.006997 |
9 |
0.00078 |
45.0450 |
5.89 × 10⁻¹⁴ |
2.2501 |
|
Heatsink Models |
0.000916 |
3 |
0.00031 |
17.6860 |
1.5 × 10⁻⁶ |
2.9604 |
|
Error |
0.000466 |
27 |
1.73 × 10⁻⁵ |
|
|
|
|
Total |
0.008379 |
39 |
|
|
|
|
Table 5. Evaluation of thermal efficiency with ANOVA
|
Source of Variation |
SS |
df |
MS |
F-Statistic |
P-Value |
F Crit |
|
Type of PCMs |
0.075141 |
9 |
0.00835 |
33.3765 |
1.99 × 10⁻⁹ |
2.4563 |
|
Heatsink Models |
0.000158 |
2 |
0.00079 |
3.62597 |
0.04667 |
3.5546 |
|
Error |
0.004503 |
18 |
0.00025 |
|
|
|
|
Total |
0.079802 |
29 |
|
|
|
|
Table 5 shows the ANOVA results for assessing the significance level of thermal performance. Solar radiation intensity also has a significant effect on thermal efficiency, as indicated by an F-value of 33.3765 and a P-value of 1.99 × 10⁻⁹. This implies that fluctuations in radiation intensity exert a statistically significant influence on thermal efficiency. Furthermore, the model's designation demonstrates an effect, though not statistically significant, evidenced by an F-value of 3.62597 and a P-value of 0.04667. These numerical results approach the conventional threshold for statistical significance. Nevertheless, they suggest a favorable inclination in the representation of heatsink container configurations (Base, Square, and Hexagon) toward enhancing the thermal efficiency of the PVT system.
In light of the significance metrics examined across the two tabular presentations, the computed P-value falls beneath the 0.05 threshold, thereby signifying that the independent variables of this investigation exert a discernible impact [36]. Consequently, it is substantiated that the geometrical configuration, as embodied by the heatsink model, influences the holistic effectiveness of the PVT system, affecting both its electrical and thermal outputs.
This investigation presents a thorough empirical assessment concerning the influence of heatsink configuration on the operational efficacy of PVT systems augmented with PCM, specifically within the context of tropical meteorological environments. The results unequivocally demonstrate that integrating PCM with optimized fin geometries is a highly effective strategy for enhancing both electrical and thermal performance compared to uncooled panels.
The three tested configurations (Base, Square, and Hexagon) reveal that the hexagon model emerges as the most promising design. It demonstrates sustained peak electrical conversion rates across the diurnal cycle, with notable preeminence during periods of maximal solar irradiance, and manifests enhanced thermal regulation capacities, particularly during the crucial early morning and extended afternoon intervals. This is attributed to its geometric efficiency in maximizing surface area for heat transfer while promoting a more uniform thermal gradient within the PCM.
Statistical analysis using ANOVA proves that the choice of heatsink geometry is a significant factor affecting system performance, with statistically significant differences in efficiency between the models. Consequently, this underscores the pivotal role of fin architecture in the engineering of advanced PVT-PCM systems. In tropical applications where high ambient temperatures pose a significant constraint, the use of hexagonal heatsinks provides a reliable and effective solution for enhancing power output, stabilizing module temperatures, and maximizing overall energy conversion efficiency. These findings provide a transparent and data-driven path for optimizing PVT technology in real-world applications in similar climates.
The researchers extend their sincere appreciation to the Department of Mechanical Engineering and the Faculty of Engineering at Sebelas Maret University in Indonesia for furnishing essential research infrastructure. Financial backing for this study was provided by the Directorate of Research and Community Service, affiliated with the Indonesian Ministry of Higher Education, Science, and Technology. This support was rendered through the PTM research program Sebelas Maret University, specifically under Grant Number 1186.1/UN27.22/PT.01.03/2025.
|
Pmax |
maximum power generated (W) |
|
Isc |
maximum current (A) |
|
Vsc |
maximum voltage (V) |
|
Pop |
optimal power generated (W) |
|
Iop |
optimal current (A) |
|
V op |
optimal voltage (V) |
|
Esun |
solar energy generation (W) |
|
Irad |
solar radiation intensity (W/m2) |
|
A |
area surface (m2) |
|
Epcm |
energy generated by PCM (J) |
|
Eelect |
electrical energy generation (Wh) |
|
Qcond |
heat transfer (J/s) |
|
R |
thermal conductivity (W/m.K) |
|
Cp |
specific heat capacity (J.kg-1.K-1) |
|
k |
thermal conductivity (W.m-1.K-1) |
|
T |
temperature (℃) |
|
m |
mass (kg) |
|
Greek symbols |
|
|
$\alpha$ |
significance factor |
|
$\alpha_{\mathrm{g}}$ |
absorptivity (%) |
|
h |
efficiency (%) |
[1] Sivashankar, M., Selvam, C., Manikandan, S. (2021). A review on the selection of phase change materials for photovoltaic thermal management. IOP Conference Series: Materials Science and Engineering, 1130(1): 012026. https://doi.org/10.1088/1757-899x/1130/1/012026
[2] Intergovernmental Panel on Climate Change. (2014). Summary for policymakers. In Climate Change 2013–The Physical Science Basis, pp. 1-30. https://doi.org/10.1017/CBO9781107415324.004
[3] Badi, N., Alghamdi, S.A., El-Hageen, H.M., Albalawi, H. (2023). Onsite enhancement of REEEC solar photovoltaic performance through PCM cooling technique. PLOS ONE, 18(3): e0281391. https://doi.org/10.1371/journal.pone.0281391
[4] Benghanem, M., Attia, M.E.H., Abdelgaied, M., Harby, K., Bedairi, B.H. (2025). A multifaceted experimental approach for enhancing solar distiller productivity: Nano-coated heat coil integrated with solar nanofluid collector, nano-coated absorber, nano-enhanced PCM, reflectors, and PV panels. International Communications in Heat and Mass Transfer, 167: 109401. https://doi.org/10.1016/j.icheatmasstransfer.2025.109401
[5] Usman, A., Xiong, F., Aftab, W., Qin, M., Zou, R. (2022). Emerging solid-to-solid phase-change materials for thermal-energy harvesting, storage, and utilization. Advanced Materials, 34(41): e2202457. https://doi.org/10.1002/adma.202202457
[6] Prakash, K.B., Pasupathi, M.K., Chinnasamy, S., Saravanakumar, S., Palaniappan, M., Alasiri, A., Chandrasekaran, M. (2023). Energy and exergy enhancement study on PV systems with phase change material. Sustainability, 15(4): 3627. https://doi.org/10.3390/su15043627
[7] Fauzi, M., Kurniawan, B., Fachredzy, A., Nabawi, M.A.H., Tetuko, A.P. (2025). Paraffin-based phase change materials (PCM) with enhanced thermal conductivity through particle addition and encapsulation techniques for thermal energy storage: A critical review of materials science. Trends in Sciences, 22(9): 10308. https://doi.org/10.48048/tis.2025.10308
[8] Arifin, Z., Prasetyo, S.D., Tribhuwana, B.A., Tjahjana, D.D.D.P., Rachmanto, R.A., Kristiawan, B. (2022). Photovoltaic performance improvement with phase change material cooling treatment. International Journal of Heat and Technology, 40(4): 953-960. https://doi.org/10.18280/ijht.400412
[9] Verma, K., Prakash, O., Paikra, A.S., Tiwari, P. (2023). Photovoltaic panel integration using phase change material (PCM): Review. Evergreen, 10(1): 444-453. https://doi.org/10.5109/6782147
[10] Almeshaal, M., K Babu, P., Chinnasamy, S., P, M.K., Subramanian, S. (2024). Influence of different melting points of phase change material on photovoltaic phase change materials system performance: An energy, exergy, and environmental point of view. Energy Technology, 13(7): e202400286. https://doi.org/10.1002/ente.202400286
[11] Durez, A., Sohail, M.U., Ali, M., Khan, U.A. (2024). Thermal analysis and efficiency enhancement of solar modified PV panels through organic PCM under climate conditions of Pakistan. Mehran University Research Journal of Engineering and Technology, 43(1): 97-111. https://doi.org/10.22581/muet1982.2401.2679
[12] Beevi, S.J., Mahabuba, A., Gopinath, S.K., Varshini, S.V., Shoaib, A., Abdul Munaf, R.N. (2025). Enhancing solar panel efficiency through cost-effective cooling strategies. Key Engineering Materials, 1008: 79-92. https://doi.org/10.4028/p-b5wj0o
[13] Kareem, B.E., Adham, A.M., Yaqob, B.N. (2024). Experimental and numerical investigation of a real-scale air to multiple PCM heat exchanger. Journal of Building Engineering, 89: 109323. https://doi.org/10.1016/j.jobe.2024.109323
[14] Salihi, M., El Fiti, M., Harmen, Y., Chhiti, Y., Chebak, A., Jama, C. (2024). Efficiency enhancement of photovoltaic module using bio-based eutectic phase change material: An experimental study. E3S Web of Conferences, 545: 02001. https://doi.org/10.1051/e3sconf/202454502001
[15] Meng, E., Tian, R., Li, J., Zhao, H. (2025). Study on simulation and optimization of thermal performance of PV-PCM roof in China. International Communications in Heat and Mass Transfer, 166: 109145. https://doi.org/10.1016/j.icheatmasstransfer.2025.109145
[16] Bria, A., Raillani, B., Chaatouf, D., Salhi, M., Amraqui, S., Mezrhab, A. (2023). Effect of PCM thickness on the performance of the finned PV/PCM system. Materials Today: Proceedings, 72: 3617-3625. https://doi.org/10.1016/j.matpr.2022.08.409
[17] Metwallya, H., Mahmouda, N.A., Aboelsouda, W., Ezzatb, M. (2022). Comprehensive analysis of PCM container construction effects PV panels thermal management. Advance in Environmental Waste Management & Recycling, 5(3): e10010. https://doi.org/10.33140/aewmr.05.03.010
[18] Rabani, M., Rabani, M., Mehrjardi, M.Z. (2025). Experimental assessment of ceiling cooling systems incorporating PCM in flat and domed roofs: Energy, environmental, and economic performance in hot-dry climates. Energy Reports, 14: 1661-1679. https://doi.org/10.1016/j.egyr.2025.08.009
[19] Madurai Elavarasan, R., Nadarajah, M., Pugazhendhi, R., Gangatharan, S. (2024). An experimental investigation on coalescing the potentiality of PCM, fins and water to achieve sturdy cooling effect on PV panels. Applied Energy, 356: 122371. https://doi.org/10.1016/j.apenergy.2023.122371
[20] Said, Z., Ahmad, F.F., Radwan, A.M., Hachicha, A.A. (2023). New thermal management technique for PV module using Mist/PCM/Husk: An experimental study. Journal of Cleaner Production, 401: 136798. https://doi.org/10.1016/j.jclepro.2023.136798
[21] Elminshawy, N.A.S., Elminshawy, A., Osama, A. (2023). An innovative cooling technique for floating photovoltaic module: Adoption of partially submerged angle fins. Energy Conversion and Management: X, 20: 100408. https://doi.org/10.1016/j.ecmx.2023.100408
[22] Nadjemi, O., Nacer, T., Hamidat, A., Salhi, H. (2017). Optimal hybrid PV/wind energy system sizing: Application of cuckoo search algorithm for Algerian dairy farms. Renewable and Sustainable Energy Reviews, 70: 1352-1365. https://doi.org/10.1016/j.rser.2016.12.038
[23] Sattler, P., Rosenbaum, M. (2025). Choice of the hypothesis matrix for using the Anova-type-statistic. Statistics & Probability Letters, 219: 110356. https://doi.org/10.1016/j.spl.2025.110356
[24] Jones, A., Darabi, J. (2024). Effect of fin geometry on the thermal performance of a phase change material heatsink. Applied Thermal Engineering, 236: 121973. https://doi.org/10.1016/j.applthermaleng.2023.121973
[25] Amrizal, Falah, C.A., Amrul, Irsyad, M., Yonanda, A. (2025). Performance study of photovoltaic/thermal (PV/T) collector with cross-cut fins. Journal of Physics: Conference Series, 2972(1): 012014. https://doi.org/10.1088/1742-6596/2972/1/012014
[26] Fakhraei, O., Gorjian, S., Ghobadian, B., Najafi, G. (2024). Experimental performance evaluation of a dual-purpose photovoltaic-thermal system with phase change material for passive heating and cooling. Journal of Building Engineering, 98: 111494. https://doi.org/10.1016/j.jobe.2024.111494
[27] Kong, X., Zhang, L., Li, H., Wang, Y., Fan, M. (2022). Experimental thermal and electrical performance analysis of a concentrating photovoltaic/thermal system integrated with phase change material (PV/T-CPCM). Solar Energy Materials and Solar Cells, 234: 111415. https://doi.org/10.1016/j.solmat.2021.111415
[28] Basyar, K., Arifin, Z., Tjahjana, D.D.D.P., Prasetyo, S.D. (2024). Analysis of the impact of different fin configurations as passive coolants on photovoltaic performance. International Journal of Heat and Technology, 42(6): 2115-2124. https://doi.org/10.18280/ijht.420630
[29] Peng, Q., Li, D., Sun, X., Li, J., Zhou, Y., Zeng, L. (2025). Experimental and numerical investigation on photovoltaic/thermal characteristics of an integrated PV/T-PCM system with metal fin and heat exchange pipe. Renewable Energy, 239: 122113. https://doi.org/10.1016/j.renene.2024.122113
[30] Elsheniti, M.B., Zaheer, S., Zeitoun, O., Fouly, A., Abdo, H.S., Almutairi, Z. (2024). An experimental assessment of a solar PVT-PCM thermal management system in severe climatic conditions. Journal of Building Engineering, 97: 110691. https://doi.org/10.1016/j.jobe.2024.110691
[31] NematpourKeshteli, A., Iasiello, M., Langella, G., Bianco, N. (2024). Using metal foam and nanoparticle additives with different fin shapes for PCM-based thermal storage in flat plate solar collectors. Thermal Science and Engineering Progress, 52: 102690. https://doi.org/10.1016/j.tsep.2024.102690
[32] Li, M., Yang, Z., Lu, L., Yin, K., Lu, Y. (2023). Investigation on thermal and electrical performance of late-model plate-and-tube in water-based PVT-PCM collectors. Sustainability, 15(7): 5988. https://doi.org/10.3390/su15075988
[33] Huang, G., Wang, K., Markides, C.N. (2021). Efficiency limits of concentrating spectral-splitting hybrid photovoltaic-thermal (PV-T) solar collectors and systems. Light: Science & Applications, 10(1): 44. https://doi.org/10.1038/s41377-021-00465-1
[34] Rajamony, R.K., Paw, J.K.S., Pandey, A.K., Suraparaju, S.K., et al. (2024). Thermal analysis and thermal regulation of photovoltaic thermal system using serpentine tube absorber with modified multi-walled carbon nanotubes enhanced PCM. Journal of Thermal Analysis and Calorimetry, 149(24): 14643-14662. https://doi.org/10.1007/s10973-024-13845-7
[35] Sheikholeslami, M., Khalili, Z., Mousavi, S.J. (2023). Influence of self-cleaning coating on performance of photovoltaic solar system utilizing mixture of phase change material and Graphene nanoparticle. Journal of Building Engineering, 77: 107540. https://doi.org/10.1016/j.jobe.2023.107540
[36] Kuncoro, I.W., Arifin, Z., Budiana, E.P., Hijriawan, M. (2023). Improvement performance twisted Savonius wind turbine on hybrid system: Effect of flat plate deflector installation. International Journal of Heat and Technology, 41(3): 742-748. https://doi.org/10.18280/ijht.410330