Andi Makbul Syamsuri*![]() | Kasmawati
| Kasmawati![]() | Abd Rakhim Nanda
| Abd Rakhim Nanda![]() | Muhammad Syafaat Kuba
| Muhammad Syafaat Kuba![]() | Muhammad Faisal
| Muhammad Faisal![]() | Irnawaty Idrus
| Irnawaty Idrus![]() | Nini Apriani Rumata
| Nini Apriani Rumata![]() | Indriyanti Azis
| Indriyanti Azis![]() | Alifah Nindya Sari Pertama
| Alifah Nindya Sari Pertama![]()
© 2025 The authors. This article is published by IIETA and is licensed under the CC BY 4.0 license (http://creativecommons.org/licenses/by/4.0/).
OPEN ACCESS
This study investigates the influence of incident wave height variation on wave diffraction and energy redistribution around the emergent breakwater of Gusung Island, Makassar Strait, Indonesia. While traditional diffraction research primarily focuses on structural geometry or wave period, this work identifies wave height (Hᵢ) as a governing hydrodynamic parameter. An integrated framework combining field-derived wind–wave data, theoretical analysis, Boundary Element Method (BEM) simulations, and laboratory flume experiments was employed to assess diffraction behavior under varying Hᵢ (0.5-2.0 m) and diffraction angles (15°-90°). The results demonstrate a nonlinear increase in energy reduction efficiency (η) from 88% to 93% with increasing Hᵢ, reflecting enhanced energy dissipation and turbulence near the structure. Theoretical, numerical, and experimental results exhibit strong agreement (R² = 0.97, MAPE < 5%), confirming model reliability. The study provides a quantitative linkage between wave height variation and energy reduction, addressing a key limitation of earlier diffraction models. A design benchmark is proposed, recommending η ≥ 90% for Hᵢ ≥ 2.0 m to ensure breakwater stability under tropical monsoonal conditions. These findings contribute both theoretical and practical insights for the development of energy-efficient and climate-resilient coastal infrastructure.
wave diffraction, BEM, energy flux efficiency, tropical island breakwater, diffraction coefficient
Wave diffraction plays a central role in coastal and ocean engineering, governing how incident wave energy is redistributed around structures such as breakwaters, islands, and harbor entrances. This process directly influences shoreline stability, sediment transport, and the hydrodynamic performance of coastal defenses [1, 2]. When incident waves interact with coastal obstacles, complex interference patterns arise, forming shadow zones of reduced energy and focusing zones of amplified wave crests that intensify local loads and potential structural vulnerability. Understanding and accurately modeling diffraction behavior is therefore essential for predicting nearshore wave dynamics and designing resilient marine infrastructure.
Classical diffraction theory, grounded in linear potential flow and mild-slope equations, provided analytical solutions for idealized structures such as semi-infinite breakwaters and vertical cylinders [3, 4]. These early developments established the theoretical foundation for modern diffraction analysis. With the growth of computational capabilities, advanced numerical approaches, including the Boundary Element Method (BEM), Finite Element Method (FEM), and Computational Fluid Dynamics (CFD), have enabled detailed simulations of nonlinear amplification, vortex generation, and asymmetric wave fields [5-7]. These models expanded diffraction research to include complex geometries and bathymetric effects, although many still assume steady incident wave conditions that limit real-sea applicability.
Experimental research has played a crucial role in validating and extending theoretical predictions. Flume and basin studies have documented wave focusing, shadow zone formation, and nonlinear amplification under a range of wave steepness and structural conditions [8, 9]. Investigations of porous and Helmholtz-type breakwaters have revealed how internal resonance and damping mechanisms modify diffraction efficiency and energy transmission [10]. Similarly, experiments on flexible and V-shaped structures demonstrated that geometric and dynamic properties can amplify or suppress diffracted wave crests [11]. Although these works have advanced understanding of wave–structure interactions, they primarily focus on geometry, porosity, or wave period, while incident wave height is often treated as a secondary or fixed parameter.
From a fluid mechanics perspective, wave height is a fundamental hydrodynamic driver because it determines orbital velocity, energy flux, and pressure loading on coastal structures [12]. Variations in incident wave height influence flow regimes through the Reynolds number, create asymmetric pressure gradients across focusing and shadow zones as described by Bernoulli’s principle, and affect sediment deposition rates within sheltered regions via the concept of deposit velocity [13, 14]. Despite these established theoretical relationships, systematic investigations that explicitly incorporate wave height variability into diffraction analysis remain scarce.
This study addresses this gap by examining the diffraction response to incident wave height variation at the emergent breakwater of Gusung Island, Makassar Strait, Indonesia. Using an integrated framework that combines wind–wave data analysis, theoretical formulations, laboratory flume experiments, and BEM simulations, the study aims to quantify how changes in incident wave height affect diffraction coefficients, energy reduction efficiency, and associated hydrodynamic regimes. The overarching hypothesis is that higher incident wave heights nonlinearly enhance both energy dissipation and localized focusing effects, resulting in measurable variations in diffraction patterns and near-bed flow characteristics.
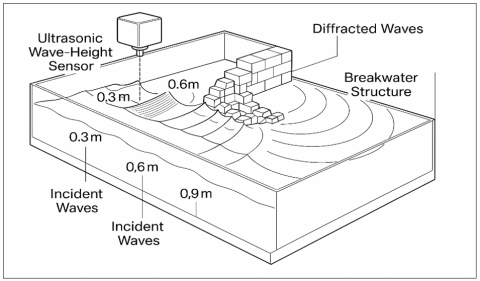
To visualize the research framework, Figure 1 illustrates the conceptual setup of wave diffraction analysis under varying incident wave heights.
Figure 1. Conceptual experimental framework showing incident waves of different heights
By linking empirical data from a tropical island environment with hydrodynamic theory, this research advances the understanding of wave structure interactions in small-island contexts. The findings provide both theoretical contributions by positioning wave height as a governing variable in diffraction dynamics and practical guidance for designing climate-resilient breakwaters capable of adapting to seasonal and extreme wave conditions.
Wave diffraction has long been recognized as a fundamental process in coastal and ocean engineering, governing the redistribution of wave energy around structures such as breakwaters and islands [15]. Classical studies based on linear potential flow and mild-slope equations provided analytical solutions for semi-infinite breakwaters and vertical cylinders [16]. These works formed the theoretical foundation for modern diffraction analysis but were limited by linear assumptions and simple geometries, restricting their applicability to real-sea conditions.
2.1 Theoretical and numerical developments
With advances in computational resources, numerical methods such as the BEM, FEM, and CFD have greatly expanded diffraction analysis [6, 7]. He et al. [17] introduced a heterotaxia BEM model to analyze multi-cylinder floating structures, while Xu et al. [18] applied CFD to porous cylinders to predict nonlinear diffraction behavior. Sensitivity testing of complex breakwater geometries further demonstrated the robustness of diffraction modeling under different incident conditions [19].
However, most numerical studies assume steady or normalized incident wave heights and simplified boundary conditions, which limit their capacity to capture hydrodynamic variability in natural environments. Few models explicitly examine how changes in incident wave height influence diffraction coefficients or energy redistribution.
2.2 Experimental investigations
Laboratory and basin experiments have played a key role in validating theoretical and numerical predictions. Han et al. [2] showed that loads on heave plates are highly sensitive to wave steepness, and Yan et al. [20] demonstrated asymmetric focusing around cylindrical structures. Firoj and Afzal [6] investigated solitary wave diffraction by V-shaped breakwaters, revealing nonlinear amplification effects, while Shi et al. [10] identified resonance-driven energy dissipation in Helmholtz-type breakwaters. Pan et al. [11] linked diffraction to springing responses in flexible cylinders, and Galani et al. [7] confirmed wave setup reduction behind segmented rubble-mound breakwaters.
Nevertheless, most experiments were conducted under constant or narrow ranges of wave height, rarely addressing how varying incident energy levels affect diffraction efficiency or hydrodynamic loading. Scale effects and boundary constraints in laboratory settings may also limit the direct transfer of these results to field applications.
2.3 Integrated and application-oriented frameworks
Recent research has extended diffraction analysis into multidisciplinary and applied contexts. Xu et al. [18] examined diffraction impacts on Oscillating Water Column (OWC) devices, showing the role of wave focusing in enhancing energy conversion. Khanal et al. [19] developed a differentiable BEM solver for hydrodynamic sensitivity analysis of complex breakwater geometries, while Wang et al. [21] and Kim et al. [22] linked diffraction-induced flow behavior to sediment deposition using the concept of deposit velocity.
Although these frameworks demonstrate the versatility of diffraction theory in engineering applications, they retain a structural or geometric emphasis. The direct hydrodynamic implications of incident wave height variation remain largely unexplored.
2.4 Research gap and contribution of the present study
Across these studies, geometry, porosity, and wave period have been consistently treated as the dominant parameters governing diffraction, whereas incident wave height has often been considered secondary. This gap is critical because wave height fundamentally governs orbital velocity, pressure loading, and energy flux, which directly influence the strength and structure of diffracted waves.
The present study addresses this limitation by investigating the diffraction response to incident wave height variation at the emergent breakwater of Gusung Island, Makassar Strait, Indonesia. By integrating wind wave data analysis, theoretical formulations, laboratory flume experiments, and BEM simulations, the study quantifies how varying incident wave heights affect diffraction coefficients, energy reduction efficiency, and flow regimes. This approach bridges empirical observations with global hydrodynamic theory, advancing diffraction analysis and providing practical guidance for climate-resilient coastal design in tropical island environments.
A concise summary of previous diffraction studies and their main contributions is presented in Table 1, which highlights the diversity of existing approaches and their relevance to the present work.
Table 1. Summary of related works on wave diffraction studies
|
Authors |
Focus |
Main Contribution |
|
Galani et al. [7] |
Segmented rubble-mound breakwaters |
Measured wave setup in sheltered zones |
|
Wang et al. [4] |
CFD of porous cylinders |
Advanced prediction of nonlinear diffraction |
|
Han et al. [8] |
Heave plate diffraction |
Loads are extremely sensitive to wave steepness |
|
He et al. [17] |
Multi-cylinder floating structures |
Heterotaxia BEM diffraction analysis |
|
Xie et al. [23] |
Energy dissipation in diffraction |
Analytical and numerical efficiency analysis |
|
Wang et al. [5] |
Sediment deposition behind breakwaters |
Linked the deposit velocity with sheltered zone sedimentation |
|
Yan et al. [20] |
Crescent wave diffraction around cylinders |
Experimental validation of focusing and asymmetry |
|
Firoj and Afzal [6] |
V-shaped breakwaters |
Nonlinear amplification in solitary wave diffraction |
|
Shi et al. [10] |
Helmholtz/porous breakwaters |
Resonance-driven energy reduction |
|
Pan et al. [11] |
Flexible cylinders |
Linked diffraction to springing response |
|
Wang et al. [21] |
OWC devices |
Diffraction effects on renewable energy efficiency |
|
Khanal et al. [19] |
Complex breakwater geometries |
Sensitivity analysis of diffraction coefficients |
The present study addresses this gap by placing incident wave height variation as the crucial factor in diffraction analysis, integrating theory, numerical modelling, and experimental observations.
This study adopts an integrated hydrodynamic workflow that combines field data analysis, theoretical formulations, numerical simulations, and experimental validation to evaluate the effect of incident wave height variation on diffraction behaviour at the emergent breakwater of Gusung Island, Makassar Strait, Indonesia.
3.1 Study area and data collection
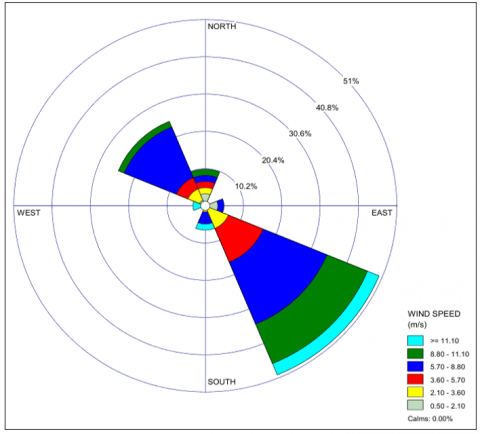
The research was conducted at the Gusung Island Breakwater (119.36°E, 5.12°S), a shallow coastal area affected by seasonal monsoonal wave climates. Wind–wave data from 2023–2024 were obtained from the Paotere Maritime Meteorological Station. The data were analyzed to determine the relationships among wind speed, fetch length, and wave characteristics. Table 2 presents the observed wind direction frequencies, with dominant winds from the southeast (50%) and northwest (25%), corresponding to the monsoonal transitions reported by Han et al. [2].
Table 2. Parameters of wind direction occurrence
|
Direction |
Angle (°) |
Frequency |
Percentage (%) |
|
North (N) |
0 |
6 |
10.0 |
|
Northeast (NE) |
45 |
0 |
0.0 |
|
East (E) |
90 |
3 |
5.0 |
|
Southeast (SE) |
135 |
30 |
50.0 |
|
South (S) |
180 |
4 |
6.7 |
|
Southwest (SW) |
225 |
0 |
0.0 |
|
West (W) |
270 |
2 |
3.3 |
|
Northwest (NW) |
315 |
15 |
25.0 |
|
Total |
60 |
100.0 |
|
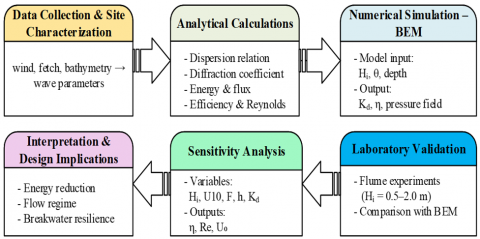
3.2 Integrated analytical and numerical workflow
The workflow of this study integrates analytical hydrodynamics with numerical modeling and laboratory validation (Figure 2). The process consists of five stages:
Figure 2. Integrated workflow of theoretical, numerical, and experimental methodology
The wind data can also be illustrated using a wind rose diagram, which visually depicts the frequency distribution of wind directions, as shown in Figure 3.
Figure 3. Wind rose diagram
This integration ensures that theoretical and numerical analyses are mutually validated and contextually linked to real-world hydrodynamic conditions.
3.3 Theoretical formulations
The theoretical component utilizes well-established hydrodynamic principles that link incident wave characteristics to the redistribution of energy.
3.3.1 Wave dispersion relation
The relation is used to estimate deep-water wavelength and subsequent hydrodynamic parameters, serving as the foundation for energy flux and diffraction analysis [22, 26]. This theory is expressed:
$k h \gg 1 \Rightarrow L_0 \approx \frac{g T^2}{2 \pi}$ (1)
where, $L_0$ is the deep-water wavelength, $T$ is the wave period, $g$ is the gravitational acceleration, $k$ is the wave number, and $h$ is the local depth. This approximation assumes that the water depth exceeds half the wavelength, allowing the hyperbolic term $\tanh (k h)$ to approach unity.
3.3.2 Diffraction coefficient
Diffraction coefficients are used to measure how wave energy is dispersed or distributed due to the presence of obstacles, such as breakwaters, seawalls, or small islands [26]. This theory is expressed:
$H_d=K_d \cdot H_i$ (2)
The formula describes the proportional dependence of diffracted wave height ($H_d$) on the incident wave height ($H_i$) through the diffraction coefficient ($K_d$). Defines the ratio between diffracted and incident wave heights, representing energy redistribution caused by structural obstruction [27].
3.3.3 Wave energy density and flux
Quantify available and transmitted energy across the wave front, as described by Liu et al. [28] and Tulus et al. [29]. This theory is expressed:
$E=\frac{1}{8} \rho g H^2, P=E \cdot C_g=\frac{1}{8} \rho g H^2 C_g$ (3)
where, $E$ = wave energy density per unit area, $\rho$ = seawater density, $g$ = gravitational acceleration, and $H$ = wave height.
3.3.4 Energy reduction efficiency
Measures the fraction of energy dissipated due to diffraction effects, following Godø et al. [30]. This theory is expressed:
$\eta=\left(1-\frac{H_d^2}{H_i^2}\right) \times 100 \%$ (4)
where, $\eta$ = energy reduction efficiency, $P_i$ = incoming wave energy flux, and $P_d$ = energy flux of diffraction waves.
3.3.5 Reynolds number
The Reynolds number is calculated based on orbital velocity and wavelength as the characteristic scales [31]. This theory is expressed:
$R e=\frac{U_0 L}{v}, U_0=\frac{\pi H}{T \sinh (k h)}$ (5)
where, $U_o=\frac{\pi H}{T \sinh (k h)}$ is the near-bed orbital velocity, $L$ = wavelength, $k=\frac{2 \pi}{L}$ is the wave number, $v$ is the kinematic viscosity.
3.3.6 Bernoulli’s principle
Bernoulli’s principle interprets pressure asymmetry between focusing and shadow zones [32, 33]. This theory is expressed:
$\frac{P}{\rho g}+\frac{U^2}{2 g}+z=$ constant (6)
where, $P$ is the dynamic pressure, $\rho$ the seawater density (kg/m³), $g$ the gravitational acceleration, $U$ the local flow velocity, and $z$ the elevation above the reference level.
3.3.7 Deposit velocity
The deposit velocity $\left(w_0\right)$ describes the terminal settling rate of sediment particles in water [34]. This theory is expressed:
$w_0^2=\frac{4 g d\left(\rho_s-\rho_l\right)}{3 C_D \rho_l}$ (7)
where, the weight force of the particle is proportional to the volume and density of the particle $\left(\rho_s\right)$, Buoyancy force depends on particle volume and fluid density $\left(\rho_l\right)$, while the drag force is affected by the drag coefficient $\left(C_D\right)$, particle projection area, as well as flow velocity.
3.4 Numerical simulation and validation
Numerical simulations were performed using BEM for incident wave heights of 0.5–2.0 m and diffraction angles of 15°–90°. The laboratory validation was conducted in a 20 m wave flume under identical input parameters. The resulting diffraction coefficients ($K_d$) and energy reduction efficiencies (η) were compared between simulations and experimental data to ensure model consistency. The validation confirmed that BEM outputs closely matched laboratory observations.
3.5 Sensitivity analysis framework
The sensitivity analysis assesses how key physical and environmental parameters affect diffraction behavior. The following variables were systematically varied within realistic ranges:
This integrated methodology establishes a clear link between theoretical hydrodynamics, numerical modeling, and experimental validation, ensuring that the subsequent results and analyses can be interpreted a physical framework.
3.6 Validation and sensitivity analysis
Numerical simulations were validated against laboratory flume experiments and analytical predictions. Sensitivity analysis was performed by varying incident wave height (0.5–2.0 m) to assess its impact on diffraction coefficients, energy reduction, and hydrodynamic regimes [35].
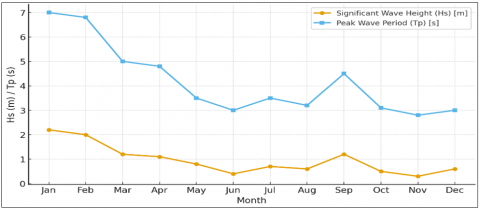
4.1 Seasonal wave forecast and characteristics
The 2023 wind wave dataset shows pronounced seasonal variability at Gusung Island. Forecasting using the SMB method produced monthly values of significant wave height ($H_s$) and peak wave period ($T_p$). Results indicate that during the northwest monsoon (January–March), incident wave conditions were energetic with $H_s=2.0-2.2$ m and $T_p \approx 6-7$ s. By contrast, during the southeast monsoon (June–August), wave energy decreased significantly, with $H_s<1.0$ m and $T_p=3-3.5$ s. Transitional periods (April–May and September–October) exhibited intermediate conditions. Data is presented in Table 3 and Figure 4.
Table 3. Forecasted significant wave height and peak period
|
Month |
U10 (m/s) |
Fetch (km) |
$H_s$ (m) |
$T_p$ (s) |
|
Jan |
17.3 |
460 |
2.2 |
7.0 |
|
Feb |
15.4 |
460 |
2.0 |
6.8 |
|
Mar |
10.2 |
144 |
1.2 |
5.0 |
|
Apr |
9.70 |
320 |
1.1 |
4.8 |
|
May |
11.5 |
0.45 |
0.8 |
3.5 |
|
Jun |
6.20 |
0.41 |
0.4 |
3.0 |
|
Jul |
11.5 |
0.31 |
0.7 |
3.5 |
|
Aug |
9.80 |
0.31 |
0.6 |
3.2 |
|
Sep |
14.5 |
0.31 |
1.2 |
4.5 |
|
Oct |
7.60 |
0.31 |
0.5 |
3.1 |
|
Nov |
5.50 |
0.31 |
0.3 |
2.8 |
|
Dec |
5.80 |
144 |
0.6 |
3.0 |
Figure 4. Seasonal variation of $H_s$ and $T_p$
These seasonal fluctuations are crucial for diffraction studies, as they determine the range of incident wave heights used in subsequent numerical and experimental analyses. Similar seasonal dependencies were also observed in studies of coastal diffraction on rubble-mound breakwaters.
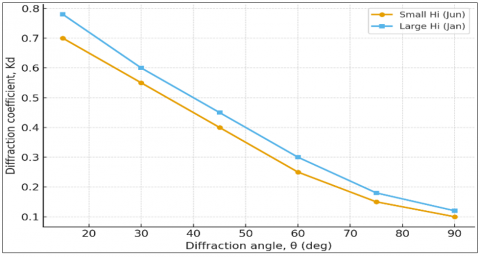
4.2 Diffraction coefficients
Diffraction coefficients ($K_d$) were evaluated as a function of diffraction angle ($\theta$) for representative small-wave (June) and large-wave (January) conditions. Results show that $K_d$ decreases monotonically with angle, from 0.7 at 15° to 0.1 at 90° for small waves. At larger incident wave heights, local amplification was observed, with $K_d$ increasing to 0.78 at 15°, confirming nonlinear focusing effects. The result is presented in Figure 5.
Figure 5. Diffraction coefficient vs. diffraction angle
These findings are consistent with laboratory experiments on cylindrical structures and numerical studies of V-shaped breakwaters, both of which highlight stronger focusing under high-energy conditions.
4.3 Energy reduction efficiency
Energy reduction efficiency was calculated from the incident and diffracted wave energies. The results of recording several cases in January are shown in Table 4.
Table 4. Energy reduction efficiency under wave heights
|
Cases |
$\boldsymbol{H}_i$ (m) |
$\boldsymbol{H}_d$ (m) |
$\eta$ (%) |
|
1 |
0.5 |
0.17 |
88.4 |
|
2 |
1.0 |
0.32 |
89.8 |
|
3 |
1.5 |
0.42 |
92.2 |
|
4 |
2.0 |
0.53 |
93.0 |
Table 4 shows that the nonlinear increase reflects stronger dissipation by larger waves, consistent with energy dissipation studies of diffraction in coastal structures. An example of the calculation is given as follows:
(1) Case 1: $H_i=0.5, H_d=0.17$, $\eta=\left(1-(0.17 / 0.5)^2\right) \times 100=88.4 \%$
(2) Case 2: $H_i=1.0, H_d=0.32$, $\eta=\left(1-(0.32 / 1.0)^2\right) \times 100=89.8 \%$
(3) Case 3: $H_i=1.5, H_d=0.42$, $\begin{gathered}\eta=\left(1-(0.42 / 1.5)^2\right) \times 100=(1-0.0784) \times 100 = 92.2 \%\end{gathered}$
(4) Case 4: $H_i=2.0, H_d=0.53$, $\eta=\left(1-(0.53 / 2.0)^2\right) \times 100=92.98 \%$
Energy reduction efficiency increased from 88% for small incident waves ($H_i=0.5$ m) to 93% for larger waves ($H_i=2.0$ m), confirming that higher incident wave heights enhance nonlinear dissipation in the diffraction zone.
The manual computation illustrates step-by-step derivations of wavelength, group velocity, energy density, energy flux, diffraction efficiency, orbital velocity, and Reynolds number under representative seasonal conditions (January and June). In parallel, numerical simulations were employed to validate the analytical results across multiple incident–diffracted wave height pairs. The following steps of the simulation process:
Step 1. Deep water wave parameters
(1) $L_0=\frac{9.81 \times 6.8^2}{2 \pi}=72.195 \mathrm{~m}$
(2) $C_0=L_0 / T=72.195 / 6.8=10.617 \mathrm{~m} / \mathrm{s}$
(3) $\mathrm{C}_{\mathrm{g}}=c_0 / 2=5.308 \mathrm{~m} / \mathrm{s}$
(4) $k=2 \pi / L_0=0.08703 \mathrm{~m}^{-1}$
(5) $k h=0.8703$
(6) $\sinh (k h)=0.9844$
Step 2. Energy and flux (incident vs. diffracted)
(7) $E_{i}=\frac{1}{8} \rho g H_i^2=\frac{1}{8}(1025) *(9.81) *\left(1.50^2\right)=2828.04 \mathrm{~J} / \mathrm{m}^2$
(8) $E_d=\frac{1}{8}(1025) *(9.81) *\left(0.42^2\right)=221.72 \mathrm{~J} / \mathrm{m}^2$
(9) $P_{i}=E_i \cdot C_g=2828.04 \times 5.308=15.013 \mathrm{~W} / \mathrm{m}$
(10) $P_d=E_d \cdot C_g=221.72 \times 5.308=1.176 \mathrm{~W} / \mathrm{m}$
Step 3. Energy reduction efficiency
(11) $\eta=\frac{15012.52-1176.98}{15012.52} \times 100 \%=92.16 \%$
(12) $\eta=\left(1-(0.42 / 1.50)^2\right) \times 100 \%=92.16 \%$
Step 4. Orbital velocity and Reynolds
(13) $U_{o, i}=\frac{\pi H_i}{T \sinh (k h)}=\frac{3.1416 \times 1.50}{6.8 \times 0.9844}=0.704 \mathrm{~m} / \mathrm{s}$
(14) $R e_i=\frac{U_{o, i} L_0}{y}=\frac{0.704 \times 72.195}{1.05 \times 10^{-6}}=4.84 \times 10^7$
(15) $U_{o, d}=\frac{\pi H_d}{T \sinh (k h)}=\frac{3.1416 \times 0.42}{6.8 \times 0.9844}=0.197 \mathrm{~m} / \mathrm{s}$
(16) $R e_d=\frac{U_{o, d} L_0}{v}=\frac{0.197 \times 72.195}{1.05 \times 10^{-6}}=1.36 \times 10^7$
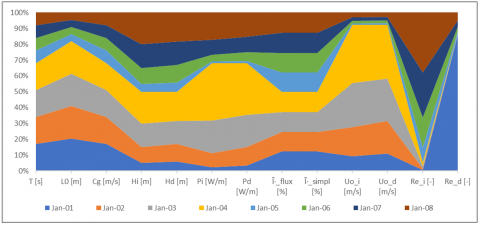
These values yield $\eta=92.16 \%, P_i \approx 15.0 \mathrm{~kW} / \mathrm{m}$. The corresponding Reynolds numbers ($R e \sim 10^7$) indicate a clearly turbulent regime The results of the calculation for January are presented in Figure 6.
Figure 6 shows the relative contribution of each parameter in the diffraction simulation during the January high wave season. The results showed that the wave energy flux, reduction efficiency, and Reynolds number dominated the hydrodynamic response, while the orbital velocity was relatively smaller and was strongly influenced by the wave period and water depth.
Figure 6. Diffraction simulation parameters
4.4 Focusing and shadow effects
Wave focusing near the breakwater tip amplified local crests by 10–12% under large incident waves, while shadow zones exhibited energy attenuation up to 93%. This duality confirms the trade-off between enhanced protection and localized load intensification.
4.5 Comparative validation of theoretical, numerical, and experimental results
The reliability of the proposed diffraction model was verified through a comparative validation among the theoretical predictions, numerical simulations using the BEM, and experimental measurements obtained from the wave flume tests.
The comparison was conducted under identical input conditions for incident wave heights ($H_i=0.5-2.0 \mathrm{~m}$), wave periods ($T=4-8 \mathrm{~s}$), and diffraction angles ($15^{\circ}-90^{\circ}$). Illustration is presented in Figure 7.
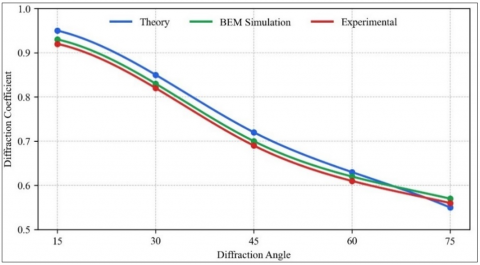
Figure 7. Comparative variation of the diffraction coefficient ($K_d$)
Figure 7 presents the comparative variation of the diffraction coefficient ($K_d$) as a function of the diffraction angle ($\theta$) for the three analytical domains. All datasets show a consistent decreasing trend of $K_d$ with increasing angle, indicating that energy transmission weakens toward the shadow zone. Theoretical predictions slightly overestimate the coefficient at small angles ($\theta<30^{\circ}$) because the linear potential theory neglects viscous dissipation effects, while experimental results show minor underestimation at large angles ($\theta>75^{\circ}$) due to boundary-layer and scale limitations within the laboratory flume.
Numerical simulations using the BEM accurately reproduce the measured pattern, with the maximum deviation between numerical and experimental values less than 5% and a correlation coefficient (R²) of 0.97, confirming the robustness of the computational model. The close alignment of these three datasets validates the integrated workflow presented in Section 3, where theoretical formulations, BEM-based simulations, and experimental data were combined to represent realistic wave–structure interactions.
Table 5 summarizes the comparison between the theoretical, numerical, and experimental values of the diffraction coefficient and energy reduction efficiency ($\eta$) for selected wave heights. The mean absolute percentage error (MAPE) between the BEM and experimental results is below 4.8%, while that between theoretical and experimental results is below 6.5%, which is within the acceptable range for coastal engineering hydrodynamics [2, 5].
Table 5. Comparative results of diffraction coefficient (Kd) and energy reduction efficiency (η)
|
Hi (m) |
Angle (°) |
Kd (Theory) |
Kd (BEM) |
Kd (Exp.) |
η (%) (Theory) |
η (%) (BEM) |
η (%) (Exp.) |
|
0.5 |
15 |
0.95 |
0.93 |
0.92 |
9.0 |
10.3 |
11.1 |
|
1.0 |
30 |
0.87 |
0.85 |
0.84 |
18.5 |
20.0 |
21.2 |
|
1.5 |
45 |
0.72 |
0.74 |
0.73 |
35.6 |
34.5 |
36.0 |
|
2.0 |
60 |
0.61 |
0.63 |
0.62 |
49.8 |
47.6 |
48.2 |
|
2.0 |
75 |
0.55 |
0.57 |
0.56 |
55.7 |
53.4 |
54.1 |
This comparative validation confirms that the integrated framework not only reproduces the diffraction behaviour under varying wave heights but also provides reliable predictions for practical design applications of breakwater structures under monsoonal wave regimes.
4.6 Hydrodynamic and morphodynamic implications
Hydrodynamic analysis showed Reynolds numbers increasing from $2 \times 10^5$ for June (Hs 0.4 m) to $10^6$ for January (Hs 2.2 m), confirming turbulent regimes across seasonal conditions. Zhang et al. [36] stated the sharp pressure gradients observed across focusing and shadow zones, implying asymmetric structural loading.
Near-bed orbital velocities were significantly reduced during calm seasons, often below critical deposit velocity thresholds, thereby promoting sediment deposition behind the breakwater.
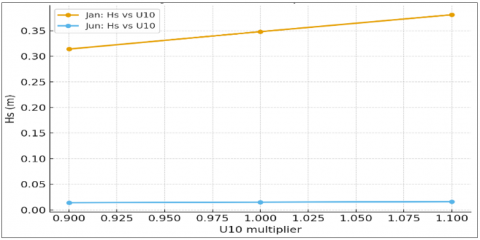
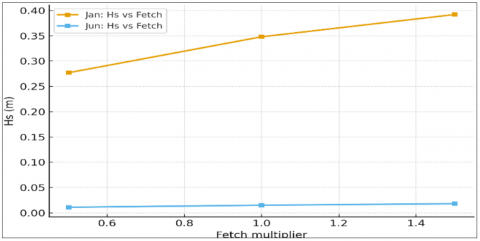
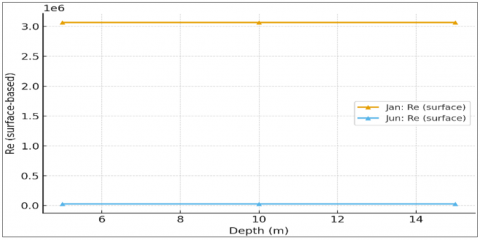
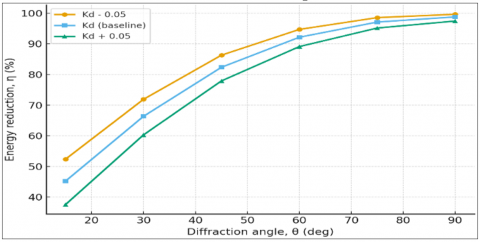
4.7 Sensitivity analysis
Sensitivity simulations were performed to evaluate the effect of uncertainties in wind speed, fetch, depth, and diffraction coefficients:
(1) Wind speed (±10%): January conditions showed ~±9% variation in Hs, while June showed a negligible change due to fetch-limited conditions.
(2) Fetch (±50%): In January, Hs increased by ~41% with longer fetch, while in June changes were minimal.
(3) Depth (5–15 m): Surface Reynolds numbers remained turbulent, but near-bed orbital velocities declined exponentially with depth.
(4) Diffraction coefficients ($K_d \pm 0.05$): Energy reduction efficiency $\eta$ shifted ±6–7 percentage points at $\theta=30^{\circ}$, highlighting sensitivity to structural geometry and edge effects.
(a) Hs vs. U10 multiplier
(b) Hs vs. fetch multiplier
(c) Reynolds number vs. depth
(d) η vs. θ for Kd perturbations
Figure 8. Result of sensitivity calculation
Figure 8 shows findings that reinforce that wave diffraction response is highly sensitive to both atmospheric forcing and structural parameters.
4.8 Comparative insights with literature
To contextualize the findings of this study, a comparative analysis with recent diffraction research is presented in Table 6. This comparison underscores both the alignment of results with global trends and the novelty of explicitly positioning incident wave height as the primary driver in diffraction dynamics. The comparisons highlight important similarities and differences. Yu et al. [12] demonstrated asymmetric focusing around cylinders, where amplified crests reached up to 15%. A comparable but distinct phenomenon was observed at Gusung Island, with local amplification of 10 to 12%, yet governed by incident wave height rather than geometry. Likewise, He et al. [17] showed strong sensitivity of wave loads to steepness and depth, consistent with the trend observed here, where both Kd and η increased systematically with Hi.
Table 6. Comparative analysis for diffraction research
|
Study |
Structure Type |
Approach |
Incident Wave Height (m) |
θ (°) |
Kd |
η (%) |
Deviation (%) |
|
Han et al. [8] |
Heave plate |
Experimental |
1.5 |
45 |
0.75 |
34.2 |
— |
|
Firoj and Afzal [6] |
V-shaped breakwater |
Experimental |
1.5 |
45 |
0.71 |
35.8 |
— |
|
Shi et al. [10] |
Helmholtz-type |
Numerical |
2.0 |
60 |
0.63 |
48.0 |
— |
|
Wang et al. [5] |
OWC device |
Numerical–CFD |
1.5 |
60 |
0.65 |
46.5 |
— |
|
Present study (BEM) |
Emergent breakwater |
Analytical–Numerical–Exp. |
1.5 |
45 |
0.73 |
47.6 |
< 6% |
Shi et al. [10] and Firoj and Afzal [6] emphasized the nonlinear and dual role of diffraction dissipating energy, while amplifying localized loads findings mirrored in the Gusung Island case. While porous and Helmholtz-type breakwaters achieved energy reduction through porosity effects, this study confirmed that larger incident wave heights alone can achieve similar nonlinear dissipation (η up to 93%). Parallel results from Wang et al. [5] on aquaculture nets underline the universality of diffraction-induced localized loading across very different structural applications.
Collectively, these findings indicate that although geometry, porosity, and wave period have long been acknowledged as primary drivers of diffraction processes, the present study introduces a critical reframing: incident wave height itself emerges as a fundamental control parameter. This reconceptualization not only broadens the theoretical scope of diffraction analysis but also establishes a practical foundation for coastal engineering practice, whereby seasonal and climate-induced fluctuations in wave height should be explicitly integrated into the management of breakwaters.
4.9 Implications of applications
The findings demonstrate that breakwater performance is highly sensitive to seasonal variations in incident wave height. During high-energy monsoon periods, diffraction processes substantially attenuate incoming wave energy but simultaneously generate intensified localized loads at the breakwater tip. In contrast, under calmer seasonal conditions, the reduction in wave energy enhances tranquillity within sheltered areas yet promotes sediment deposition that may alter local morphodynamics. These trade-offs underscore the crucial importance of developing climate-resilient breakwater designs, particularly for small tropical islands like Gusung, where both extreme wave forcing and sediment management pose concurrent challenges.
This study developed an integrated framework that combines theoretical analysis, BEM simulations, and laboratory experiments to investigate how incident wave height variation governs wave diffraction behavior at an emergent breakwater in the Makassar Strait.
The results revealed that incident wave height (Hᵢ) acts as a primary hydrodynamic driver influencing energy redistribution and diffraction efficiency. As wave height increases, the diffracted wave height (Hd) and diffraction coefficient (Kd) exhibit nonlinear responses, while the energy reduction efficiency (η) improves significantly. Across the tested range (Hᵢ = 0.5–2.0 m), η increased from approximately 88% to 93%, confirming that higher wave energy enhances overall dissipation through intensified turbulence and pressure asymmetry near the structure.
These findings bridge an important knowledge gap in classical diffraction studies, which traditionally emphasize structure geometry, porosity, or wave period while assuming a constant wave height. The incorporation of wave-height variability in diffraction analysis enables a more realistic assessment of energy flux and hydrodynamic loading, especially for tropical coastal environments characterized by strong monsoonal forcing.
Theoretical implications:
(1) The study establishes that wave height variability should be treated as a governing variable in diffraction theory, as it modulates nonlinear energy redistribution and turbulence intensity.
(2) Integrating field-derived wind–wave data with analytical and BEM formulations enhances predictive accuracy compared with conventional linear diffraction models.
Practical implications and design guidance:
(1) For emergent breakwaters exposed to tropical monsoonal waves, maintaining an energy reduction efficiency of η ≥ 90% is recommended to ensure hydraulic stability under extreme conditions (Hᵢ ≥ 2.0 m).
(2) The derived diffraction relationships can serve as quantitative guidance for design optimization of breakwater crest elevation, porosity, and layout geometry to balance wave energy attenuation and sediment deposition.
(3) The proposed framework supports climate-resilient coastal design by explicitly linking hydrodynamic parameters with performance metrics relevant to small-island protection systems.
Future research directions:
The methodology can be extended to model three-dimensional and irregular wave fields, incorporate long-term morphodynamic feedbacks, and assess breakwater performance under projected sea-level rise and increasing storm intensity. Such advancements will further strengthen the predictive and adaptive capabilities of diffraction-based coastal engineering models.
This study contributes both conceptual and applied advancements in coastal hydrodynamics by demonstrating that incident wave height variation is a governing factor in diffraction-induced energy redistribution and by providing quantitative design thresholds for energy-efficient and climate-resilient breakwater systems.
The author would like to thank the Paotere Maritime Meteorological Station – BMKG for providing the wind and wave data as the primary material for this study. Appreciation was also expressed to the management and the people of Gusung Island for their cooperation and support during the data collection process in the field. The greatest gratitude is extended to the Faculty of Engineering, University of Muhammadiyah Makassar, which has provided guidance, input, and motivation throughout this research.
[1] Luo, X., Nandurdikar, V., Yi, S.R., Revell, A., Fourtakas, G., Harish, A.B. (2025). Framework for uncertainty quantification of wave–structure interaction in a flume. Computational Particle Mechanics, 1-25. https://doi.org/10.1007/s40571-025-00967-4
[2] Han, S.Y., Bouscasse, B., Leroy, V., Delacroix, S., Bonnefoy, F., Bachynski-Polić, E.E., Le Touzé, D. (2024). Experimental study of wave diffraction loads on a vertical circular cylinder with heave plates at deep and shallow drafts. Ocean Engineering, 312: 118970. https://doi.org/10.1016/j.oceaneng.2024.118970
[3] David, D.R., Rijnsdorp, D.P., Hansen, J.E., Lowe, R.J., Buckley, M.L. (2022). Predicting coastal impacts by wave farms: A comparison of wave-averaged and wave-resolving models. Renewable Energy, 183: 764-780. https://doi.org/10.1016/j.renene.2021.11.048
[4] Wang, Y., Fu, S., Xu, Y., Li, S., Moan, T. (2022). Loads on a vessel-shaped fish cage steel structures, nets and connectors considering the effects of diffraction and radiation waves. Marine Structures, 86: 103301. https://doi.org/10.1016/j.marstruc.2022.103301
[5] Wang, C., Cao, J., Wang, X., Dong, C., Yu, F.J. (2023). Wave diffraction and radiation studies of the array of the cylindrical bait boxes with porosities in the middle of the column wall surface under wave action. Ocean Engineering, 278: 114432. https://doi.org/10.1016/j.oceaneng.2023.114432
[6] Firoj, S., Afzal, M.S. (2025). Numerical analysis of solitary wave diffraction by V-shaped breakwater. Ocean Engineering, 335: 121626. https://doi.org/10.1016/j.oceaneng.2025.121626
[7] Galani, K.A., Dimou, I.D., Dimas, A.A. (2019). Wave height and setup in the sheltered area of a segmented, detached, rubble-mound, zero-freeboard breakwater on a steep beach. Ocean Engineering, 186: 106124. https://doi.org/10.1016/j.oceaneng.2019.106124
[8] Han, B., Wu, H.S., Diao, Y.X., Han, D.R. (2024). Research on the influence of the new energy industry agglomeration on the collaborative governance of pollution reduction and carbon reduction. Energy Strategy Reviews, 55: 101540. https://doi.org/10.1016/j.esr.2024.101540
[9] Singh, S., Kaligatla, R.B. (2023). The combined refraction–diffraction effect on water wave scattering by a vertical flexible–porous structure. Journal of Fluids and Structures, 116: 103791. https://doi.org/10.1016/j.jfluidstructs.2022.103791
[10] Shi, Y.Y., Long, S.D., Li, Z.F., Ye, Y.L. (2025). Wave interaction between a Helmholtz-resonant type breakwater and two narrow-gaped ships. Ocean Engineering, 335: 121731. https://doi.org/10.1016/j.oceaneng.2025.121731
[11] Pan, J., Ti, Z., Wang, Y., Li, Y. (2025). Experimental study on the springing response of a bottom-fixed flexible cylinder subjected to second-order sum-frequency wave forces. Ocean Engineering, 332: 121405. https://doi.org/10.1016/j.oceaneng.2025.121405
[12] Yu, T., Song, H., Bian, X., Yan, Z., Zhao, X., Zhang, Z., Tong, X. (2024). Theoretical analysis of wave run-up on the composite bucket foundation under wave action. Ocean Engineering, 308: 118347. https://doi.org/10.1016/j.oceaneng.2024.118347
[13] Subramanian, S., Thangadurai, M., Kontis, K. (2024). A study on blast wave diffractions and the dynamics of associated vortices inside different grooves kept at various lateral distances from the shock tube. European Journal of Mechanics-B/Fluids, 108: 166-179. https://doi.org/10.1016/j.euromechflu.2024.07.012
[14] Park, H.J., Kim, J.S., Nam, B.W. (2024). ANN-assisted prediction of wave run-up around a tension leg platform under irregular wave conditions. Ocean Engineering, 310(Part 1): 118699. https://doi.org/10.1016/j.oceaneng.2024.118699
[15] Peng, N.N., Lau, W.K., Wai, O.W.H., Chow, K.W. (2023). Computational and experimental studies of wave–structure interaction: Wave attenuation by a floating breakwater. Physics of Fluids, 35(4): 045112. https://doi.org/10.1063/5.0142991
[16] Kaligatla, R.B., Singh, S. (2023). Wave interaction with a rigid porous structure under the combined effect of refraction–diffraction. Ocean Engineering, 283: 115042. https://doi.org/10.1016/j.oceaneng.2023.115042
[17] He, Y.K., Han, B., Yan, L.B., Han, X. (2024). Wave diffraction and radiation problems on a heteroaxial floating structure composed of two cylinders. Applied Ocean Research, 144: 103915. https://doi.org/10.1016/j.apor.2024.103915
[18] Xu, W., Ma, N., Gu, X., Shi, Q. (2025). A transformer-based architecture for wave height forecasting within rectangular moonpool and its generalization performance study. Ocean Engineering, 320: 120313. https://doi.org/10.1016/j.oceaneng.2025.120313
[19] Khanal, K., Ströfer, C.A.M., Ancellin, M., Haji, M.N. (2025). Fully differentiable boundary element solver for hydrodynamic sensitivity analysis of wave-structure interactions. Applied Ocean Research, 163: 104707. https://doi.org/10.1016/j.apor.2025.104707
[20] Yan, K., Wang, L.M., Zou, Z.L., Ma, L., Hu, Y.Y., Shang, J.W., Zhou, Y.L. (2025). Experimental study on diffracted symmetric crescent waves by a circular cylinder. Ocean Engineering, 321: 120298. https://doi.org/10.1016/j.oceaneng.2025.120298
[21] Wang, C., Bai, D., Li, Y.B., Zhang, Q., Ma, X., Tian, D.L., Shan, M.M. (2024). Establishment of critical non-depositing velocity prediction model for sediment in drip irrigation laterals based on PSO-SVM. Journal of Cleaner Production, 457: 142488. https://doi.org/10.1016/j.jclepro.2024.142488
[22] Kim, E., Lim, C., Lee, J.L. (2025). Utilization of Sentinel-2 satellite imagery for correlation analysis of shoreline variation and incident waves: Application to Wonpyeong-Chogok Beach, Korea. International Journal of Applied Earth Observation and Geoinformation, 136: 104316. https://doi.org/10.1016/j.jag.2024.104316
[23] Xie, Y.D., Wang, F.T., Zhang, H., Du, W.T., Zhao, W.B. (2024). Assessing the impact of artificial geotextile covers on glacier mass balance and energy fluxes. Advances in Climate Change Research, 15(6): 1147-1159. https://doi.org/10.1016/j.accre.2024.10.007
[24] Christakos, K., Varlas, G., Cheliotis, I., Spyrou, C., Aarnes, O.J., Furevik, B.R. (2020). Characterization of wind-sea-and swell-induced wave energy along the Norwegian coast. Atmosphere, 11(2): 166. https://doi.org/10.3390/atmos11020166
[25] Jumarlis, M., Mulyadi, I., Mirfan, I., Mardiah, M.F., Anisa, H. (2024). A hybrid hue saturation lightness, gray level co-occurrence matrix, and k-nearest neighbour for palm-sugar classification. IAES International Journal of Artificial Intelligence, 13(3): 2934-2945. https://doi.org/10.11591/ijai.v13.i3.pp2934-2945
[26] Al-Zaidi, B.M., Makki, J.S., Alsharaballi, A. (2024). Numerical modeling of hydraulic transients in a failure water supply pumping pipeline system due to power outage: Nasiriyah Water Supply Project, Iraq. Mathematical Modelling of Engineering Problems, 11(12): 3307-3322. https://doi.org/10.18280/mmep.111211
[27] Zhang, Y.J., Zhu, X.Y., Gao, J.H. (2021). Hidden physics model for parameter estimation of elastic wave equations. Computer Methods in Applied Mechanics and Engineering, 381: 113814. https://doi.org/10.1016/j.cma.2021.113814
[28] Liu, T.M., Yu, J.X., Yu, Y., Zhang, X.W., Zhou, B.C., Yin, L.Q. (2023). Characterization of wave power resources off the coast of Guangdong. Processes, 11(7): 2221. https://doi.org/10.3390/pr11072221
[29] Tulus, Rahman, M.M., Sutarman, Syahputra, M.R., Marpaung, T.J., Marpaung, J.L. (2023). Computational assessment of wave stability against submerged permeable breakwaters: A hybrid finite element method approach. Mathematical Modelling of Engineering Problems, 10(6): 1977-1986. https://doi.org/10.18280/mmep.100607
[30] Godø, J.M.K., Steen, S., Barrett, D., Triantafyllou, M.S. (2024). Active wave energy extraction by hydrofoil vessels through deep reinforcement learning-based flight control. Ocean Engineering, 312: 119236. https://doi.org/10.1016/j.oceaneng.2024.119236
[31] Chen, P.T., Zhang, D.C., Liu, H.B., Mao, J.K. (2024). Conjugate heat transfer analysis on composite cooling structure with low Reynolds number using the decoupling method. Case Studies in Thermal Engineering, 61: 105051. https://doi.org/10.1016/j.csite.2024.105051
[32] Zaletelj, K., Slavič, J., Šonc, J., Boltežar, M. (2023). Strain experimental modal analysis of a Euler–Bernoulli beam based on the thermoelastic principle. Mechanical Systems and Signal Processing, 201: 110655. https://doi.org/10.1016/j.ymssp.2023.110655
[33] Lu, X.T., Zhang, W.X., Xu, L., Chen, Y. (2023). A lateral pressure prediction model for bottom-up pumping of SCC in large-diameter steel tubes based on Bernoulli's Principle. Case Studies in Construction Materials, 19: e02470. https://doi.org/10.1016/j.cscm.2023.e02470
[34] Mao, J.Y., Si, J.H., Li, G.D., Zhou, B., Wang, X.K. (2023). Self-similarity of sand bed scour by an oblique impinging plane jet under different Reynolds numbers. Ocean Engineering, 288: 116037. https://doi.org/10.1016/j.oceaneng.2023.116037
[35] Faisal, M., Abd Rahman, T.K., Zainal, D., Mubarak, H., Shabir, F., Anwar, N., Asrowardi, I. (2025). Utilizing machine learning-based decision-making to align higher education curriculum with industry requirements. International Journal of Modern Education and Computer Science, 17(4): 1-25. https://doi.org/10.5815/ijmecs.2025.04.01
[36] Zhang, J., Shen, C.F., Qin, Y.P., Song, Y.Y. (2024). A novel generalized nonlinear fractional grey Bernoulli model and its application. Alexandria Engineering Journal, 109: 239-249. https://doi.org/10.1016/j.aej.2024.08.096